






Abstract
Diabetic retinopathy is an eye deficiency that affects retina as a result of the patient having diabetes mellitus caused by high sugar levels, which may eventually lead to macular edema. The objective of this study is to design and compare several deep learning models that detect severity of diabetic retinopathy, determine risk of leading to macular edema, and segment different types of disease patterns using retina images. Indian Diabetic Retinopathy Image Dataset (IDRiD) dataset was used for disease grading and segmentation. Since images of the dataset have different brightness and contrast, we employed three techniques for generating processed images from the original images, which include brightness, color and, contrast (BCC) enhancing, color jitters (CJ), and contrast limited adaptive histogram equalization (CLAHE). After image preporcessing, we used pre-trained ResNet50, VGG16, and VGG19 models on these different preprocessed images both for determining the severity of the retinopathy and also the chances of macular edema. UNet was also applied to segment different types of diseases. To train and test these models, image dataset was divided into training, testing, and validation data at 70%, 20%, and 10% ratios, respectively. During model training, data augmentation method was also applied to increase the number of training images. Study results show that for detecting the severity of retinopathy and macular edema, ResNet50 showed the best accuracy using BCC and original images with an accuracy of 60.2% and 82.5%, respectively, on validation dataset. In segmenting different types of diseases, UNet yielded the highest testing accuracy of 65.22% and 91.09% for microaneurysms and hard exudates using BCC images, 84.83% for optic disc using CJ images, 59.35% and 89.69% for hemorrhages and soft exudates using CLAHE images, respectively. Thus, image preprocessing can play an important role to improve efficacy and performance of deep learning models.
Introduction
Retinopathy is a disease of the retina. It occurs due to several reasons in a diabetic person. These reasons include hemorrhage, extrudes, and microaneurysms. Macular edema is fluid build-up in the macula (area in the center of the retina). This causes the macula to swell and hence causes blurry and distorted vision. This fluid buildup is caused by retinopathy, when hemorrhage occurs it also causes the fats and other fluids to leak along with blood.
This is how the segmentation and disease grading task of the Indian Diabetic Retinopathy Image Dataset (IDRiD) dataset [1] given are linked. We will first find the severity of retinopathy and macular edema caused by hemorrhage, extrudes, and microaneurysms. Then we will segment areas affected by hemorrhage, extrudes, and microaneurysms. Figure 1 shows the lesions in the eye and their respective masks [1].
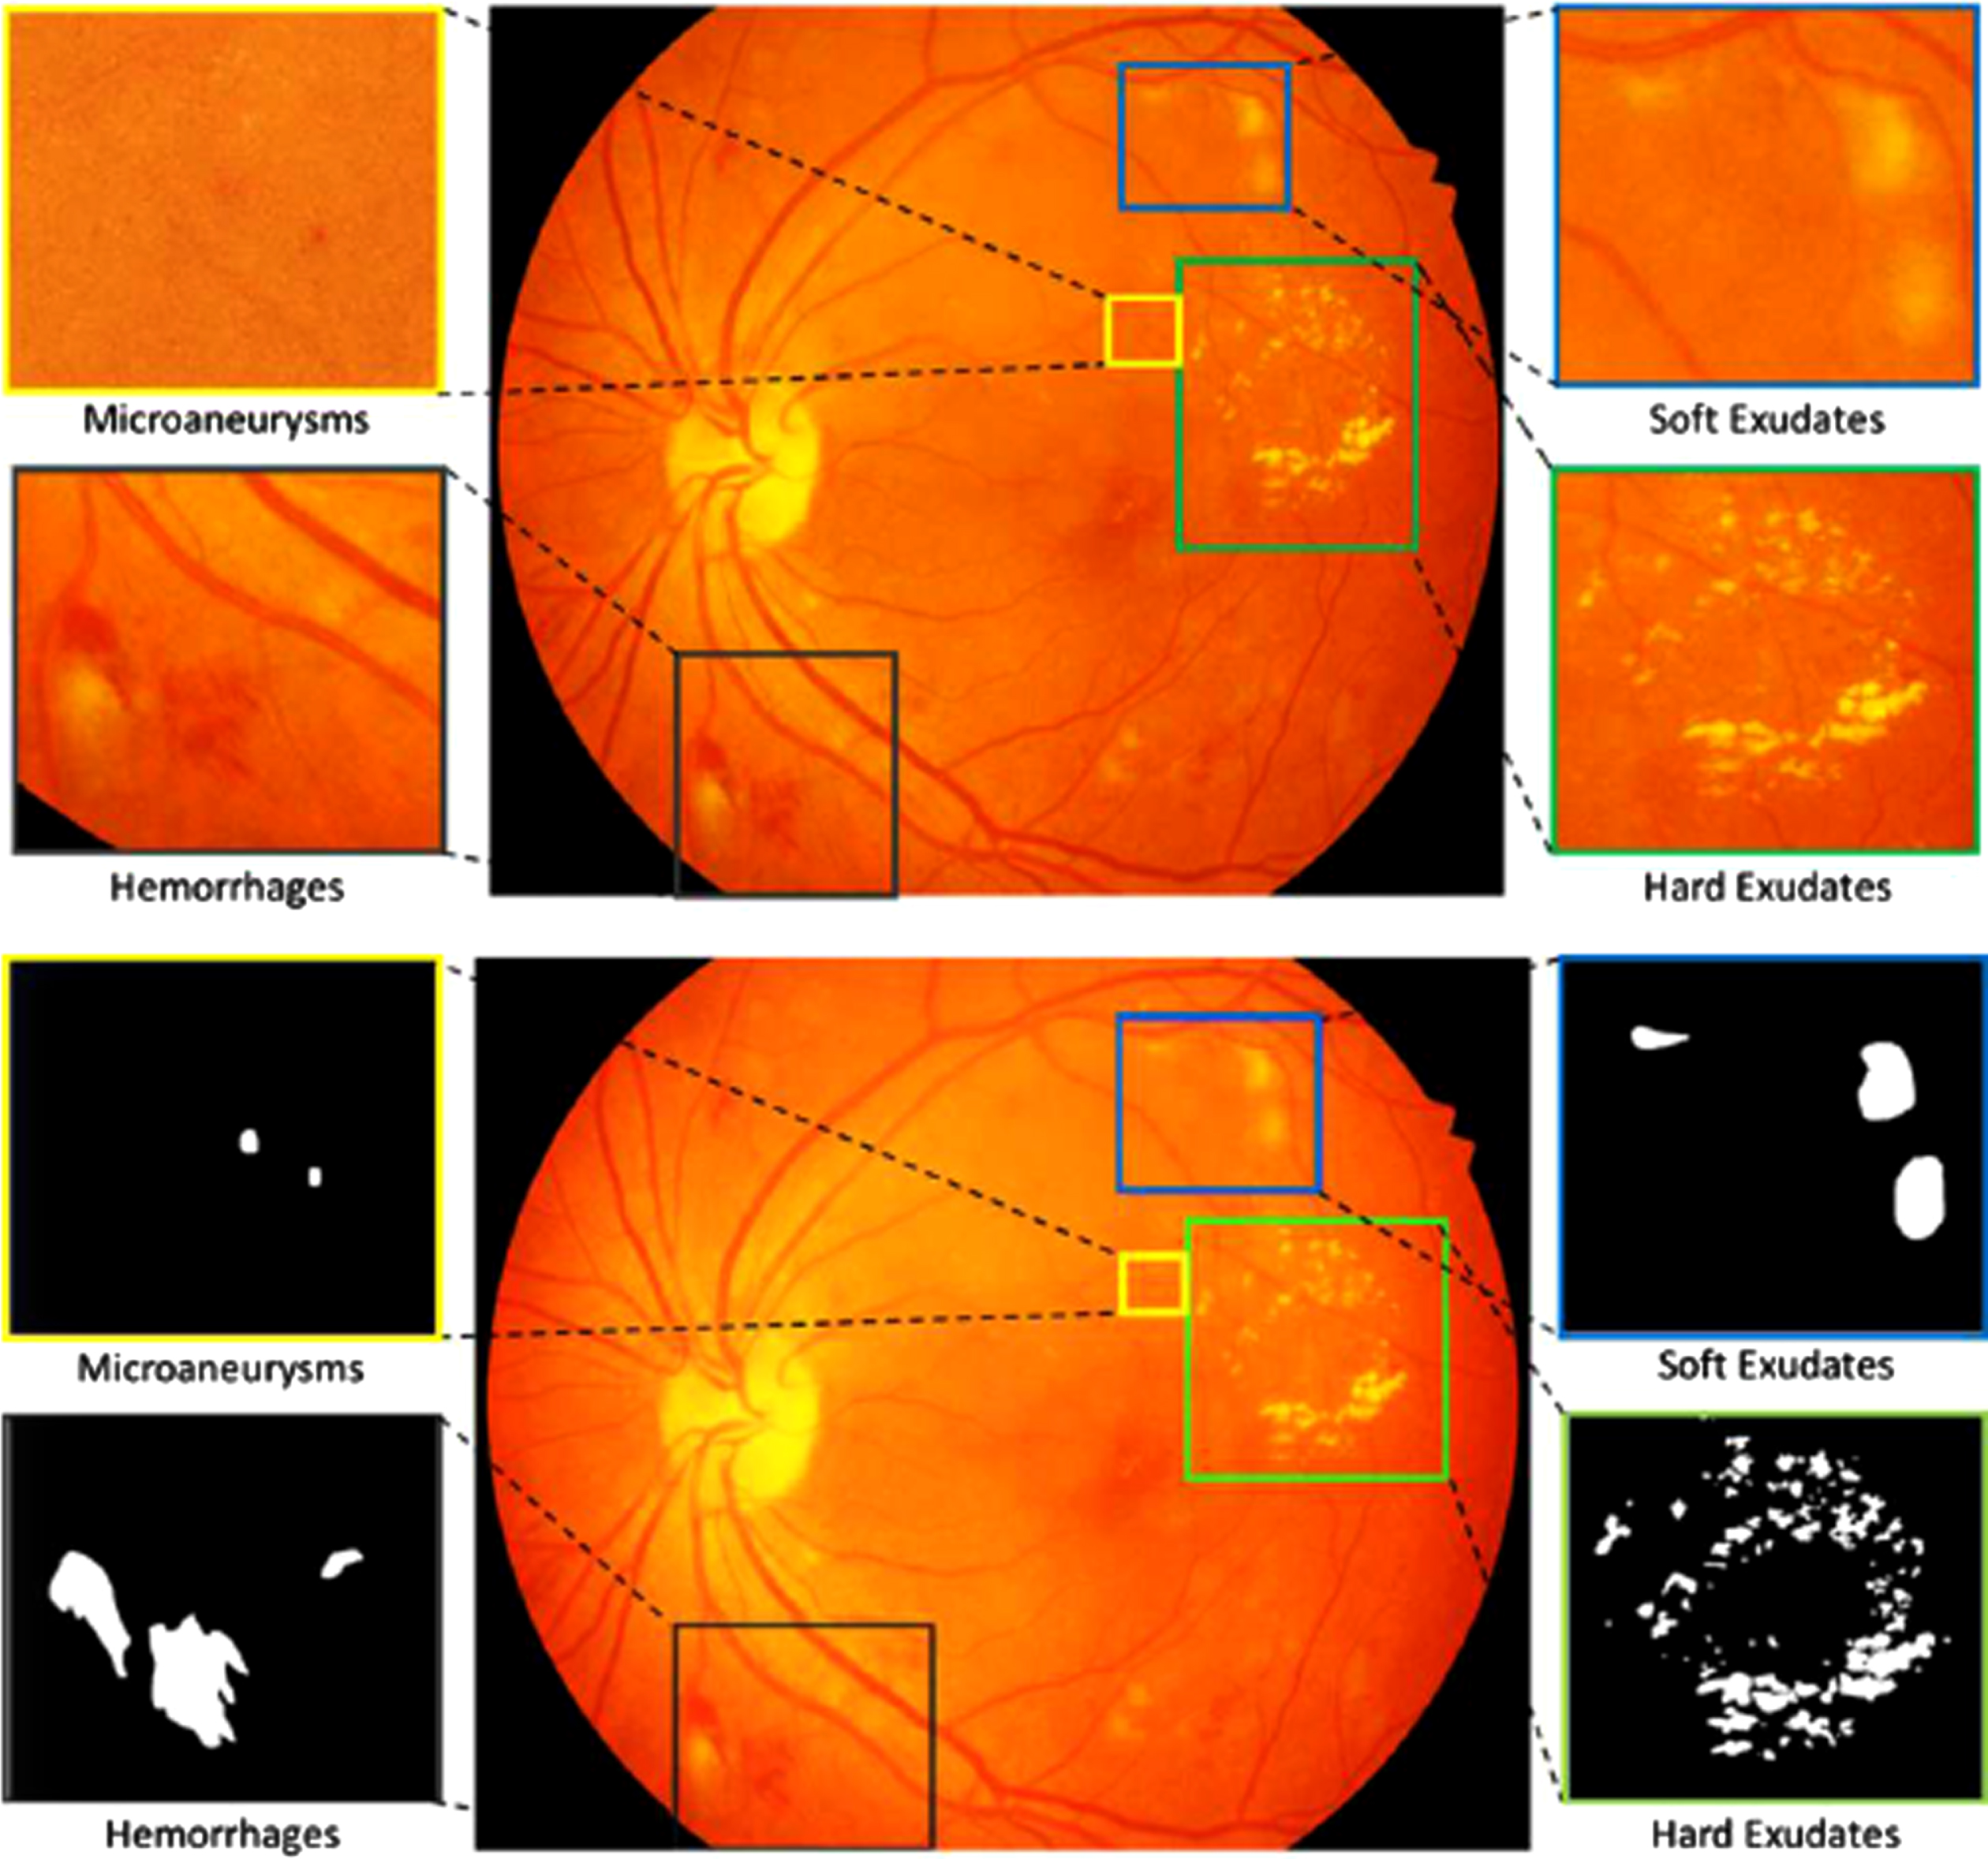
Different retinal lesions and their masks.
Diabetic retinopathy has four stages of progression, which goes from having no DR to proliferative DR. The first stage is type 0, where there are no abnormalities observed meaning there is no DR. The second stage is type 1 called the mild non-proliferative retinopathy and it is characterized by observing micro-aneurysms, it is considered the earliest stage. The next stage, type 2 is moderate no proliferative retinopathy. At this stage, the blood vessels that nourish the retina become distorted and swell thereby losing their ability the carry blood, it is characterized by observing micro-aneurysms, dots, hemorrhages, and spots. The fourth stage is type 3 which is the severe non-proliferative retinopathy that occurs due to blood not reaching the retina due to blockage, hence making the retina grow fresh blood vessels.
The final stage is type 4 which is the proliferative diabetic retinopathy which is an advanced stage that is characterized by either neovascularization of the disc or vitreous hemorrhage. Table 1 shows a summary of the stages.
Severity levels of retinopathy
The main contributions of this paper are as follows: Regeneration of more datasets from the existing dataset using three different methods: Brightness, color and, contrast (BCC) enhancing, Color jitters (CJ), and Contrast Limited Adaptive Histogram Equalization (CLAHE). Performing disease grading classification using three different deep learning models: ResNet50, VGG16, and VGG19. Segmenting the affected areas of the eye after determining which grade it is i.e., from grade 0 to 4 in case of retinopathy. Comparing our work with similar works and suggesting ways to improve the field of retinopathy detecting in general.
For classification of the disease severity levels, ResNet50, VGG16, and VGG19 have been used. These models are selected because there are pre-trained weights available for these models for the ImageNet dataset of 1000 classes. These models can be fine-tuned for our application. Another advantage of using pre-trained models is that they require less training time and fewer resources. Furthermore, these models can be trained on small datasets because weights are already updated to some extent.
Kummar et al. [2] proposed a system that utilized the publicly available Kaggle dataset of retina images five ensembles deep Convolutional Neural Network (CNN) models (ResNet50, InceptionV3, Xception, Dense121, Dense169) which could encode the rich features and improve the classification task for different stages of DR. After the experiment, results show that the proposed model detects all the stages of DR unlike the current methods and does a better job of classification when compared to other state-of-the-art models trained on the same Kaggle dataset. B Tymchenko et al. [3] proposed a system that could automatically detect the stages of diabetic retinopathy by applying deep learning on photography of the human fundus. Additionally, they applied the multistage approach to transfer learning, which made use of a similar dataset but with different labeling. The proposed method could be used as a screening method for early detection of diabetic retinopathy after it got a sensitivity and specificity of 0.99 and is ranked 54 of 2943 among competing methods (quadratic weighted kappa score of 0.925466) on APTOS 2019 Blindness Detection Dataset (13000 images).
Rakhlin [4] made use of deep Convolutional Neural Networks (CNNs) to design a system that could diagnose eye fund us images. They used the publicly available Kaggle dataset to train the model while for testing, they used a portion of the dataset used for training and Messidor-2 reference standard. Neither the withheld Kaggle dataset nor the Messidor-2 was used for training. For Messidor-2 we achieved sensitivity 99%, specificity 71%, and AUC 0.97. These results are close to recent state-of-the-art models trained on much larger data sets and surpass the average results of diabetic retinopathy screening when performed by trained optometrists. They assured that with the continuous development of their models, they expect to increase the accuracy of the model and expand it to cataract and glaucoma diagnostics.
Nguyen et al. [5] presented an automated classification system that analyzed fundus images with varied illumination and fields of view to generate a severity grade for diabetic retinopathy (DR) by using Convolutional Neural Networks (CNN) such as VGG-16 and VGG-19. The proposed system got a sensitivity of 80%, an accuracy of 82%, specificity of 82%, and AUC of 0.904 for classifying images into 5 categories ranging from 0 to 4, where 0 is no DR and 4 is proliferative DR.
XLi [6] proposed an optical coherence tomography (OCT) image-based diagnostic technology for automated early DR diagnosis, including at both grades 0 and 1. The work was aimed at helping ophthalmologists with the evaluation and treatment, thereby reducing the rate of vision loss by enabling timely and accurate diagnosis. They designed and evaluated a novel deep learning network – OCTD Net, for early-stage DR detection. While one of the networks extracted features from the original OCT image, the other extracted retinal layer information. The accuracy, sensitivity, and specificity were 0.92, 0.90, and 0.95, respectively.
Hemanth et al. [7] employed the use of image processing with histogram equalization, and contrast limited adaptive histogram equalization techniques to develop a convolutional neural network that would perform the classification task. The method was validated using 400 retinal fund us images within the MESSIDOR database, and average values for different performance evaluation parameters were obtained as accuracy 97%, sensitivity (recall) 94%, specificity 98%, precision 94%, FScore 94%, and GMean 95%.
Gangwar et al. [8] address the problem of automatic diabetic retinopathy detection and proposed a novel deep learning hybrid to solve the problem. They used transfer learning on pre-trained Inception-ResNet-v2 and added a custom block of CNN layers on top of Inception-ResNet-v2 for building the hybrid model. The performance of the model was evaluated on the Messidor-1 diabetic retinopathy dataset and APTOS 2019 blindness detection (Kaggle dataset). They got an accuracy of 72.33% and 82.18% on the Messidor-1 and APTOS datasets, respectively.
Chakrabarty [9] proposed a method whose primary goal was to automatically classify patients having diabetic retinopathy and not having the same, given any High-Resolution Fundus Image of the Retina. For that, an initial image processing was done on the images which include mainly, conversion of colored (RGB) images into perfect greyscale and resizing it. Then, a Deep Learning Approach was applied in which the processed image was fed into a Convolutional Neural Network (CNN) to predict whether the patient is diabetic or not. This methodology was applied to a dataset of 30 High-Resolution Fund us Images of the retina. The results, so obtained are a 100 % predictive accuracy and a Sensitivity of 100 % also. Such an Automated System can easily classify images of the retina among Diabetic and Healthy patients, reducing the number of reviews of doctors.
Wan et al. [10] attempted to find an automatic way of classifying a given set of fundus images. They used convolutional neural networks (CNNs) for DR detection, which included 3 major difficult challenges: classification, segmentation, and detection. Coupled with transfer learning and hyper-parameter tuning, they adopted AlexNet, VggNet, GoogleNet, ResNet, and analyze how well these models do with the DR image classification. They used the publicly available Kaggle platform for training these models. The best classification accuracy is 95.68% and the results have demonstrated the better accuracy of CNNs and transfer learning on DR image classification.
Qureshi et al. [11] proposed an automatic recognition of the DR stage based on a new multi-layer architecture of active deep learning (ADL). To develop the ADL system, they used a CNN model to automatically extract features compare to handcrafted-based features. However, the training of the CNN procedure required an immense size of labeled data which made it almost difficult in the classification phase.
As a result, a label-efficient CNN architecture is presented known as ADL-CNN by using one of the active learning methods known as an expected gradient length (EGL). This ADL-CNN model can be seen as a two-stage process. At first, the proposed ADL-CNN system selects both the most informative patches and images by using some ground truth labels of training samples to learn the simple to complex retinal features. Next, it provided useful masks for prognostication to assist clinical specialists with the important eye sample annotation and segment regions-of-interest within the retinography image to grade five severity levels of diabetic retinopathy. To test and evaluate the performance of the ADLCNN model, the EyePACS benchmark is utilized and compared with state-of-the-art methods. The statistical metrics are used such as sensitivity (SE), specificity (SP), F-measure and classification accuracy (ACC) to measure the effectiveness of the ADL-CNN system. On 54,000 renography images, the ADL-CNN model achieved an average SE of 92.20%, SP of 95.10%, F-measure of 93%, and ACC of 98%. Hence, the new ADL-CNN architecture is outperformed for detecting DR-related lesions and recognizing the five levels of severity of DR on a wide range of fundus images.
Chetoui et al. [12] introduced the use of different texture features for DR, mainly Local Ternary Pattern (LTP) and Local Energy-based Shape Histogram (LESH). They showed that they outperform LBP extracted features. Support Vector Machines (SVM) were used for the classification of the extracted histogram. A histogram binning scheme for features representation was proposed. The experimental results showed that LESH is the best performing technique with an obtained accuracy of 0.904 using SVM with a Radial Basis Function kernel (SVM-RBF). Similarly, the analysis of the ROC curve showed that LESH with SVM-RBF gives the best AUC (Area Under Curve) performance with 0.931.
Zeng et al. [13] proposed a model that accepts binocular fundus images as inputs and learns their correlation to help to make a prediction. In the case with a training set of only 28,104 images and a test set of 7,024 images, an area under the receiver operating curve of 0.951 is obtained by the proposed binocular model, which is 0.011 higher than that obtained by the existing monocular model. To further verify the effectiveness of the binocular design, a binocular model for five-class DR detection was also trained and evaluated on a 10% validation set. The result shows that it achieved a kappa score of 0.829 which is higher than that of the existing non-ensemble model.
Dutta et al. [14] proposed a method where fundus images containing diabetic retinopathy were taken into consideration. The idea behind this paper was to propose an automated knowledge model to identify the key antecedents of DR. the proposed Model was trained with three types of techniques, backpropagation NN, Deep Neural Network (DNN), and Convolutional Neural Network (CNN) after testing models with CPU trained Neural network gives the lowest accuracy because of one hidden layer whereas the deep learning models are outperforming NN. The Deep Learning models are capable of quantifying the features as blood vessels, fluid drip, exudates, hemorrhages, and microaneurysms into different classes. The model will calculate the weights which give the severity level of the patient’s eye. The foremost challenge of this study was the accurate verdict of each feature class threshold. To identify the target class thresholds weighted Fuzzy C-means algorithmwas used.
Research gap
A few problems were encountered by researchers who took to solving the retinopathy detection problem, a lot of these problems are ineviTable and don’t have a solution right now, this is because the field of deep learning is still new to a lot of people and data gathering always brings problems. Data are scarce and most of the data available are not usable due to one reason or the other. Figure 2 gives an insight into the research gaps of retinopathy using CNN to segment the lesions. Also, Table 2 compares and shows the previous approaches in the area.
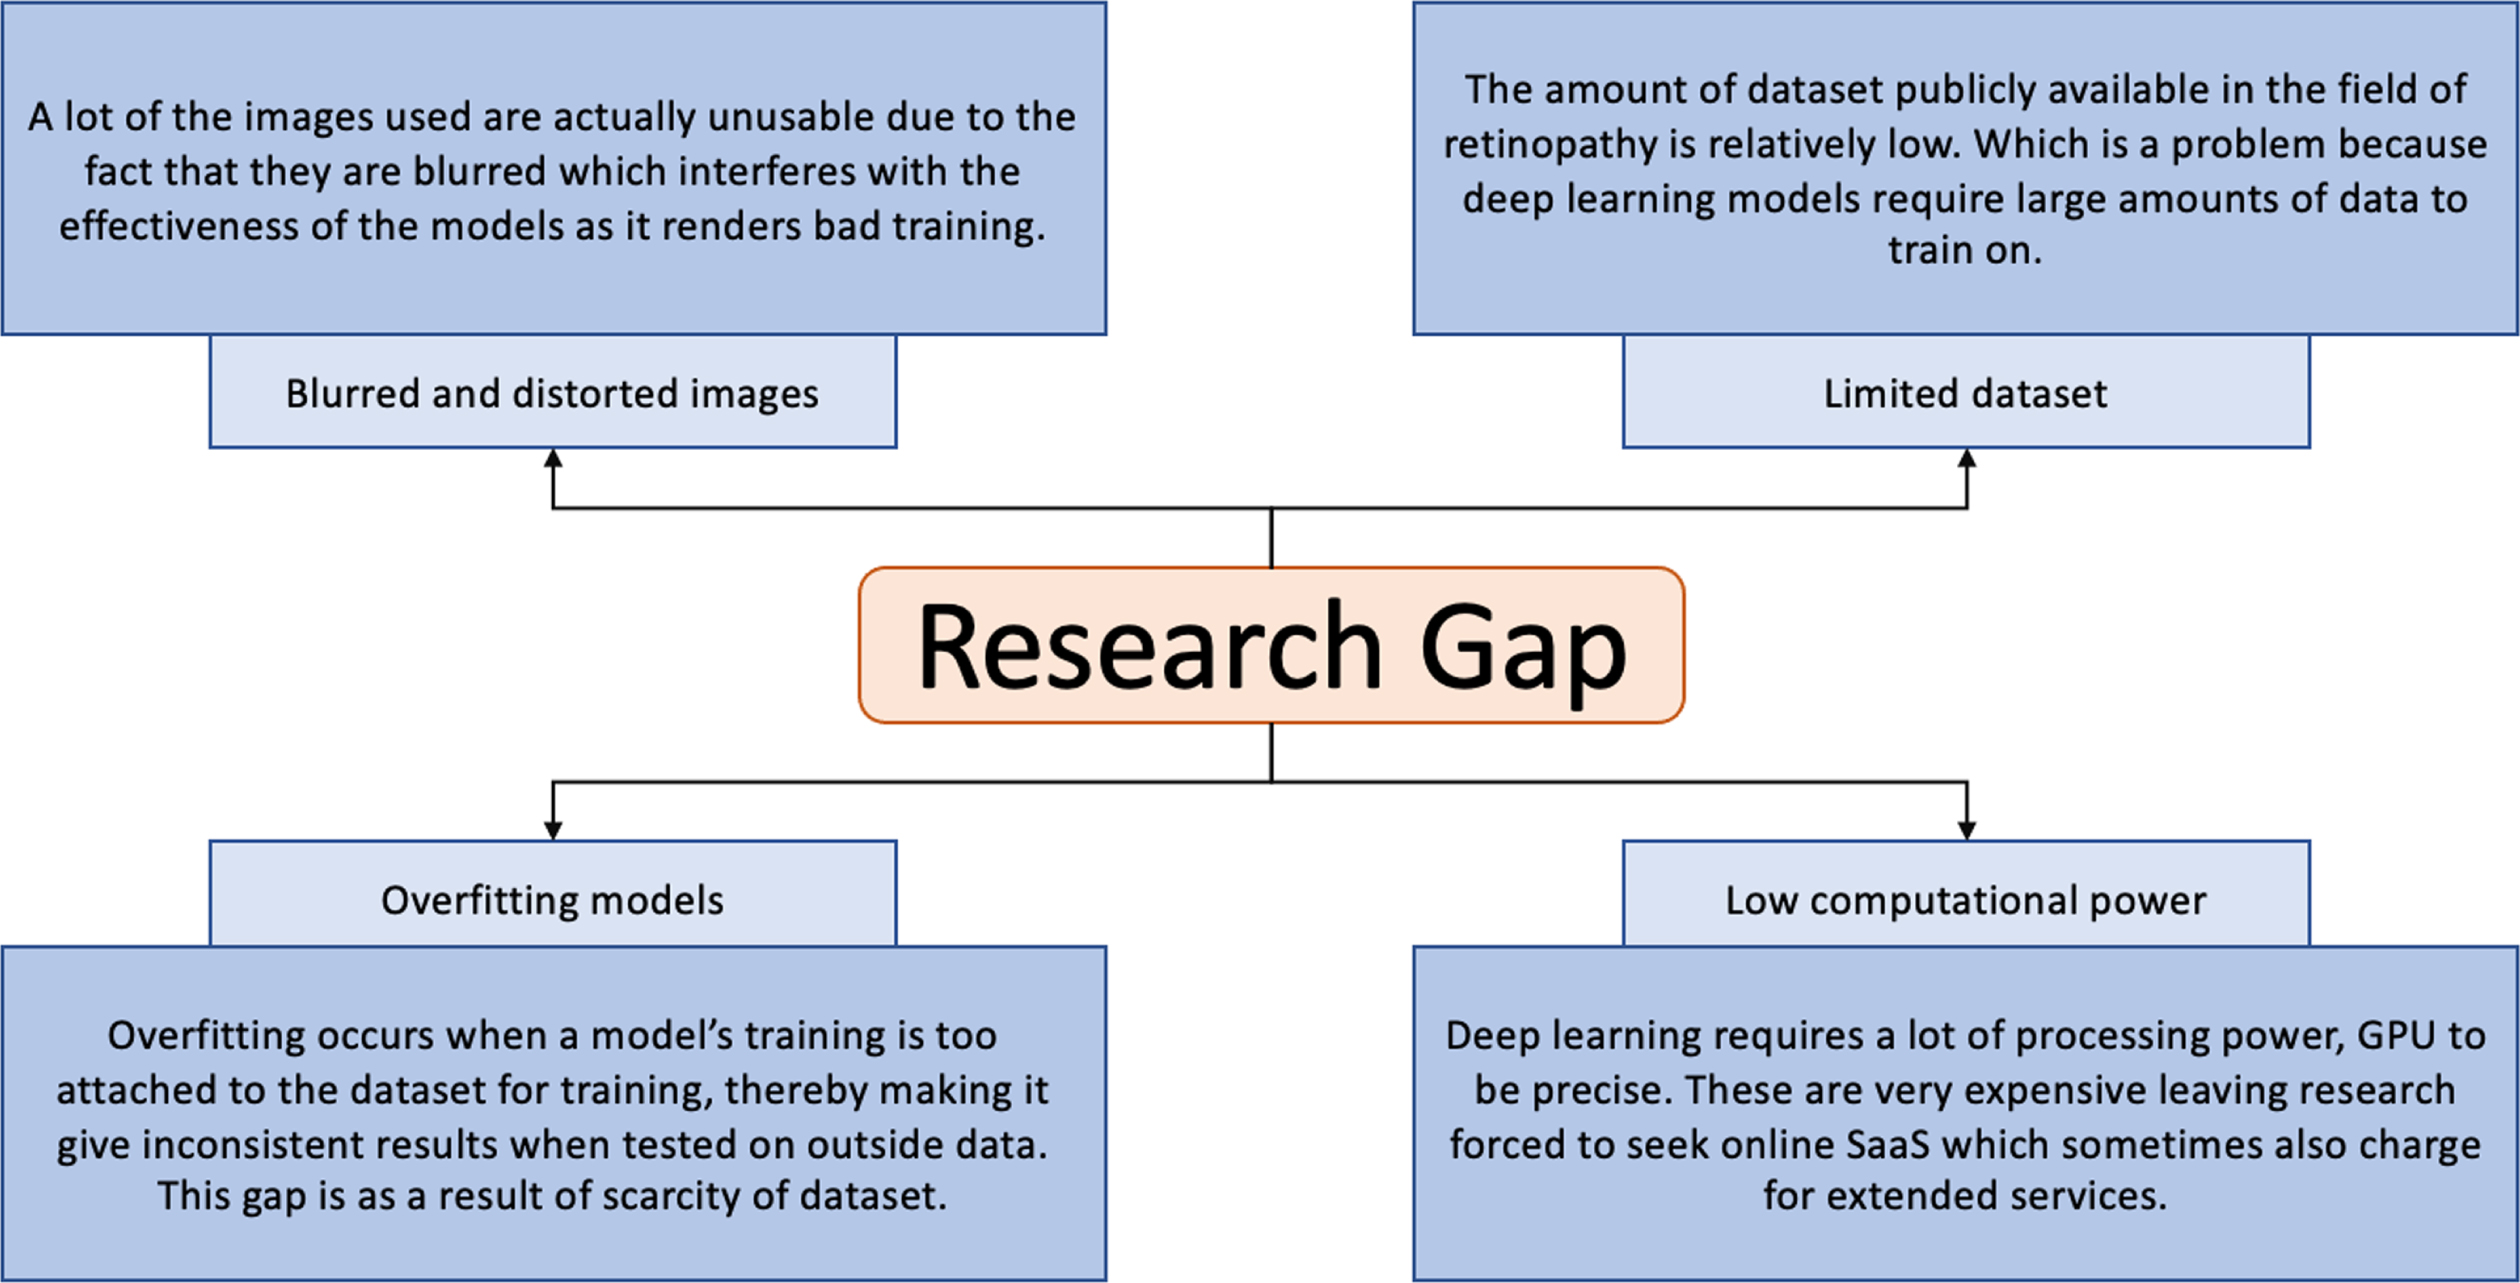
Study of the research gap of retinopathy using CNN to segment the lesions.
Summary of the previous approaches, their methodologies, gaps, and improvement of retinopathy using CNN to segment the lesions
From the previous review of the current literature utilized conventional methods and DL architectures, we can conclude their main limitations are as follows: Limited dataset Blurred and distorted images Overfitting models Low computational power
To deal with these problems, pre-processing has been applied to enhance the features in the images. This mitigates the effect of blurred or distorted images. The limited dataset has been increased using data augmentation techniques. Moreover, using pre-trained models also show high accuracy with small datasets. Furthermore, pre-trained models also train in less time thus saving time and thus computational resources. To overcome overfitting, data augmentation was applied so the model does not fit on only a few images. Overfitting was also solved by monitoring the training process and when the model starts to overfit i.e., training accuracy increases while testing accuracy decreases, training is stopped otherwise model was trained for 10 epochs.
The previous literature has dealt with the problem separately without highlighting the relation between the problem of segmenting the affected areas of the eye and the diseases to be graded. We deal with the problem as a whole and highlight the relationship between the affected areas of the eye and how are they contributing to the severity of the disease. Moreover, to increase the accuracy of the models we applied different pre-processing techniques and monitored their effect on the training of the models. Furthermore, the process of training has been made more efficient in terms of training time and training cost by using the pre-trained models. Pre-trained models on ImageNet have been used after turning them by adding an ANN classifier designed by us so that it can be trained on only a few classes. For classification, we showed that the three new pre-processed datasets showed higher performance than the original dataset given in the IDRID database.
Retinopathy is one of the diseases which has a scarcity of specialists, there is a need now more than ever for a system that could automatically detect and identify patients who suffer from it. Furthermore, the literature presented lacks to address the relation between the task of grading the disease and the segmentation of the factors that are causing the disease. The more area covered in segmentation, the severe is the effect of the disease. Our work began at the data acquisition stage where we got our images from the Indian Diabetic Retinopathy Image Dataset (IDRID) [1]. The data preprocessing stage came second, preprocessing was very crucial because even though the dataset was standard, we needed to tailor it to fit the problem we were trying to solve. Then finally, the data is entered into the classification models where it is trained to automatically detect retinopathy. Figure 3 shows the pipeline of how the experiment of CNN be used to segment the lesions.
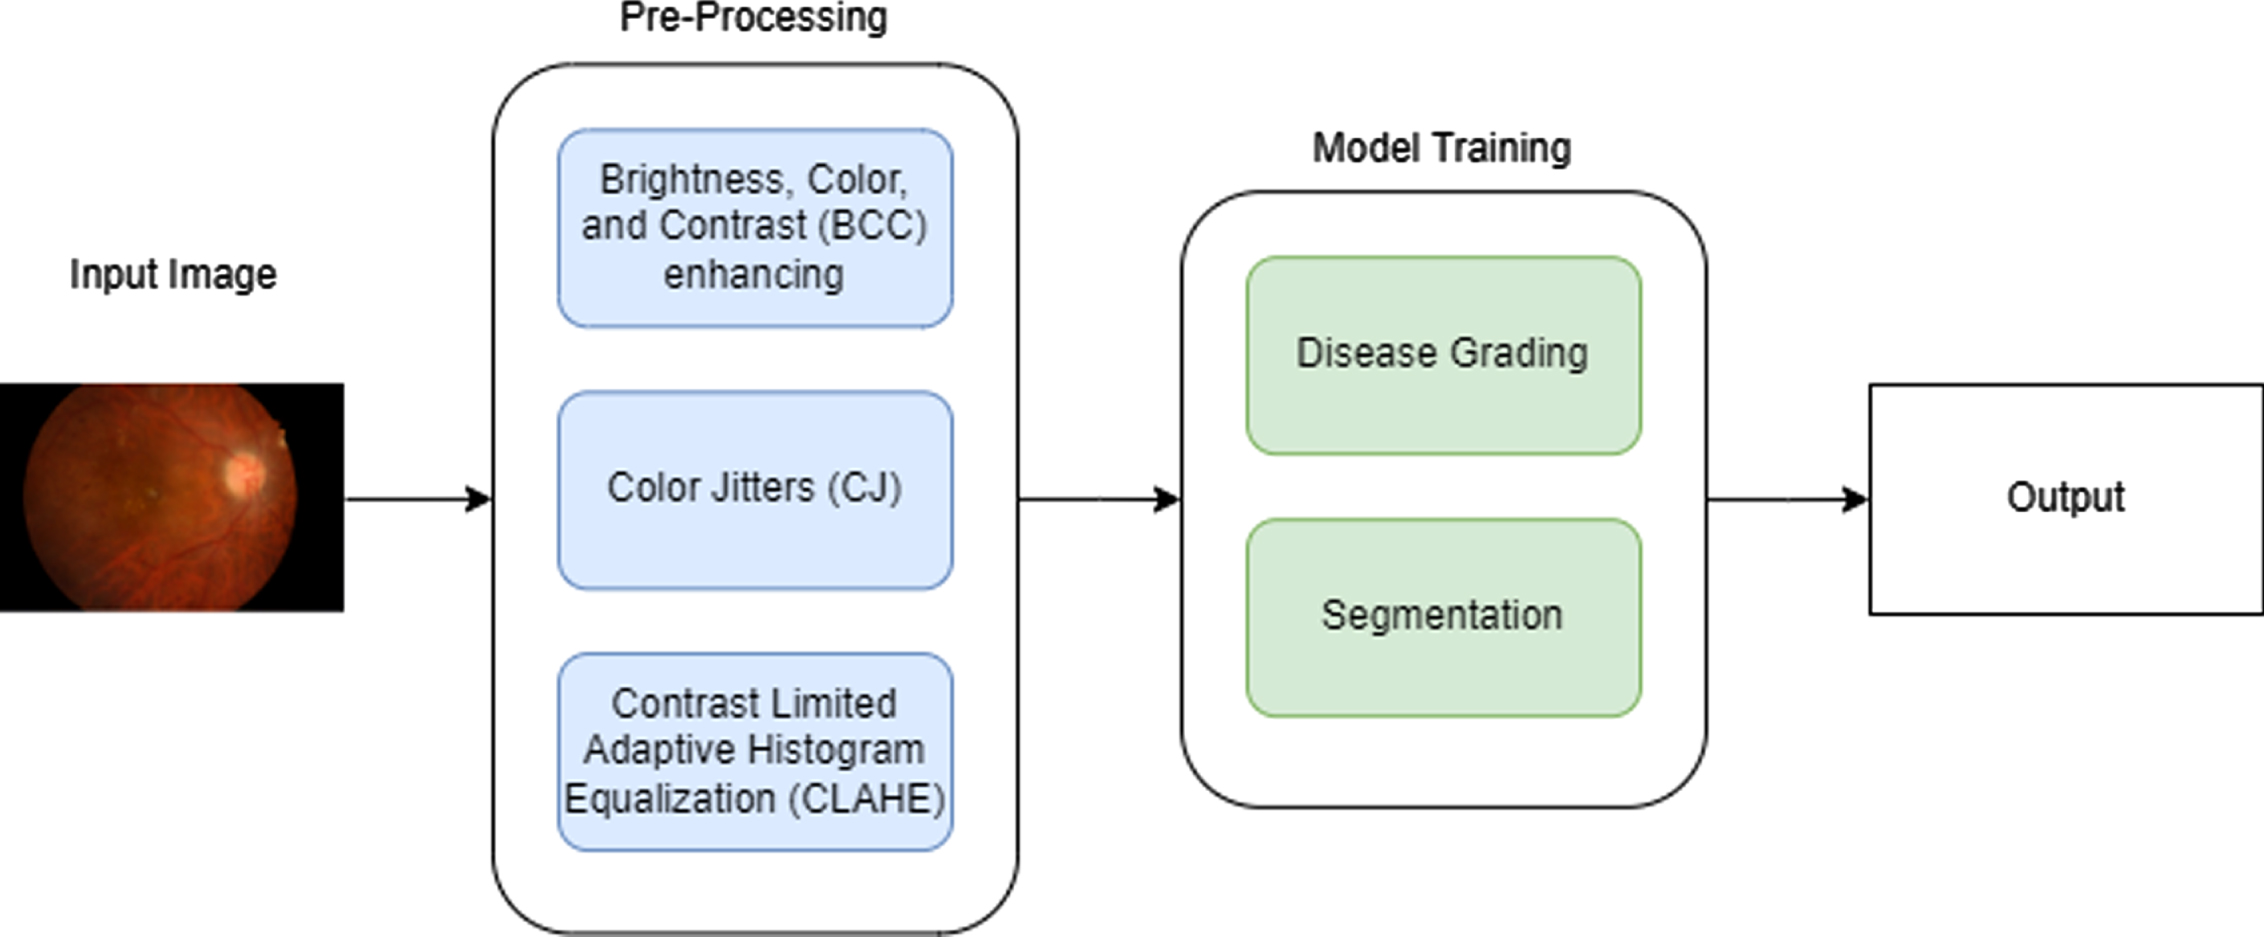
Pipeline for the CNN task to segment the lesions.
Dataset
Indian Diabetic Retinopathy Image Dataset (IDRiD) [1] consists of three different tasks: Segmentation: This includes segmentation of four causes of retinopathy that includes, Microaneurysms (MA), Haemorrhages (HE), Hard Exudates (EX), and Soft Exudates (SE). It also includes images for the segmentation of the optic disc (OD). Disease Grading: This includes detection that how much the eye is affected by retinopathy and how much are the chances of macular edema due to retinopathy. Localization: This includes localization of optic disc and Fovea center
In this study, only segmentation and disease grading are targeted because they are linked with each other. Lesions given in the segmentation task are the cause of retinopathy and it also determines that what are the chances of macular edema. In the segmentation task, there is a total of 81 images that are then divided into training (54 images) and test set (27 images). Masks for all 81 images are given and for each lesion, a different mask is given. Although some images do not have a specific lesion or that image the mask of that specific lesion is not given. In the disease grading task, there is a total of 516 images that are further divided into training (413 images) and testing set (103 images). For retinopathy, 5 grades are ranging from 0 to 4, and for macular edema 3 grades are ranging from 0 to 3.
Pre-processing
Before performing any task, images were pre-processed and three more datasets were generated. The first dataset was generated by enhancing the brightness, color and, contrast (BCC) of the original images. The second dataset was obtained by applying color jitters (CJ) to the original image. In color jitters brightness, contrast and, saturation of images are changed randomly. The third dataset was obtained by applying Contrast Limited Adaptive Histogram Equalization (CLAHE) on original images. For training the model each dataset was divided into a ratio of 70% for training, 20% for testing, and 10% for validation to grade diseases. For segmentation, 70% and 30% ratio was taken for training and testing respectively.
Disease grading classification
At first, the disease grading is targeted using different classification models. Classification models used in this study are ResNet50, VGG-16, and VGG19. Three datasets generated during pre-processing along with original images were used to train the classification models. Data augmentation was also applied before training and testing. Horizontal flip, vertical flip, and rotation range of 90° were applied for augmentation. These models were pre-trained on the ImageNet dataset having 1000 classes and were finetuned by adding more layers for our disease grading task. The advantage of using a pre-trained model is to mitigate the effect of fewer datasets. Table 3 shows the additional fine-tuning layers added to the original architecture of the models. New ANN layers are shown and the output layer consists of 4 and 3 neurons for grading retinopathy and macular edema respectively.
Fine-tuning layers for X-ray and CT-Scan classifier
Fine-tuning layers for X-ray and CT-Scan classifier
ResNet-50 is a model given by Microsoft [15] and has the quality feed output of some layer directly to the input of some other layer by bypassing layers in between. This property of ResNet-50 is called identity mapping. This helps with solving the problem of vanishing gradient. Figure 4 shows the architecture of ResNet50. VGG-16 and VGG-19 are the models given by “Visual Graphic Group” at Oxford University [16]. VGG-16 and VGG-19 contain 16 and 19 layers respectively arranged in a pyramid shape. Figure 5 shows the pyramid architecture of VGG-16 and Fig. 6 shows the architecture for VGG-19 [17].
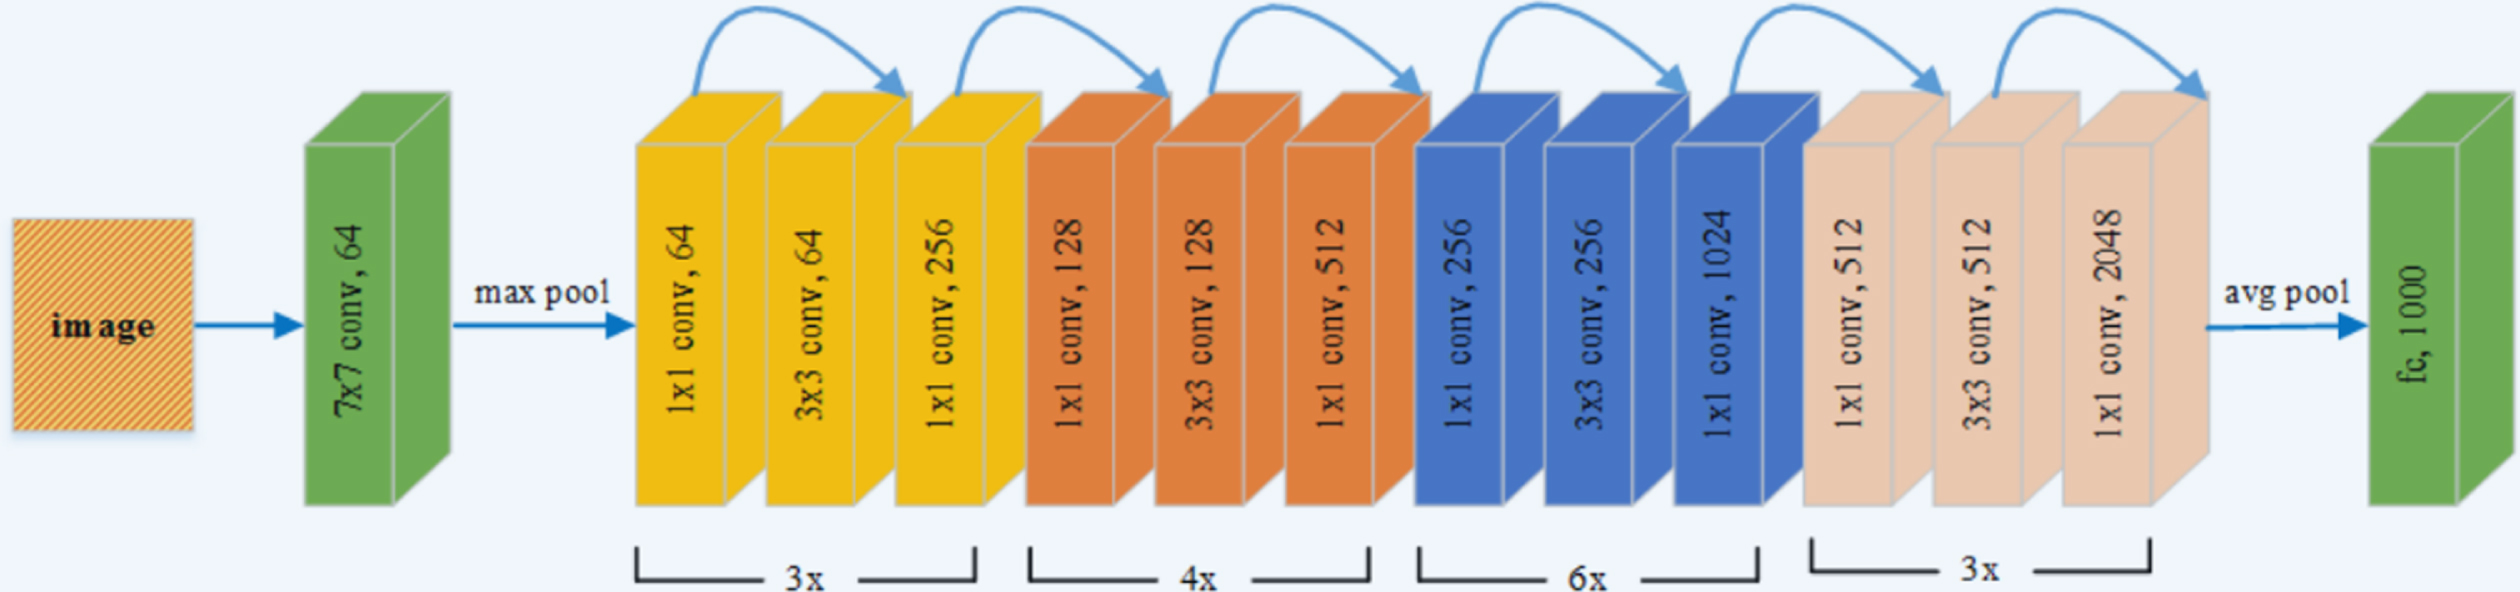
Architecture of ResNet50.
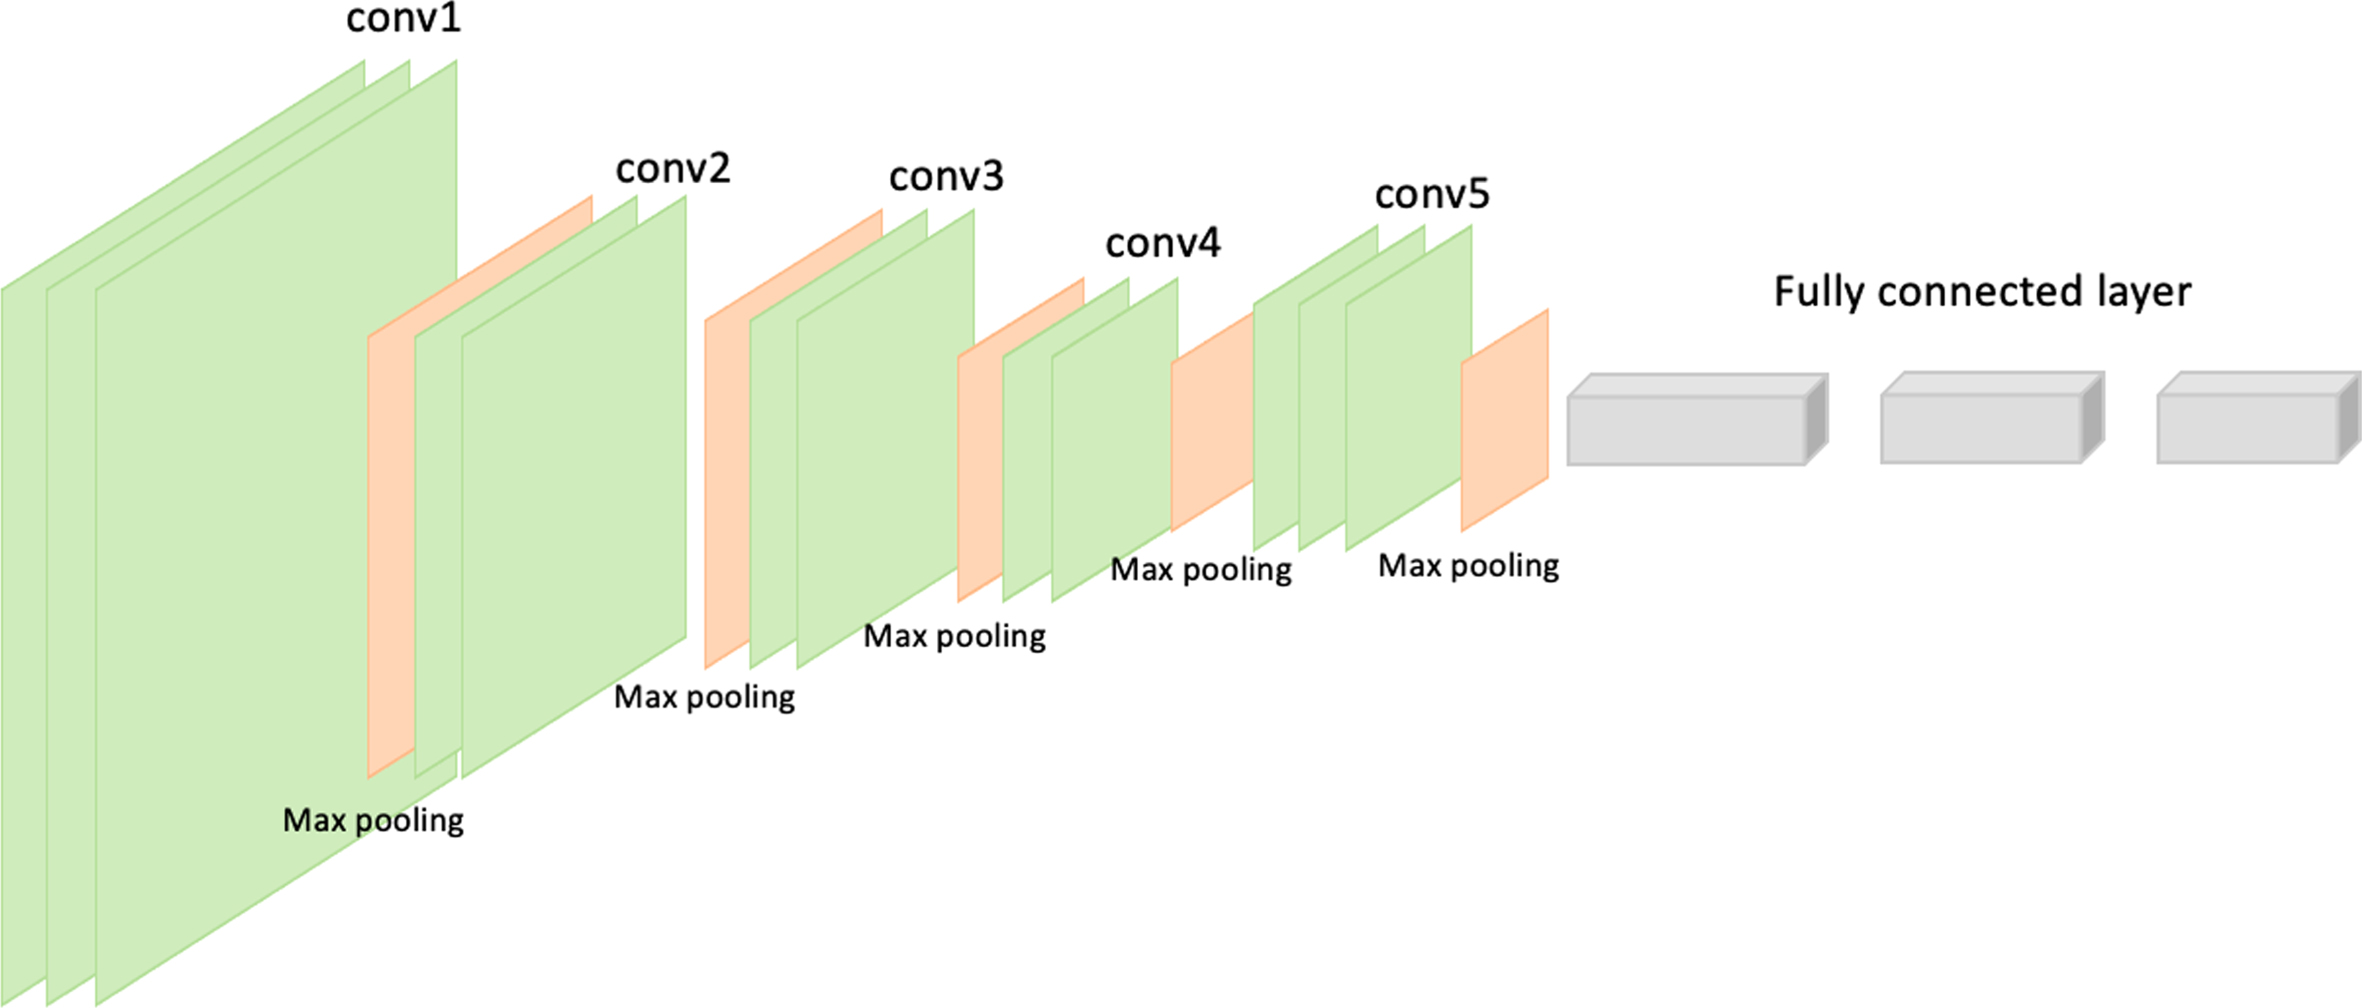
Architecture of VGG-16.
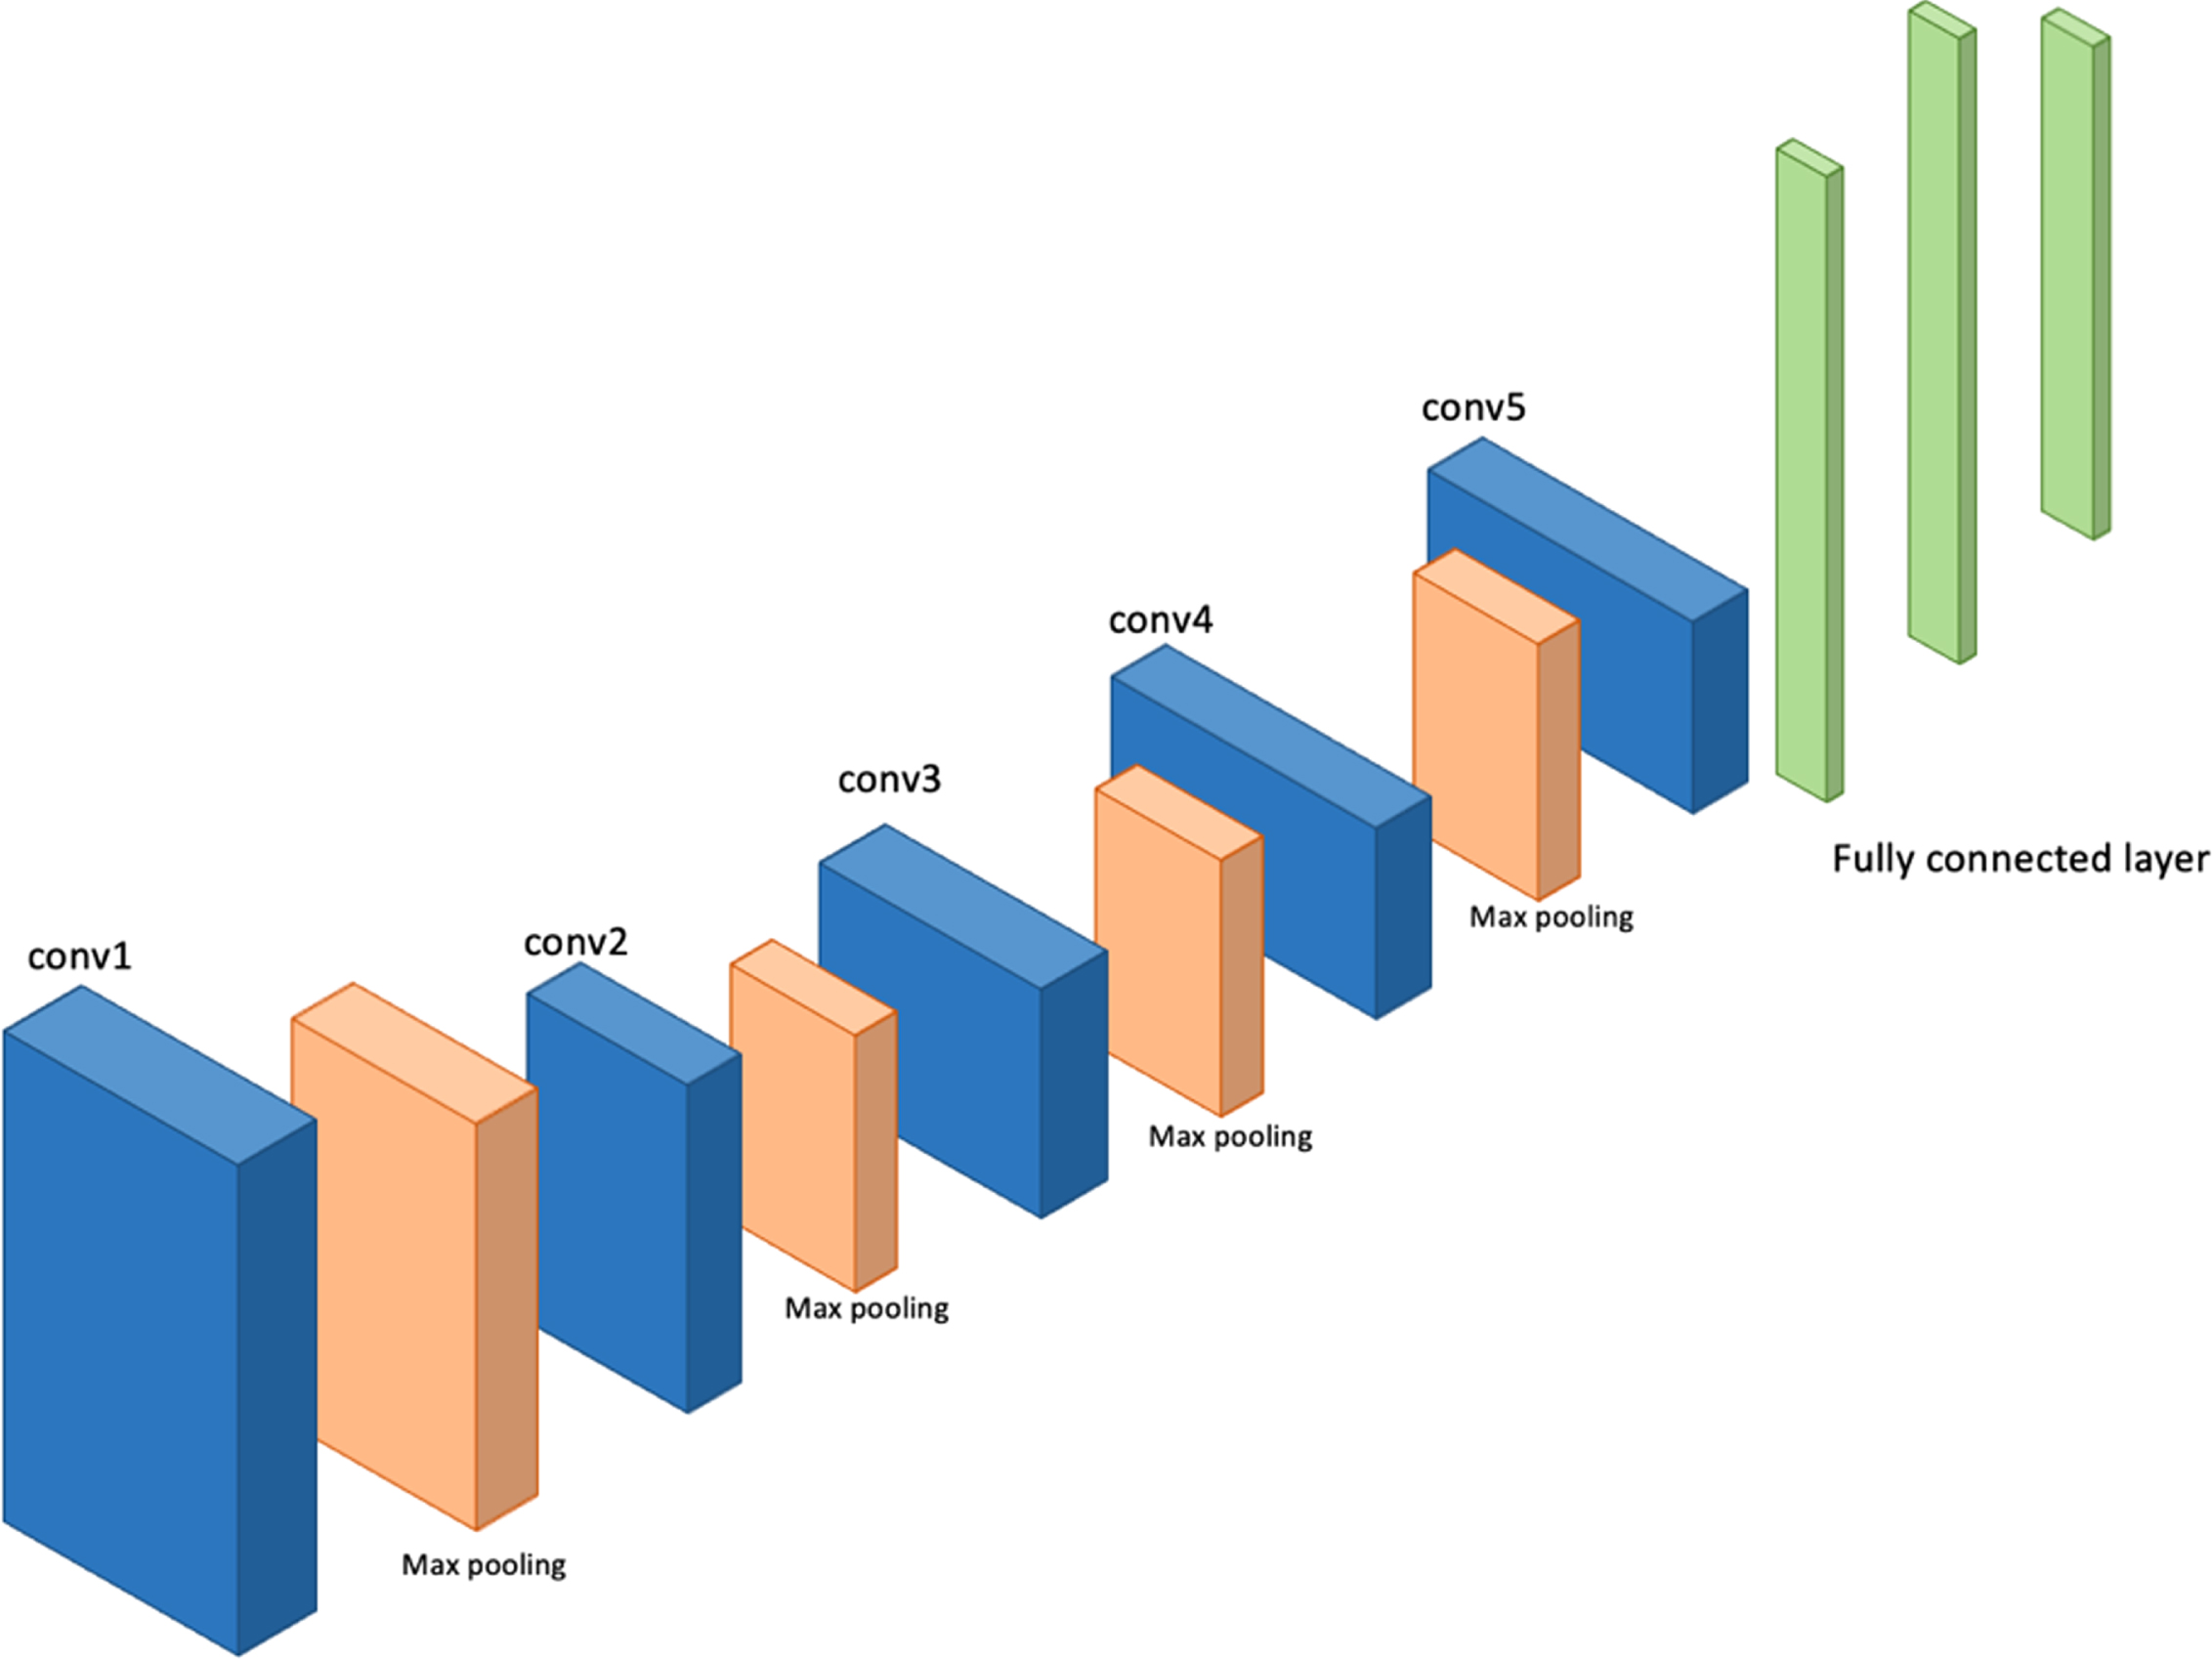
Architecture of VGG-19.
All the models used in this task were pre-trained on the ImageNet dataset. The CNN architecture remained the same but ANN architecture was changed according to Table 3. The training and testing dataset was used in the training process. Using the testing dataset in the training process was to check the step where the model started to overfit so that the training can be stopped. The loss was calculated through categorical cross-entropy. Adam optimizer was used and the batch size was set to 8 in the training. Weights are stored after each epoch and saved. After the training of the dataset, the validation dataset was used to evaluate the trained model. These models are trained to classify the severity of retinopathy and macular edema [18]. For retinopathy and macular edema tuning layers added can be seen in Table 3.
After finding the severity of the disease, different causes of retinopathy were segmented. For this segmentation task, a UNet model was used, which has been successfully applied to many medical image segmentation tasks [19, 20]. UNet consists of two parts, contraction and expansion. The contraction part extracts features from the image using Downsampling and max-pooling layers. While the expansion part localizes the segmentation area. Table 4 shows the UNet architecture used. While training the UNet model training and the testing dataset was used in the training process. No validation data was involved at this stage because the data for segmentation was less. Binary cross-entropy loss function was used along with Adam optimizer.
Architecture of UNet
Architecture of UNet
At first, images were pre-processed using different techniques. Figure 7 shows the results of random images after applying different pre-processing techniques to the original image. After generating the new datasets through pre-processing, classification models were trained on those datasets separately. Table 5 shows the training, testing, and validation accuracy along with losses for finding the severity of retinopathy. In the case of finding the severity of retinopathy VGG-16 gave the best testing accuracy for the dataset obtained by adjusting brightness, color, and contrast. While for validation accuracy, ResNet-50 gave the best accuracy for the dataset enhanced by using CLAHE.
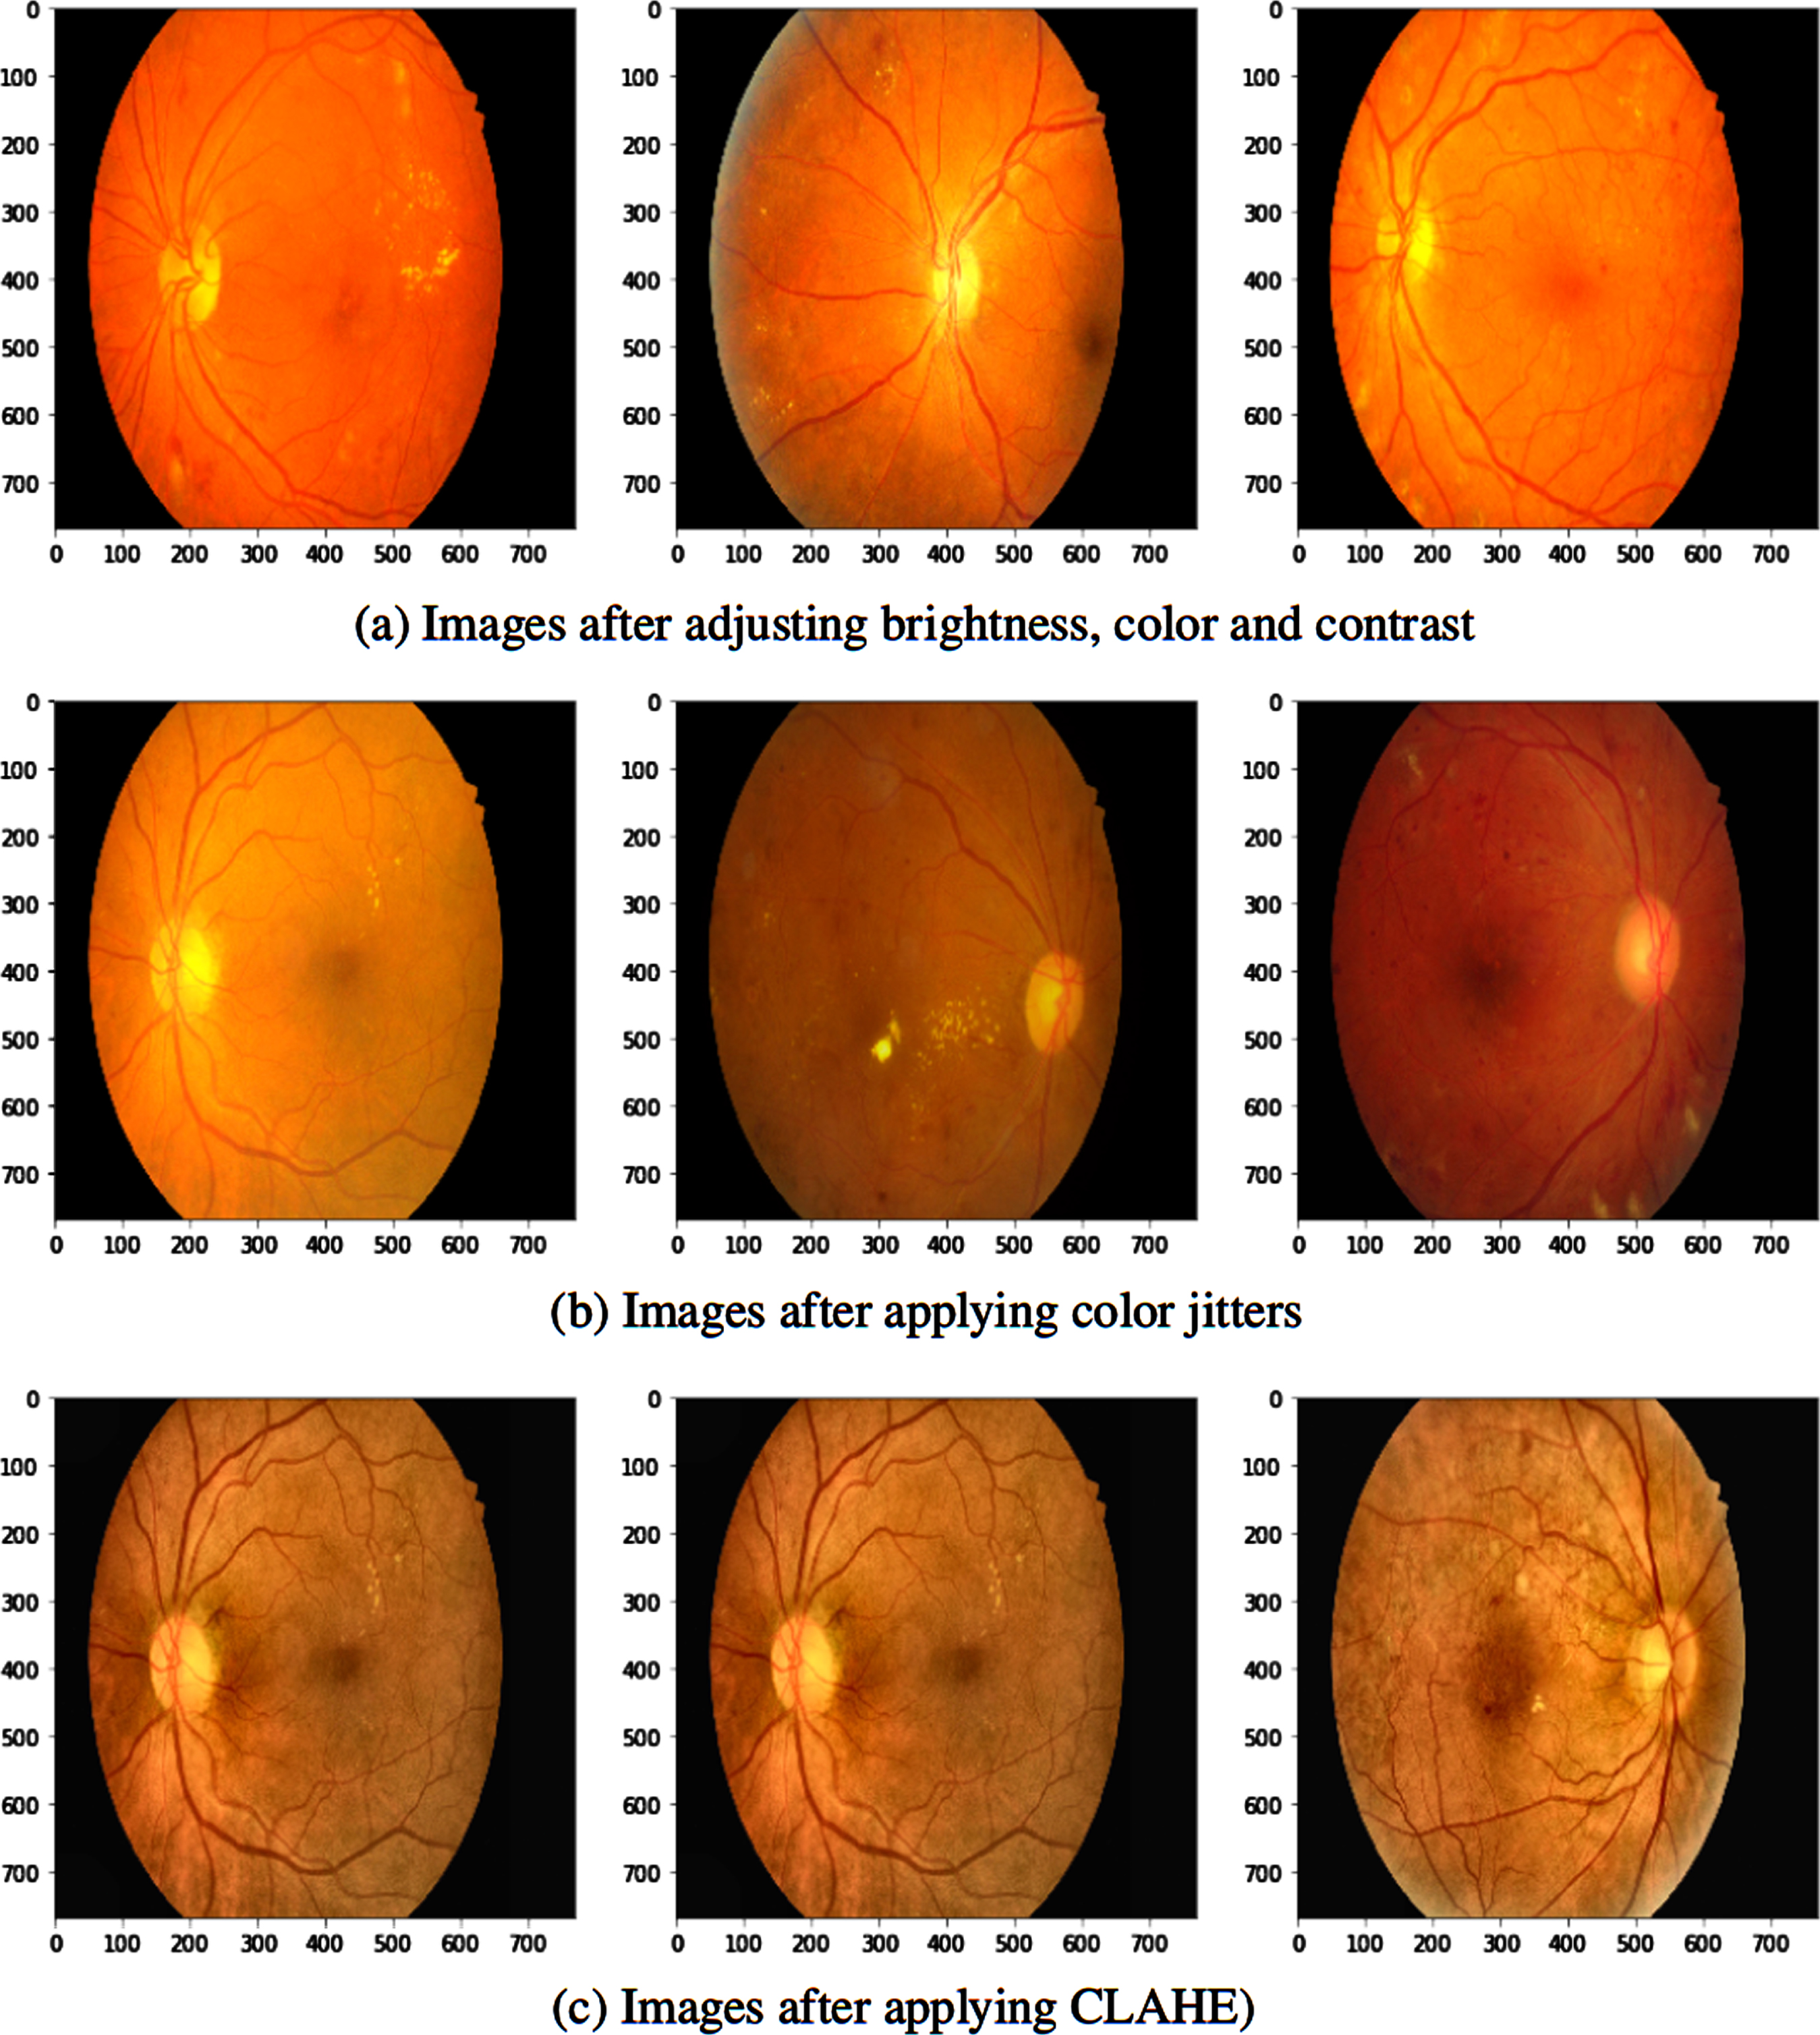
Effect of different pre-processing techniques.
Training, validation, and test accuracy achieved by different models for finding severity of retinopathy
In case of finding the chances of having macular edema, Tables 5 and 6 shows that ResNet-50 and VGG-19 gave the best testing accuracy for original images and for datasets obtained by enhancing brightness, color, and contrast respectively. Best validation accuracy was obtained via ResNet-50 on the original images dataset. Results for finding the chances of having macular edema can be seen in Table 7.
Training, validation, and test accuracy achieved by different models for finding the chances of macular edema
Related works of having macular edema
After the severity is found, segmentation of different retinopathic lesions was done using UNet. UNet was trained for all four types of datasets and each kind of lesion segmentation. Table 8 shows the accuracies and losses obtained for each dataset and each kind of lesion. Best accuracy results are written in bold.
Training, and Test accuracy and loss achieved by different UNet for different datasets for different lesions and optical disc segmentation
Feature detection and recognition is the main part that helps in the training of a model [21]. If the correct features are detected the model performance is high. Pre-processing was applied in an effort to enhance the features so that they can be recognized by the model easily [22]. This can be seen in all the results shown in Table 5, and 8 where models have shown high accuracies except for the severity detection of macular edema. In the case of severity detection of macular edema original dataset surpassed the accuracy of pre-processed data by a factor of almost 5%. It can be deducted that are features that are more common with macular edema are not enhanced by any pre-processing method rather these features might get suppressed. This is why using original images for macular edema severity detection is a better option.
Deteting diabetic retinopathy using deep learning models have been attracting broad research intrest [23]. We conducted a new study and demonstrated several new interesting results or observations. For example, as it can be observed from the previous section that the accuracy has been increased by applying the pre-processing techniques suggested in this paper in many cases. These techniques enhanced the features in the images and thus improved the accuracy. With fine-tuning of pre-trained models, we got these high accuracies with just training for a maximum of 10 epochs, thus saving time and resources along with compensating for the fewer data. This approach also helped in training on fewer data along with data augmentation. If the model started to overfit in the middle of training, it was stopped immediately. We successfully classified the severity of the eye diseases and segmented the disease-causing faults with high accuracy. This study provided a way to train the models for complex applications in a cost-efficient way by fine-tuning the pre-trained models. Furthermore, we highlighted the relationship between the different faults in the eye i.e., hemorrhage, and severity of the diseases.
A lot of work has been done towards using artificial intelligence to detect retinopathy and in this section, we present an analysis of recent works that have been done towards this. Table 7 shows a summary of the results obtained from the works done by Rakhlin et al. [4], Nguyen et al. [5], and Gangwar et al. [8] which are all models developed to detect diabetic retinopathy from images. The models do well but not very well, this is mainly due to not properly fine-tuning the parameters and hyper-parameters of the models. Our model achieves an accuracy of 83% which is fairly high even though it will be improved as more and more dataset is collected. This accuracy was achieved by only training for 10 epochs and with a limited dataset for a very large NN model.
Retinopathy is the main cause of eye defects in diabetic patients. To find the severity of retinopathy and the chances of the eye being damaged due to macular edema are important. Not only that finding which area of the eye is affected by what kind of lesion can help us know the main cause of retinopathy. This paper trained different pre-trained models to find the severity of retinopathy and chances of macular edema. Once the severity is found, UNet was used to segment out the areas affected by different kinds of lesions. We found that ResNet-50 is the best model for finding the severity of retinopathy as it gave the maximum accuracy for images enhanced by adjusting brightness, color, and contrast.
For finding the chances of the eye being affected by macular edema ResNet-50 again showed maximum testing and validation accuracy but this time for original images. In the case of segmentation, the accuracies were not very far away from each other. For EX and MA, the BCC dataset showed the maximum testing accuracy. For OD, the CJ dataset showed maximum testing accuracy. In the end, the dataset enhanced through CLAHE showed the maximum testing accuracy for HE and SE.
In the future, other pre-trained models can be tested to find if other models can enhance the results further. Moreover finetuning of layers can be further enhanced for classification purposes. Also instead of using an Artificial Neural Network for classification, other models like support vector machines (SVM), random forest (RF), and decision tree (DT) can be used. In terms of segmentation, many other models can be tested i.e., UNet++. Furthermore, segmentation can be used first to segment the images of the severity dataset, and then the classification model can be applied.
Footnotes
Acknowledgments
We would like to thank the Deanship of Scientific Research, Qassim University for covering the publication of this project.
Conflicts of interest
The authors declare that they have no conflicts of interest to report regarding the present study.