
Abstract
BACKGROUND:
Malignant Primary Brain Tumor (MPBT) and Metastatic Brain Tumor (MBT) are the most common types of brain tumors, which require different management approaches. Magnetic Resonance Imaging (MRI) is the most frequently used modality for assessing the presence of these tumors. The utilization of Deep Learning (DL) is expected to assist clinicians in classifying MPBT and MBT more effectively.
OBJECTIVE:
This study aims to examine the influence of MRI sequences on the classification performance of DL techniques for distinguishing between MPBT and MBT and analyze the results from a medical perspective.
METHODS:
Total 1,360 images performed from 4 different MRI sequences were collected and preprocessed. VGG19 and ResNet101 models were trained and evaluated using consistent parameters. The performance of the models was assessed using accuracy, sensitivity, and other precision metrics based on a confusion matrix analysis.
RESULTS:
The ResNet101 model achieves the highest accuracy of 83% for MPBT classification, correctly identifying 90 out of 102 images. The VGG19 model achieves an accuracy of 81% for MBT classification, accurately classifying 86 out of 102 images. T2 sequence shows the highest sensitivity for MPBT, while T1C and T1 sequences exhibit the highest sensitivity for MBT.
CONCLUSIONS:
DL models, particularly ResNet101 and VGG19, demonstrate promising performance in classifying MPBT and MBT based on MRI images. The choice of MRI sequence can impact the sensitivity of tumor detection. These findings contribute to the advancement of DL-based brain tumor classification and its potential in improving patient outcomes and healthcare efficiency.
Keywords
Introduction
Brain tumors, also known as intracranial tumors, are considered mass abnormalities in the cranium tissues once occurs in individuals between the ages of 55 and 64 [1]. Brain tumors occur 1.58 times more often in males than females [2]. Additionally, these tumors dominate Central Nervous System (CNS) with 85–90% [3].
Based on their origin, brain tumors are divided into primary tumors and secondary or metastatic tumors. Primary brain tumors are tumors whose growth originates from brain cells, meninges, nerves, and glands [4]. Gliomas, one type of malignant primary brain tumor (MPBT), are the most frequent cases with an incidence of around 51% compared to other types of primary brain tumors [5]. Meanwhile, secondary brain tumors, also known as metastatic brain tumors (MBT), originate from malignant tumors in other tissues that spread through blood vessels and enter the CNS [4, 6]. The number of MBT cases is four times higher than MPBT. These tumors most commonly originate from primary tumors in the lung (50%), breast tumors (15–25%), melanoma (5–20%), kidney, and colorectal tumors [3].
Magnetic Resonance Imaging (MRI) is used to detect the presence of brain tumors. MRI is a radiology modality that plays a crucial role in providing imaging to help diagnose brain tumors [7]. MRI can provide clear imaging between soft tissue and hard tissue in the brain [8]. Although various advanced imaging techniques have been developed in recent decades, conventional MRI remains the most used imaging method [9]. MRI of MPBT and MBT are similar but they have different characteristics when properly observed. MPBT has an irregular shape and edges with heterogeneous enhancement patterns, while MBT has a round shape, regular edges, and a homogeneous enhancement pattern. According to Jung et al. (2021) and Rasuli & Gaillard (2016), the number, location, and morphology of tumors are other differences in the characteristics of MPBT and MBT [10, 11].
Deep Learning (DL) is a branch of Artificial Intelligence (AI) that can mimic the diagnostic capabilities of doctors. This ability can be used to improve the quality and speed up healthcare services [12]. DL has tremendous potential in the development of radiology because almost all primary data and output are digital files. Moreover, it can be used in various aspects such as classification, segmentation, detection, and others [13].
Accurately differentiating between MPBT and MBT using DL is crucial for improving patient outcomes and optimizing healthcare services [14]. Misdiagnosis can lead to delays in treatment, worsening of the patient’s condition, and even death [15]. Moreover, the management and therapy approach for MPBT and MBT are very different, and accurate classification can help healthcare providers tailor treatment plans to each patient’s specific needs [16]. DL’s ability to classify brain tumors using various MRI sequences quickly and accurately can save valuable time in the diagnostic process, leading to earlier treatment and better outcomes for patients [17, 18]. Additionally, DL can reduce the workload of healthcare providers and improve the overall efficiency of the healthcare system [19, 20].
Two studies were conducted to classify brain tumor MRI images using various Convolutional Neural Network (CNN) architectures. The first study by Qodri in 2021 used six architectures, including ResNet50 and VGG19, and found that ResNet50 and VGG19 achieved the highest accuracy of 99% and 97%, respectively [21]. However, ResNet101 was not included in this study, even though a previous study by Setiawan in 2019 showed that ResNet101 had slightly higher accuracy in classifying fundus images [22]. The second study by Cinar in 2022 classified 3,000 brain MRI images using six architectures, including ResNet101 and VGG19, and found that ResNet101 and VGG19 had the highest accuracy of 98.6% and 97.2%, respectively, while other architectures achieved significant accuracy, ranging from 89.5% to 94.3% [23]. Thus, both ResNet101 and VGG19 were used in this study to compare their performance in classifying MPBT and MBT MRI images in more detail.
Several parameters influence the accuracy of brain MRI classification, including the number of epoch scenarios. Chelghoum (2020) conducted a study using CNN to classify 3,064 brain MRI images of glioma, meningioma, and pituitary tumor. Three epoch scenarios were tested: 25, 50, and 90. The accuracy improved in the epoch 50 scenario compared to epoch 25, as seen in VGG19 (97.97% to 98.55%) and ResNet101 (96.67% to 96.83%). However, accuracy decreased in the epoch 90 scenario (VGG19:98.47%, ResNet101:95.99%). The optimal epoch scenario was found to be 50, but the exact epoch at which overfitting occurs is still unknown [22, 24]. Therefore, this study utilizes epoch 60 to examine the performance and assess potential improvements. Additionally, the epoch 90 scenario, known for overfitting, and the epoch 30 scenario will be compared proportionally to determine the significance of the accuracy improvement at epoch 60.
One of the advantages of MRI compared to other imaging modalities is the presence of sequences. An MRI sequence consists of a series of radiofrequency pulses and gradients that produce a set of images with a specific appearance. Each sequence generates images with different characteristics [25]. The sequences commonly used in brain tumor examinations include T1-weighted images (T1), T2-weighted images (T2), T1+ contrast (T1C), and Fluid-Attenuated Inversion Recovery (FLAIR) [26]. However, previous studies have been limited to using only one or two types of sequences, and some studies did not specify the sequence used for their datasets [23, 27]. The research by Chelghoum (2020) and Fayaz (2021) only used T1-contrast (T1C) and T2 sequences, respectively [24, 27]. Meanwhile, Cinar (2022) failed to mention a particular sequence for the analysis [23]. In, other hand, Additionally, there is a lack of research discussing the classification results of deep learning on MPBT and MBT from a medical perspective. Therefore, the objective of this study is to examine the impact of MRI sequences, including T1, T2, T1C, and FLAIR, on the performance of VGG19 and ResNet101 in classifying MPBT and MBT, as well as to analyze them from a medical perspective.
Method
Dataset
In this research, a total of 49 MPBT and 66 MBT patients from the Radiology Installation of Dr. Moewardi Surakarta Hospital between January 2020 to February 2022 were selected as participants. Data was collected as a 3D image in Digital Imaging and Communication in Medicine (DICOM) format using a machine called GE Signa HDxt 1.5T MRI Scanner. The first step in data collection is the selection of a layer of sequences that contain tumor images through RadiAnt DICOM Viewer Version 2021.2.2 software. In this research, the sequences used were T1, T2, T1C, and FLAIR. The dataset used in this study is available at this link https://bit.ly/braintumorsdataset Figure 1 shows examples of tumor images in each sequence.

MRI images corresponding to sequences in (a) MPBT and (b) MBT.
Each data is labeled with its tumor type, number, and sequence. The tumor type consists of “MPBT” or “MBT”, while the sequence comprises “T1”, “T2”, “T1C”, and “FLAIR”. Furthermore, the data was saved in JPG format and a total of 1360 images were collected. The dataset was divided with a configuration of 70% training, 15% validation, and 15% testing with 952, 204, and 204 images, respectively. Table 1 shows a more complete dataset division.
Number of images in the datasets
Data preprocessing is required to prepare the dataset for deep learning training. First, the selected data are brain images that are not cropped using data cleansing and data wrangling. Then, the image size is standardized to a 2D image with a size of 224×224 grayscale. Furthermore, the pixel values of the images are normalized to a range of 0 to 1.
Data augmentation
Deep learning requires a large amount of data to obtain reliable results. However, there may not be enough data, especially on medical problems. The problem is obtaining and annotating data, which is very expensive and time-consuming. One solution to overcome this is data augmentation, which prevents overfitting and improves accuracy [28, 29]. In this research, several augmentation methods were used, such as rotation, zoom, shift, shear, and horizontal flip.
CNN Architectures
In this study, we used a modified VGG19 and ResNet101 for our classification task. VGG19 is a well-known CNN architecture that consists of 19 convolutional layers and 3 fully connected layers. Our modified VGG19 has an additional convolutional layer to extract more features from the input data. We also added batch normalization and dropout layers to prevent overfitting. The final layer of the network is a fully connected layer with a softmax activation function for classification. Table 2 shows the architecture of our modified VGG19.
VGG19 architecture
VGG19 architecture
On the other hand, ResNet101 is a deep CNN architecture that consists of 101 layers and has achieved state-of-the-art performance on many image recognition benchmarks. Our modified ResNet101 has several adjustments to the original architecture. Firstly, two more convolutional layers were added to capture finer details of the input images. Secondly, batch normalization layers were replaced with group normalization layers to reduce memory usage and improve generalization. Lastly, a global average pooling layer and a fully connected layer with softmax activation function were included for classification. Table 3 shows the architecture of our modified ResNet101.
ResNet101 architecture
Confusion matrix is a technique used to measure the performance and summarize the results of deep learning classification models. The calculation of the confusion matrix provides a good representation of the classification model’s accuracy and the types of errors it makes. It includes a combination of the differences between predicted and actual images.
The confusion matrix consists of four possible outcomes: true positive (TP), true negative (TN), false positive (FP), and false negative (FN). When an image is actually positive and classified as positive, it is labeled as TP. If it is classified as negative, it is labeled as TN. Similarly, for negative images, if they are classified as negative, they are labeled as TN, and if they are classified as positive, they are labeled as FP. Figure 2 illustrates the confusion matrix.
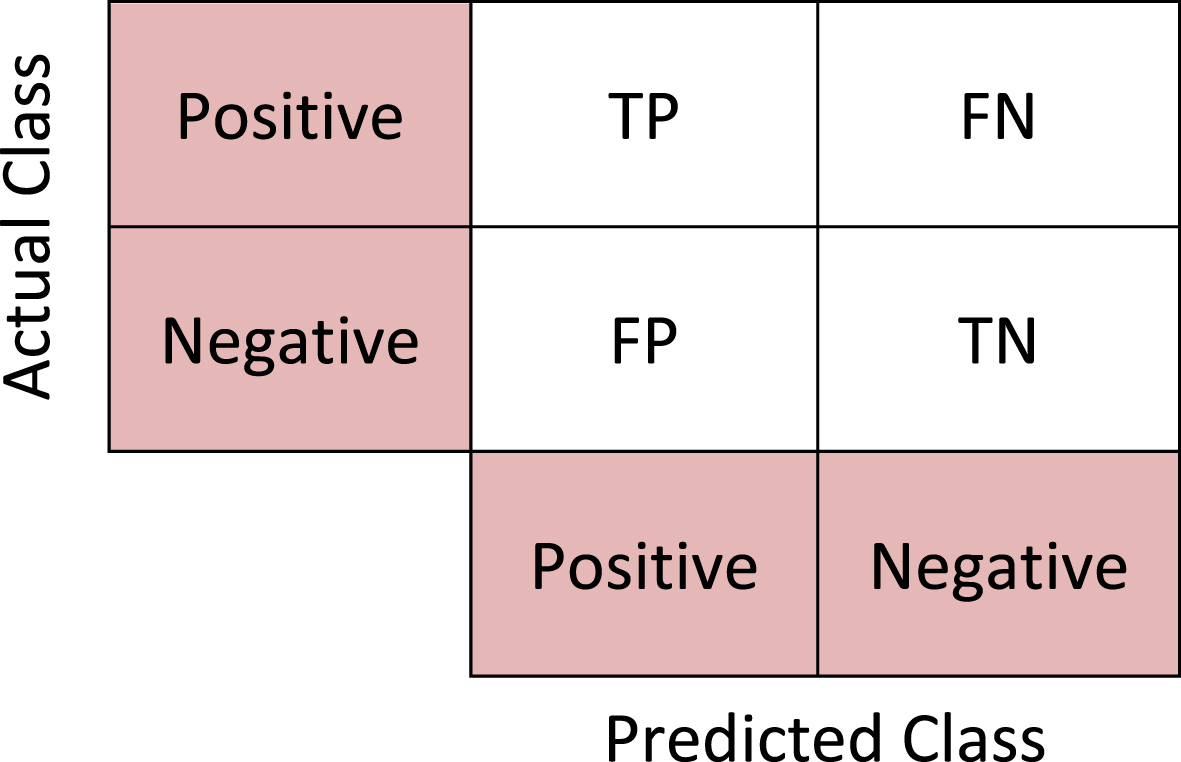
Confusion matrix.
To evaluate the performance of the model, several key parameters are used: accuracy, sensitivity (recall), and precision (positive predictive value). These different parameters provide an analysis of the model’s performance from different perspectives. Accuracy represents the percentage of images correctly classified, sensitivity describes the proportion of actual positive images correctly predicted as positive, and precision represents the proportion of predicted positive images that are actually positive. Precision, sensitivity, and accuracy are calculated using Equations 3).
CNN models were trained using MPBT and MBT MRI images with consistent parameters, including epoch = 30, 60, 90; Batch Size = 8; ReLU activation function; and Categorical Cross-Entropy loss function. The training was conducted on an Asus Laptop with an Intel® Core i5-7200U CPU @ 2.50 GHz processor and 12.00 GB RAM NVIDIA GeForce930MX. Keras, a python module, was used as a frameworkfor all the networks.
The evaluation of the models was performed using 204 brain tumor MRI images, consisting of 102 MPBT and 102 MBT images. Figure 3 illustrates the accuracy and loss graphs for each VGG19 and ResNet101 model. Table 4 presents the performance of each model based on accuracy (A), sensitivity (S), and precision (P). Additionally, Figure 4 displays the confusion matrix for each model.
The result of each model by accuracy (A), sensitivity (S), and precision (P) metrics
The result of each model by accuracy (A), sensitivity (S), and precision (P) metrics
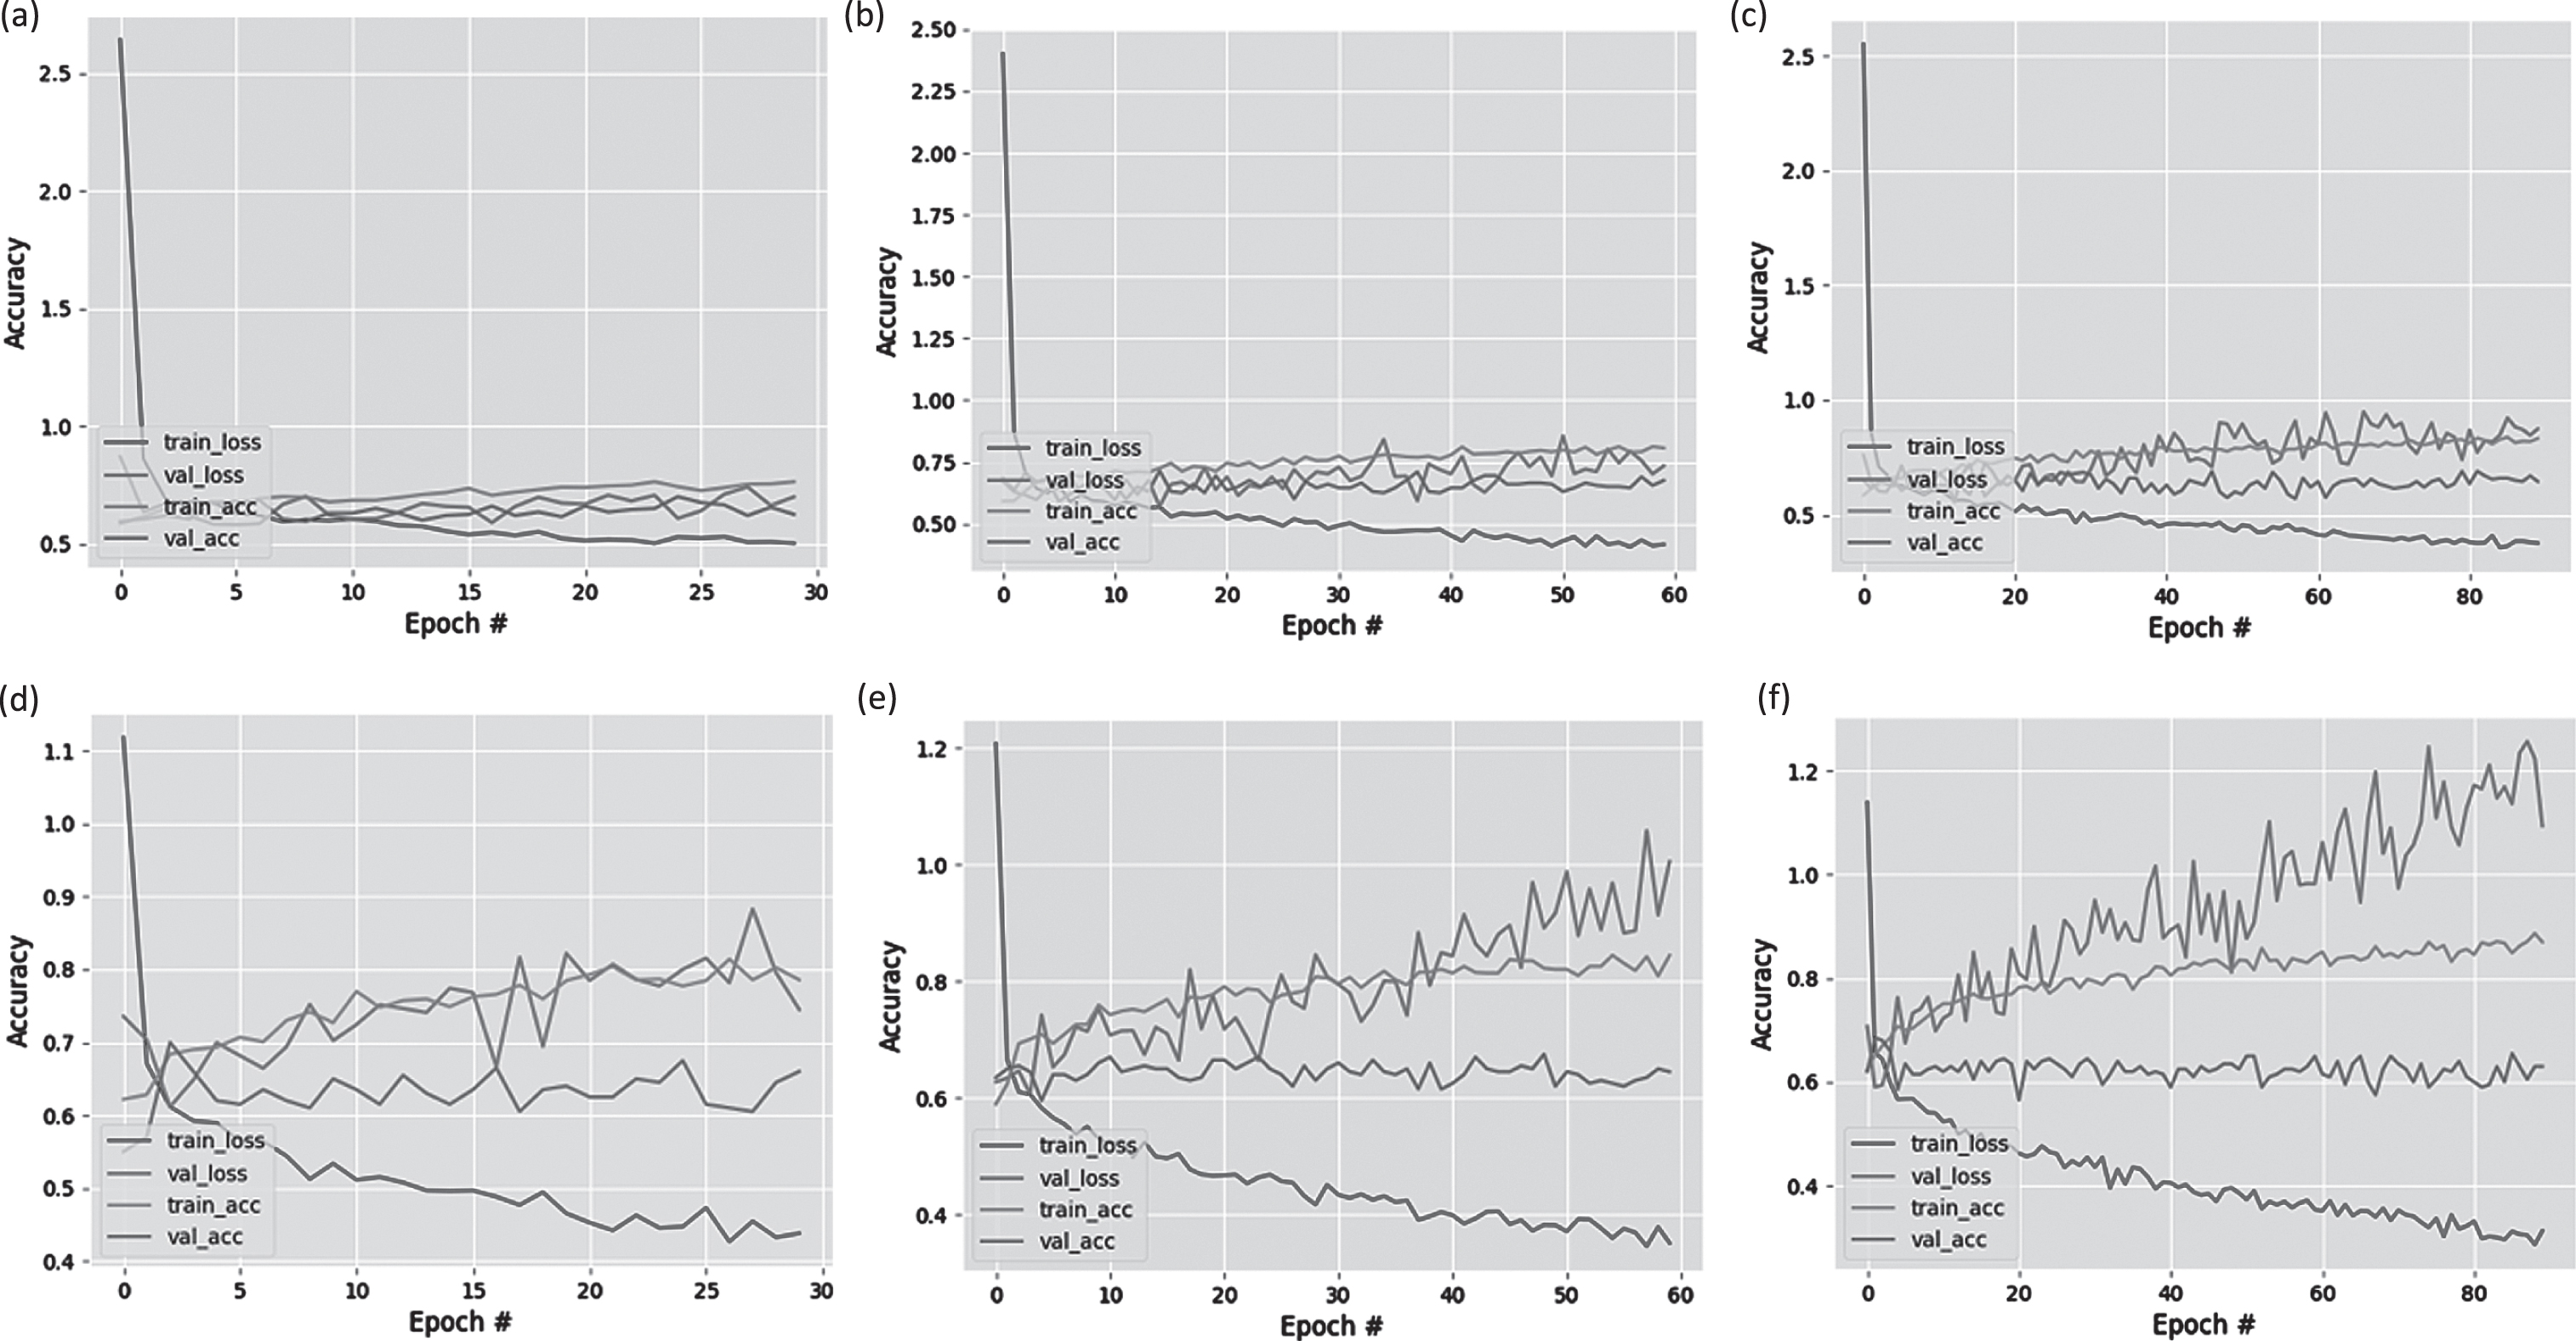
The accuracy and loss graphics of VGG 19 using epoch (a) 30, (b) 60, (c) 90 and ResNet101 using epoch (d) 30, (e) 60, (f) 90.
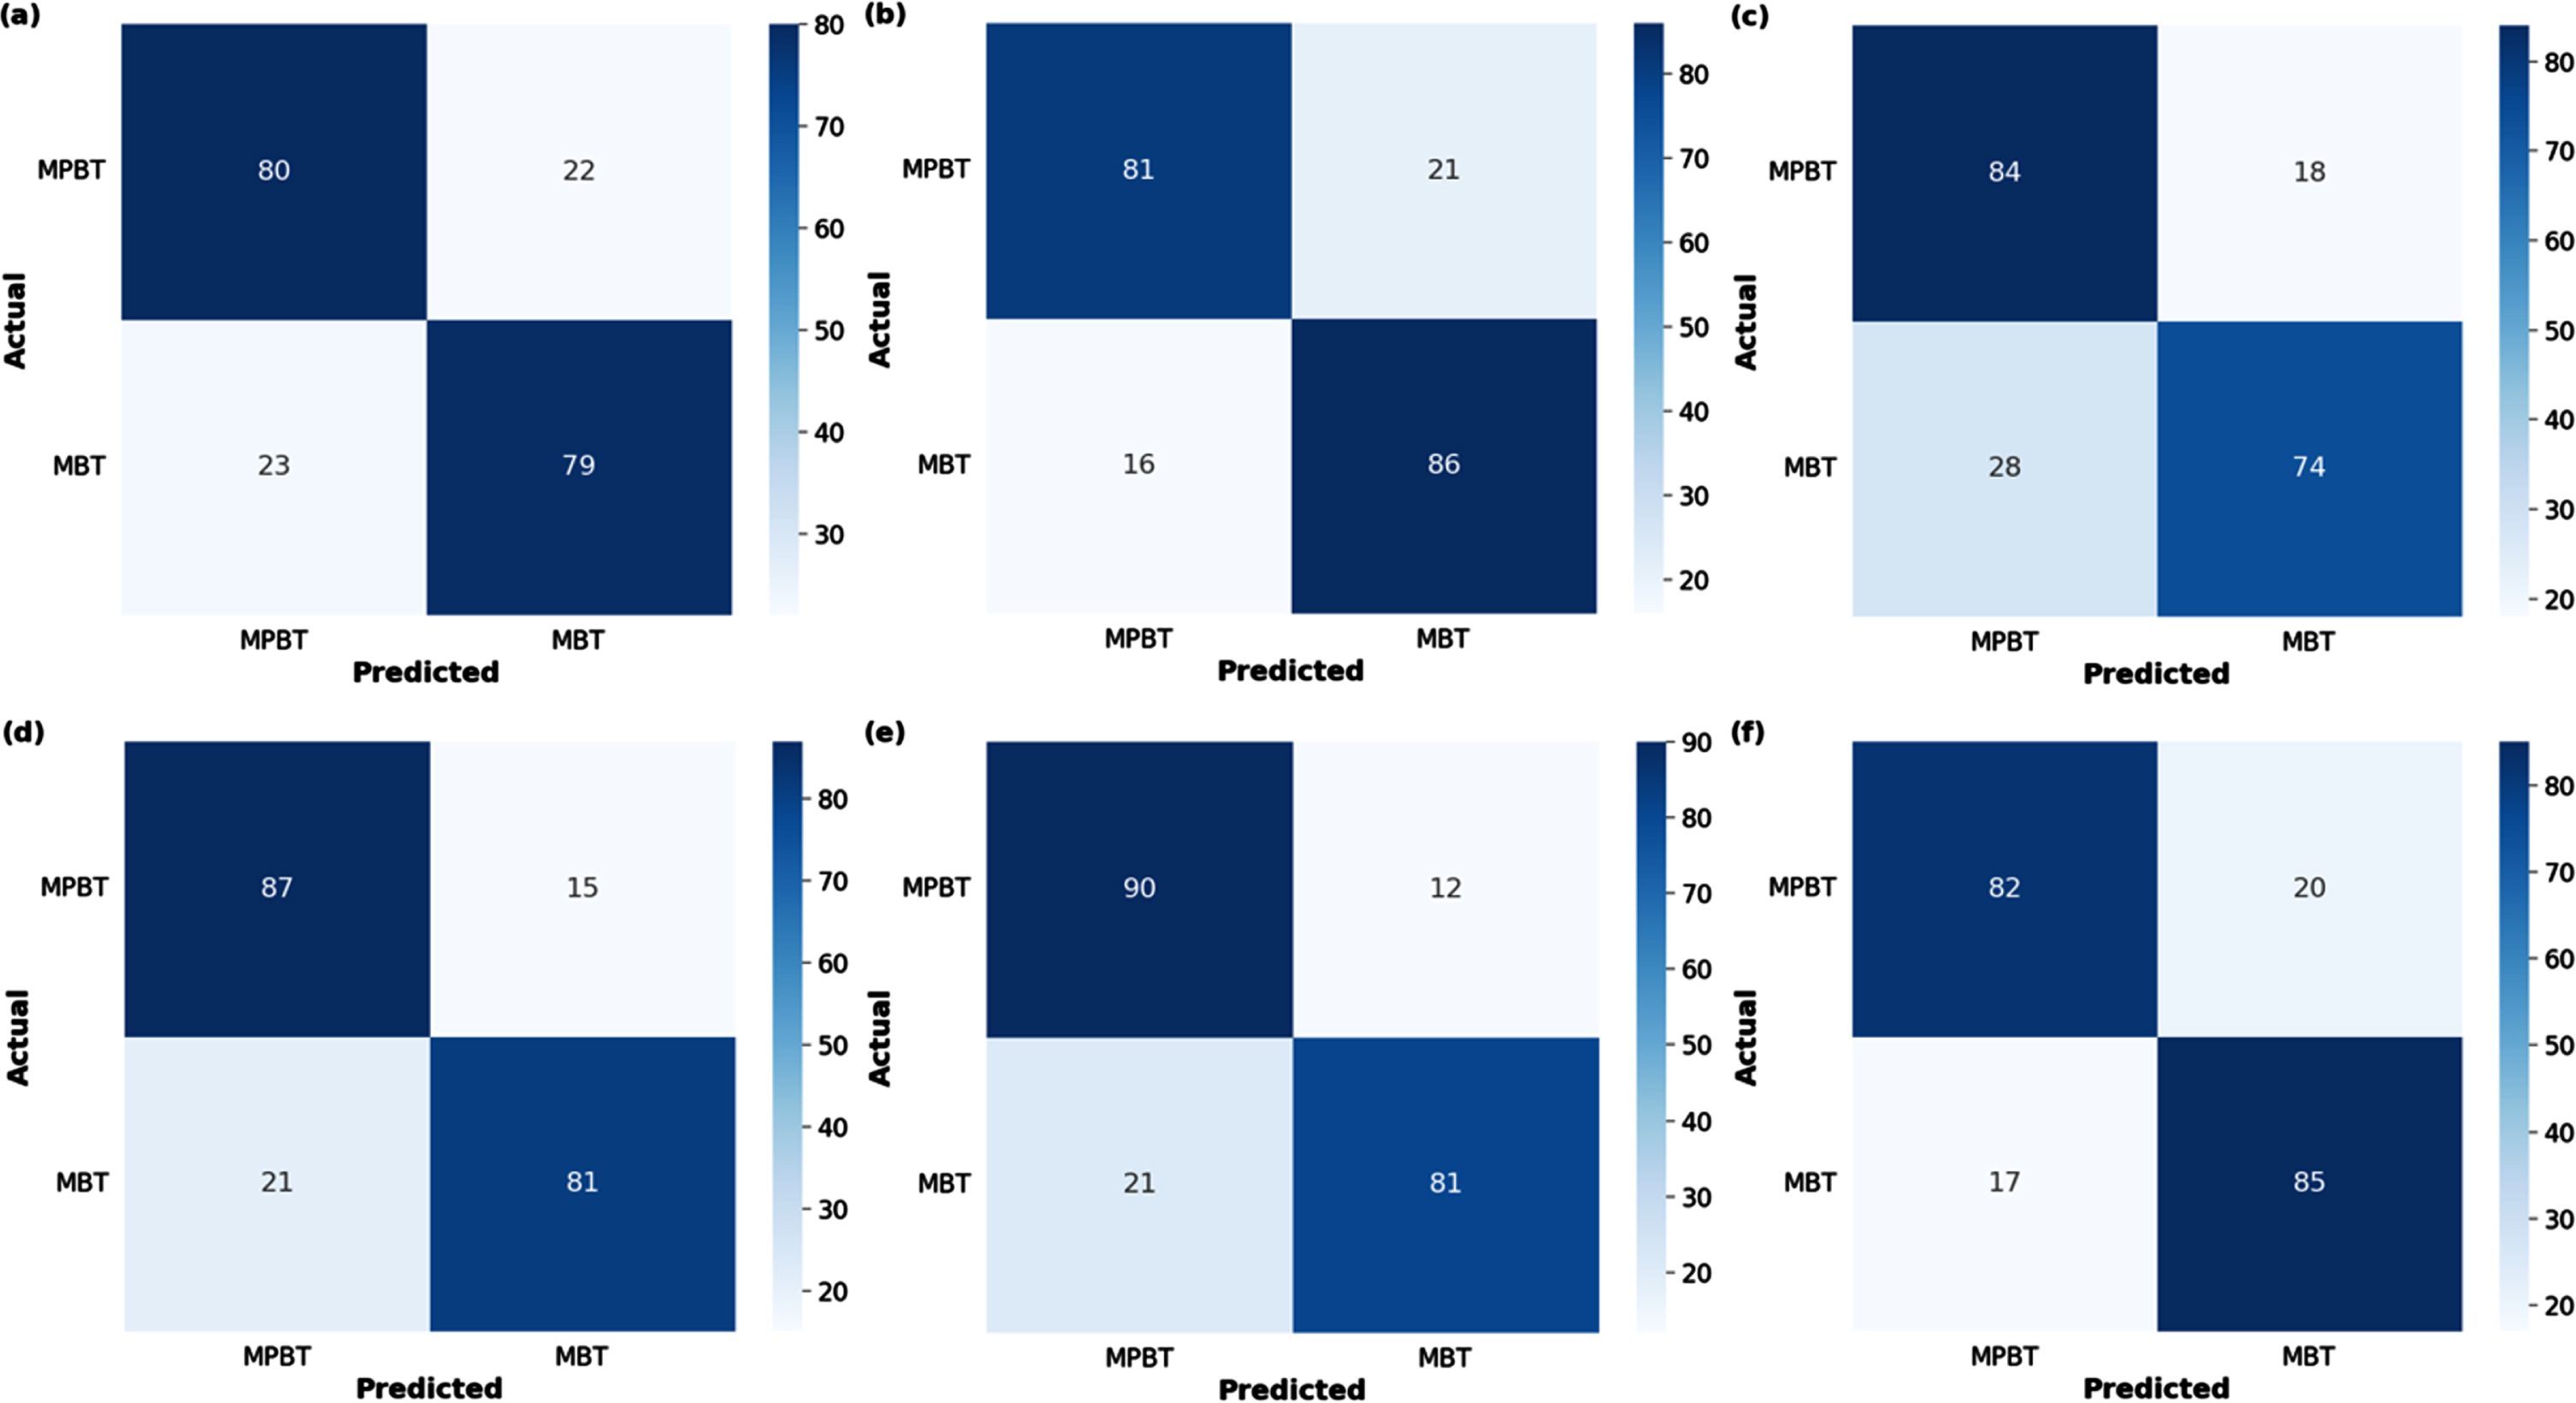
The confusion matrics of VGG 19 using epoch (a) 30, (b) 60, (c) 90 and ResNet101 using epoch (d) 30, (e) 60, (f) 90.
Based on the data, the results indicate that the model with the highest performance is ResNet101 epoch 60, achieving an accuracy, sensitivity, and precision of 83%. It shows an improvement in both train and validation accuracy; however, there is a significant increase in validation loss. Furthermore, this model successfully classified 90 out of 102 MPBT images accurately.
On the other hand, VGG19 epoch 60 also demonstrated good performance, with an accuracy, sensitivity, and precision of 81%. It exhibited relatively stable train and validation accuracy, as well as validation loss. This model correctly classified 86 out of 102 MBT images, outperforming the other models in terms of classification accuracy.
Furthermore, since the dataset used consisted of various MRI sequences (T1, T2, T1C, and FLAIR), a comparison was conducted between each model and these sequences. Table 5 presents the testing data used. The sensitivity of the models in classifying MPBT and MBT is shown in Tables 6 7.
The data testing
The sensitivity of the models in classifying MPBT
The sensitivity of the models in classifying MBT
Based on the data, the T2 sequence exhibited the highest average sensitivity for MPBT images, with a value of 86% compared to other sequences. The model with the highest sensitivity was VGG19 epoch 90, achieving 96%. For MBT images, the sequences with the highest average sensitivity were T1C and T1, with values of 91.6% and 91.3%, respectively. The model with the highest sensitivity for T1C and T1 was VGG19 epoch 90, with values of 96.1% and 96.0%, respectively. These findings suggest that the T2 sequence is particularly effective in detecting MPBT, while T1C and T1 sequences are more sensitive in identifying MBT. The VGG19 model at epoch 90 consistently demonstrated superior sensitivity in classifying both tumor types.
Distinguishing MPBT and MBT accurately is crucial for improving patient outcomes and optimizing healthcare services. Incorrect diagnosis can lead to the administration of improper therapies, worsening the patient’s condition and resulting in mortality. The use of DL is expected to assist doctors in establishing a faster and more accurate diagnosis. Table 8 displays a previous study on brain tumor classification using VGG19 and ResNet101 with similar MRI sequences.
The comparison of previous study on brain tumor classification using VGG19 and ResNet101 with similar MRI sequences
The comparison of previous study on brain tumor classification using VGG19 and ResNet101 with similar MRI sequences
From the comparison, it is evident that the study by Rajinikanth et al. reported high accuracies of 94.7% and 93.9% for the VGG19 and ResNet101 models, respectively. These accuracies were obtained using a dataset of 6300 images sourced from The Brain Tumor Segmentation (BRAST). The study focused on classifying images into high-grade and low-grade gliomas using three sequence types: T2, T1C, and FLAIR [30, 31]. In contrast, this study achieved accuracies of 78.3% and 81.6% for the VGG19 and ResNet101 models, respectively, based on processing 1360 images obtained from Dr. Moewardi Hospital. The sequences utilized in this study were T1, T2, T1C, and FLAIR, aiming to classify the images into MPBT and MBT.
A significant difference in accuracy between the two studies is apparent. One important factor is the composition of the datasets used. It is not simply a matter of the quantity of data, but rather the extent to which the dataset represents the original distribution of the target population. Inaccurate or unrepresentative datasets can introduce bias and affect the generalizability of the results. Therefore, careful consideration should be given to dataset selection and ensuring that it adequately represents the population being studied [32] Additionally, the sequences employed in the studies differ. This study also includes the use of T1, which is known for its ability to visualize brain anatomy. However, certain types of brain tumors are challenging to identify using this sequence, whereas they are more easily distinguishable using T2, T1C, and FLAIR [33, 34]. Furthermore, the classification outcomes differ between the studies. Rajinikanth et al. focused on classifying high-grade and low-grade gliomas, which are both types of MPBT. In contrast, this study aimed to differentiate between MPBT and MBT [30].
In addition to evaluating the model’s overall accuracy, this study also analyzed the results from a medical perspective regarding the impact of different sequences on the model’s classification outcomes. Sensitivity was chosen as the parameter for this analysis. Several guideline development studies have highlighted sensitivity as one of the latest decision tools for describing the potential improvements in the utilization of imaging techniques [35]. However, this specific analysis has not been previously investigated in prior studies, and therefore, there are no existing results for comparison.
The results of this research indicate variations in the sensitivity of deep learning models when classifying MPBT and MBT across different MRI sequences. For MPBT classification, the T2 sequence exhibited the highest sensitivity, while for MBT classification, the T1C and T1 sequences demonstrated the highest sensitivity. Conversely, the T1 sequence showed the lowest sensitivity for MPBT, while the T2 sequence showed the lowest sensitivity for MBT. The magnitude of sensitivity difference between the highest and lowest values was significant for each tumor type.
MRI sequences play a crucial role in determining the sensitivity of the deep learning models. Different sequences, such as T1, T2, fat-suppressed, and enhanced gadolinium, provide distinct images when there are tissue abnormalities present. Among these sequences, T1, T2, T1C, and FLAIR are commonly used for diagnosing brain tumors [25].
The T1 sequence is a routine and widely used sequence in MRI protocols. It offers a clear anatomical image that closely resembles the macroscopic appearance of the tissue. It has a short Echo Time (TE) and Repetition Time (TR), which influence the image characteristics [36].
On the other hand, the T2 sequence, which has a long TE and TR, is also included in almost all MRI protocols. The difference between TE and TR settings tends to produce different image results [37]. Table 9 shows the differences in the intensity and color of human tissue produced by T1 and T2 sequences.
The differences in intensity and color produced by T1 and T2 sequences
The administration of contrast in MRI scans can enhance the visibility of certain tissues and pathological conditions. Contrast agents are more commonly used in the T1C sequence because they tend to increase the signal intensity in T1. Pathological tissues like tumors, inflammation, and infections often exhibit contrast enhancement due to leaky blood vessels. This accumulation of contrast agent causes the tissue to appear brighter compared to the surrounding tissues [25].
FLAIR is a specialized sequence with a long inversion time that suppresses the signal from cerebrospinal fluid (CSF). In this sequence, brain tissue mimics the appearance of T2, with gray matter appearing lighter than white matter. FLAIR is particularly useful in evaluating various CNS diseases, including infarction, multiple sclerosis, subarachnoid hemorrhage, head injury, and others [38].
The type of brain tumors including MPBT and MBT is another variable that directly affects DL sensitivity. MPBT and MBT originate from abnormal tissue inside and outside the brain, and this makes them have special characteristics. The typical characteristics of MPBT include a well-defined tumor, irregular shape, necrosis, and peripheral edema. MRI is significantly more sensitive to the tumor and peritumoral edema presence. Meanwhile, MBT has large lesions and a limited mass effect, indicating that there is infiltrative growth. The distinctive characteristic of MBT is that it is often found at the gray-white matter junction. This location is localized to 80% of the cerebral hemispheres. Moreover, MBT has a peripheral sphenoid coiled that becomes lesional, multiple, and anoxal oedematous. Table 10 shows the characteristics of MPBT and MBT [26, 40].
The characteristic differences between MPBT and MBT
The characteristics of MPBT and MBT produce several MRI images. Table 11 shows the differences in each MPBT and MBT appearance [41–43].
MPBT and MBT MRI images in each sequence
MPBT has special characteristics that are surrounded by extensive vasogenic edema and heterogeneous patchy enhancement. These characteristics can be seen in the sequence T2. MBT has a special characteristic, namely ring-enhancing which can be seen in the T1C sequence. In addition, the typical MBT location is in a grey-white matter junction and the number of multiple can be seen in sequence T1. This distinctive characteristic is following the results of this study where MPBT has the highest accuracy in the T2 sequence (Table 6) and MBT in the T1C and T1 sequences (Table 7).
FLAIR sequences produce an image of hyperintense tumor lesions. However, this image does not become a special characteristic because it can be found in MPBT and MBT. Meanwhile, T1 and T1C sequences have no distinct characteristics to MPBT. It is similar to that found in the T2 sequence on MBT. This corresponds to the results in Tables 6 7 where FLAIR accuracy is middle in both tumor types and low on T1 and T1C for MPBT and T2 for MBT. Table 12 shows the specific pattern of MPBT and MBT in each sequence.
Specific pattern of MPBT and MBT in each sequence
The findings discussed have several implications for the use of DL in brain tumor classification and MRI sequence selection. Firstly, DL algorithms can benefit from the specific characteristics exhibited by different tumor types in various MRI sequences. By training these algorithms on a diverse dataset that includes multiple sequences, they can learn to identify and interpret the distinct patterns associated with different tumor types. This can enhance their ability to accurately classify brain tumors based on the MRI images.
Secondly, the identification of MRI sequences that exhibit higher sensitivity for specific tumor types, such as T2 for MPBT and T1C/T1 for MBT, suggests the importance of sequence selection in DL models. Integrating this knowledge into the design of DL architectures and preprocessing pipelines can help optimize the performance of these models in brain tumor classification tasks. By focusing on the most informative sequences, DL algorithms can extract relevant features and make more accurate predictions.
Furthermore, these findings highlight the need for continued research and development in DL techniques for brain tumor classification. As the field progresses, more sophisticated models can be designed to leverage the specific characteristics observed in MRI sequences, improving their ability to discriminate between different tumor types and providing more precise diagnostic information. This can assist clinicians in making informed treatment decisions and selecting appropriate therapies tailored to individual patients.
Ultimately, the implications of these findings suggest that DL, in conjunction with optimized MRI sequence selection, has the potential to revolutionize brain tumor classification. By harnessing the power of AI and combining it with advanced imaging techniques, we can expect improved accuracy, efficiency, and personalized approaches to brain tumor diagnosis and treatment, which holds promise for enhancing patient outcomes and advancing the field of neuro-oncology.
In conclusion, this study aimed to classify malignant primary brain tumors (MPBT) and metastatic brain tumors (MBT) using deep learning models and evaluate the impact of different MRI sequences on their performance. Two CNN architectures, VGG19 and ResNet101, were trained and tested on a dataset of MPBT and MBT MRI images.
The results showed that both VGG19 and ResNet101 achieved good performance in classifying brain tumors. ResNet101 with epoch 60 demonstrated the highest accuracy, sensitivity, and precision of 83% and successfully classified 90 out of 102 MPBT images accurately. VGG19 with epoch 60 achieved an accuracy, sensitivity, and precision of 81% and accurately classified 86 out of 102 MBT images. Both models showed improvement in train and validation accuracy.
The comparison of MRI sequences revealed that the T2 sequence had the highest average sensitivity for MPBT images, while T1C and T1 sequences were more sensitive in identifying MBT. VGG19 at epoch 90 consistently demonstrated superior sensitivity in classifying both tumor types. Therefore, we recommend using the T2 sequence for MPBT classification and T1C and T1 sequences for MBT classification in future applications.
These findings highlight the potential of deep learning models in accurately classifying brain tumors and the importance of considering different MRI sequences for improved classification performance. The study contributes to the existing literature on brain tumor classification using deep learning techniques.
However, it is worth noting that the accuracies achieved in this study were lower compared to some previous studies. Further research and exploration are needed to enhance the performance of the models and increase the dataset size for more comprehensive analysis.
Overall, the application of deep learning models in brain tumor classification has the potential to assist healthcare providers in making faster and more accurate diagnoses, leading to better patient outcomes and optimized healthcare services. MRI sequences with higher sensitivity for specific tumor types underscores the importance of sequence selection in optimizing deep learning models.
Footnotes
Acknowledgments
The authors are grateful to the Faculty of Medicine, Universitas Brawijaya, for the funding and support provided through the 2022 Professorial Grant.
Ethical statement
The datasets collection was approved by the Health Research Ethics Committee, Dr. Moewardi Hospital Surakarta (Ethical Clearance No. 846/VI/HREC/2022).