
Abstract
The peritoneal equilibration test (PET) is the most widely used measure of peritoneal membrane transport status in peritoneal dialysis (PD) patients (1). Central to this assessment is measurement of dialysate and plasma creatinine. The Jaffe reaction continues to be the most widely used method of creatinine determination (2,3). The presence of substances such as ascorbate, bilirubin, cephalosporin antibiotics, and glucose results in interference in the measurement of creatinine by this reaction (4). Using the Jaffe method, Tam et al. confirmed a positive linear relationship between glucose concentration and spurious creatinine concentrations sampled from unused PD solution of various glucose concentrations (5). The linear relationship allows for a mathematical adjustment of a center-specific glucose correction factor for dialysate creatinine determination by taking an average of the ratios of the “measured” creatinine concentration and the measured glucose concentration from samples of unused PD solution of a fixed glucose concentration.
Application of the glucose correction factor allows for a more accurate assessment of peritoneal membrane transport characteristics during a routine PET. Furthermore, in recent years, the switch from a 2.5% PET to a modified 4.25% PET, as suggested by current guidelines to better discriminate and characterize ultrafiltration failure, has the potential to further spuriously elevate peritoneal membrane transport status (dialysate-to-plasma ratio of creatinine higher than it actually is) if the glucose correction factor is not applied (6).
Despite increased interest and use of novel, neutral pH, low glucose degradation product (GDP), glucose-based PD solutions, little is known regarding the impact of other constituents of these solutions (including bicarbonate and a lower GDP content) on the relationship between glucose concentration and the measured creatinine concentration determined from the Jaffe reaction. Here, we sought to determine whether the glucose correction factor required modification in the presence of a commercially available low GDP, neutral pH, PD solution.
Materials and Methods
Unused, sealed, commercially available PD solutions [Dianeal (DN; pH 5.2) and Physioneal (PN; pH 7.4); Baxter Healthcare, Deerfield, IL, USA] with approximate dextrose concentrations of 0.5% (22.5 mmol/L for DN only), 1.5% (76 mmol/L), 2.5% (126 mmol/L), and 4.25% (214 mmol/L) for both DN and PN were obtained. At least two samples per bag and two bags of each solution type and strength were taken (4 measurements per solution type and strength) to ensure sampling from two different production lots. To ensure proper sampling of the final PN solution, which is commercially available in a double-chambered bag, samples were taken only after 10 minutes of admixture of the two compartments. In addition, glucose solutions of similar concentrations (0.5%, 1.5%, 2.5%, and 4.25%) were prepared using reagent grade glucose (BDH Chemical, Toronto, ON, Canada) in a normal saline solution (NS; Fisher Scientific, Nepean, ON, Canada).
Samples were measured for creatinine and glucose in quadruplicate on the Architect c8000 chemistry system (Abbott Laboratories Diagnostics Division, Abbott Park, IL, USA). Glucose was measured using Abbott reagent list number 3L82, which is the hexokinase method via the reduction of NADP. Creatinine was measured using Abbott reagent list number 3L81, which is a modified Jaffe method whereby a creatinine–picrate complex forms under alkaline pH. The assay uses a rate-blanked kinetic method and is traceable to NIST SRM 967, as measured by isotope dilution mass spectrometry. The rate of complex formation is monitored spectrophotometrically and is directly proportional to creatinine concentration.
For each solution type and strength, the mean and standard deviation of the measured glucose and creatinine concentrations were calculated. A multivariable linear regression model was then applied to evaluate the impact of glucose concentration on the apparent creatinine concentration (the dependent variable). The three independent variables in the model included glucose concentration, solution type (entered as indicator variables with DN as the reference), and an interaction term for solution type and glucose concentration. All statistics were analyzed using SAS version 9.2 (SAS Institute, Cary, NC, USA)
Results
Table 1 lists the mean glucose and creatinine concentrations measured in each of the solutions. The bag-to-bag variation in glucose concentration was greatest for the PN solutions, most notably for the 1.5% dextrose concentration.
Measured Glucose and Creatinine Concentrations from Dianeal and Physioneal a Peritoneal Dialysis Solutions as Well as from a 0.9% Saline Solution with Similar Glucose Concentration
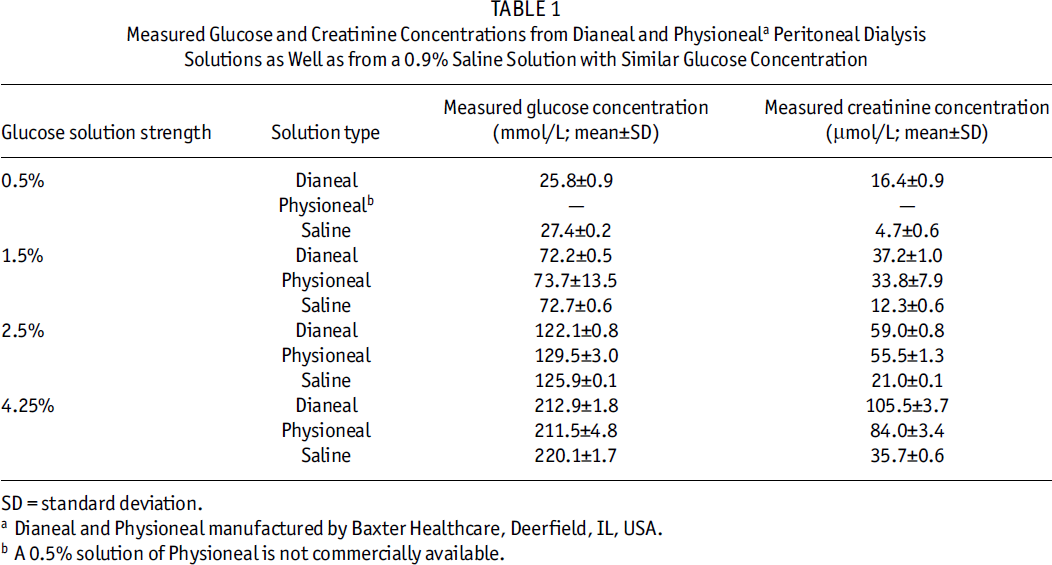
SD = standard deviation.
Dianeal and Physioneal manufactured by Baxter Healthcare, Deerfield, IL, USA.
A 0.5% solution of Physioneal is not commercially available.
Table 2 lists the results of the linear regression. As predicted, there was a strong relationship between glucose concentration and spuriously high creatinine concentration in the DN solution (β = 0.47 ± 0.007, p < 0.0001). Compared to DN, there was a significant difference in the relationship between glucose and measured creatinine concentration in the PN samples, with a difference in both the slope (β = –0.10 ± 0.01, p < 0.0001) and the intercept (β = 2.96 ± 1.48, p = 0.05) of the relationship. Similarly, compared to DN, the relationship between creatinine and glucose in the glucose–NS solution exhibited a difference in the slope (β = –0.31 ± 0.01, p < 0.0001) and the intercept (β = –2.98 ± 1.39, p = 0.04).
Results from a Multivariable Linear Regression Model: Impact of Solution Type and Glucose Concentration on Measured Dialysate Creatinine
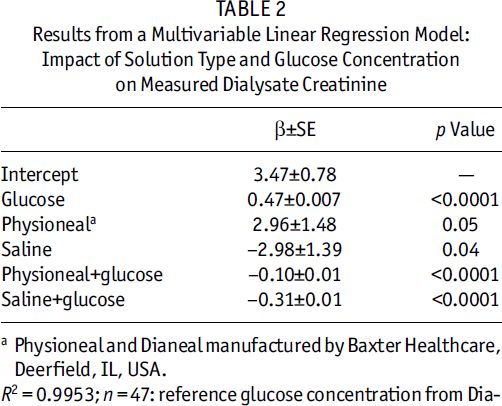
Physioneal and Dianeal manufactured by Baxter Healthcare, Deerfield, IL, USA.
R2 = 0.9953; n = 47: reference glucose concentration from Dia-
Figure 1 demonstrates the relationship between measured creatinine concentration and glucose concentration for all three solutions. For a given glucose concentration, the spurious measurement of creatinine was highest for DN, followed by PN, and lowest for the glucose–NS solution.
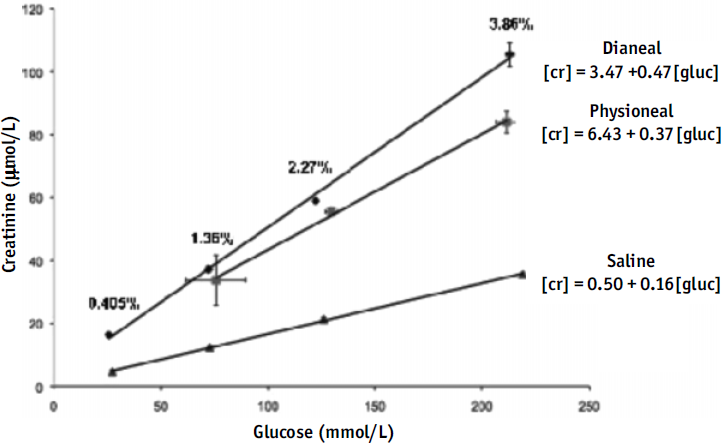
Glucose interference in peritoneal dialysis fluid is demonstrated in the relationships between solution type and measured glucose and creatinine concentrations. [cr] = creatinine concentration (μmol/L); [gluc] = glucose concentration (mmol/L). Physioneal and Dianeal manufactured by Baxter Healthcare, Deerfield, IL, USA.
Discussion
The major finding of the present study is that, although in both solution types (DN and PN) the degree of interference is directly proportional to the glucose concentration, the effect appears to be modified by PD solution type, with the highest degree of interference seen with DN. The difference in the slope and intercept between the glucose–NS solution and DN suggests that these differences may be mitigated by several non glucose-related constituents.
One such constituent may be calcium. Previously, calcium was shown to interfere with the Jaffe reaction of creatinine determination by promoting a further spurious increase in creatinine measurement in the presence of glucose (7). All solutions used had the same calcium concentration (1.75 mmol/L) with the exception of the DN 0.5% strength solution (calcium 1.625 mmol/L). However, even after excluding the DN 0.5% samples from the analysis, our results did not change appreciably. Therefore, it is possible that, in the presence of a bicarbonate-based buffer such as in PN (bicarbonate 25 mmol/L, lactate 15 mmol/L), there may be an attenuation of the nonspecific reaction between glucose and the picrate reagent possibly due to buffering by the addition of bicarbonate at neutral pH.
An additional explanation may be the lower total GDP content in PN compared to DN (228 vs 426 μmol/L) (8). It has been previously demonstrated that, among commercially available PD solutions with low GDP and neutral pH, wide variations in spurious creatinine measurements at a fixed glucose concentration are obtained using the Jaffe method (9). However, in addition to being of different solution types, these solutions also have different pH and buffer (lactate vs bicarbonate vs bicarbonate and lactate). Our results further suggest the possible interference of GDP in creatinine determination by the Jaffe method, with a consistently lower creatinine measurement in PN compared to DN.
In conclusion, a single glucose correction factor cannot be uniformly applied to both a conventional and a low-GDP PD solution. Arguably, the clinical implications of these findings may be less intuitive than those in the research setting, where we continue to move forward with multicenter clinical trials in the evaluation of novel, low GDP, neutral pH, PD solutions. If longitudinal changes in peritoneal membrane transport status are to be positioned as a clinically important outcome, accurate measurement of peritoneal membrane transport characteristics will be of utmost importance.
Footnotes
JP and JMB have both received speaker's honoraria from Baxter Healthcare Canada. PMY has received consulting fees from Abbott Laboratories.
Acknowledgments
The authors thank Dorothy Burdzy, RN, and the Home Peritoneal Dialysis Unit at the University Health Network, Toronto, for their help and support in the preparation of this manuscript.