
Abstract
Background
Dialysis patients are classified according to their peritoneal permeability as low transporter (LT, low solute permeability) or high transporter (HT, high solute permeability). Tight junction (TJ) proteins are critical to maintain ions, molecules and water paracellular transport through peritoneum. Exposure to peritoneal dialysis solutions causes damage to TJ in human peritoneal mesothelial cells (HPMCs). We analyzed the quantity, distribution and function of TJ proteins: claudin-1, -2 and -8, ZO-1 and occludin, in HPMC cultures from LT and HT patients. Since all-trans retinoic acid (ATRA) might modify the expression of TJ proteins, we studied its effect on HPMCs.
Methods
Control HPMCs were isolated from human omentum, while HT or LT cells were obtained from dialysis effluents. Cells were cultured in presence of ATRA 0, 50 or 100 nM. Transepithelial electrical resistance (TER) measurement, immunostaining and Western blot analyses were performed.
Results
HT exhibited lower TER than control and LT monolayers. Immunofluorescence for TJ was weak and discontinuous along the cell contour, in LT and HT. Furthermore, claudin- 1, occludin and ZO-1 expressions were decreased. In all groups, claudin-2 was localized at nuclei. We observed that ATRA improved TJ distribution and increased TJ expression in HT. This retinoid did not modify claudin-2 and -8 expressions. All-trans retinoic acid decreased TER in HT, but had no effect in LT.
Conclusions
Tight junctions were altered in HPMCs from dialyzed patients. The HT monolayer has lower TER than LT, which might be associated with the peritoneal permeability in these patients. ATRA might be a therapeutic alternative to maintain mesothelial integrity, since it improved TJ localization and expression.
Keywords
The peritoneum consists of three major components: the capillary wall, the interstitium and the mesothelium (7,8). Mesothelium is formed by a monolayer of cells resting upon a basement membrane (9,10). Mesothelial cells constitute the major surface area across which molecular exchange occurs during CAPD. These cells possess several different types of intercellular junctions, including tight junctions (TJs), adherens junctions, desmosomes and gap junctions (11). Tight junctions encircle the apical end of the lateral surface of adjacent cells, they regulate the diffusion of ions, water and small and large solutes through the paracellular pathway (gate function), and also separate proteins, lipids and other molecules in the apical and basolateral plasma membrane domains (fence function) (12). Tight junctions are complexes composed of transmembrane proteins such as claudins, occludin, tricellulin and junctional adhesion molecules (JAMs), and their adapter and scaffolding proteins (ZO-1, ZO-2 and ZO-3, cingulin, MUPPI) that anchor membrane proteins to the actin cytoskeleton (13). Claudins comprise a family consisting of 24 members in humans. They are the major component of TJ. Claudins possess two extracellular loops that display variability in the distribution and number of charged residues. This feature is crucial as it determines the paracellular ionic selectivity of the TJ (13). Claudins are found in all epithelial and endothelial cells and their distribution is tissue specific. For example claudin-2 is present in leaky epithelia (e.g. proximal tubule) and absent in tight epithelia (e.g. collecting segment) (14). In contrast, claudin-8 is present in tighter segments of the nephron (15). Expression of TJ proteins such as claudin 1, occludin and ZO-1, has been described in human peritoneal mesothelial cells (HPMCs) (16-18) but differences between LT and HT were not explored. Additionally, we explored for the first time the expression of claudin-2 and -8, in HPMCs. Among claudins, claudin-2 expression is restricted to leaky epithelia (14), as the proximal tubule, where the transepithelial electrical resistance (TER) value is 5 – 8 Ω•cm2 (19). Moreover, this protein can convert TJ from a tight to a leaky phenotype (20,21). The peritoneum is a very permeable membrane and the TER values in our cultures (6 – 11 Ω•cm2) were similar to the proximal tubule. Therefore, it was expected that HPMCs express claudin-2. In contrast, claudin-8 was chosen as a barrier-forming protein, in tighter epithelia (22).
Continuous ambulatory peritoneal dialysis is associated with morphologic changes of mesothelial cells, such as loss of the microvilli, widening of the intercellular spaces, and exfoliation. High glucose concentration in the culture media damage the intercellular junctions of HPMCs, with the damage not only being induced by glucose itself but also by hyperosmolality, and a glucose-stimulated increase of transforming growth factor-β1 and reactive oxygen species (17,23-26). Mesothelium provides resistance against solute permeation. Damage in their intercellular junctions leads to a decrease in their intercellular binding capacity and thus induces an increase in the solute permeability.
All-trans retinoic acid (ATRA) is the active metabolite of vitamin A. It regulates a wide range of functions, such as embryonic development and organogenesis, tissue homeostasis, cell proliferation, differentiation and apoptosis (27). All-trans retinoic acid effects are mediated through its binding to retinoid receptors, members of the nuclear receptor family. It has been reported that ATRA induces expression of TJ-associated molecules in F9 murine embryonal carcinoma cells (28), in Madin-Darby Canine Kidney cell line (29) and in oral keratinocytes (30). Moreover, these changes in the TJ protein expression are accompanied by modifications in the TER and in the paracellular transport (29-32).
The aim of this investigation was to study: 1) the distribution and expression of TJ proteins (claudin-1, -2 and -8, occludin and ZO-1) in mesothelial cells from patients with LT or HT, 2) the barrier function by measurement of the TER and 3) the possible beneficial effect of ATRA.
Material and Methods
Reagents and Chemicals
Antibodies against: claudin-1 (Cat. no. 51-9000), claudin-2 (Cat. no. 51-6100), occludin (Cat. no. 71-1500) and ZO-1 (Cat. no. 61-7300) were obtained from Zymed (South San Francisco, CA, USA), claudin-8 (Cat. no. 40-0700Z) was obtained from Invitrogen (Gibco Invitrogen Corporation, NY, USA), mouse anti-actin was provided by Dr. Jose Manuel Hernandez (Department of Cell Biology, CINVESTAV) (33). Secondary antibodies: Alexa fluo 488 donkey anti-rabbit (Cat. no. A-21202) was from Invitrogen, and horseradish peroxidase (HRP) anti-rabbit was from Zymed. All-trans retinoic acid (Cat. no. R-2625) was obtained from Sigma-Aldrich (St. Louis, MO, USA). Other reagents were from Gibco Invitrogen or from Sigma.
Patients
Peritoneal biopsies were obtained from non-uremic patients, including 12 female, with a mean age of 38.4 ± 2.0 years (range 23 – 48 years). Samples were taken from patients undergoing abdominal operations after informed consent. Effluent-derived mesothelial cells were obtained from CAPD patients (n = 24), including 15 low transporters and 9 high transporters receiving glucose-based dialysis solutions at 1.5 or 2.5 %. Clinical characteristics are shown in Table 1. Diabetic patients were not included.
Cell Culture
Biopsies were collected in cold PBS and incubated with 0.25% trypsin and 0.1% EDTA for 30 min, at 37 °C. Mesothelial cells were separated from the connecting tissue by centrifugation. They were cultured in Dulbecco's Modified Eagle's Medium: nutrient mixture F-12 (Ham) (1:1) powder (DMEM/F-12) supplemented with 12% vol/ vol fetal bovine serum (FBS), penicillin (100 U/mL), streptomycin (100 mg/mL), L-glutamine (2 μg/mL), transferrin (5 μg/mL), insulin (5 μg/mL) and hydro-cortisone (0.4 μg/mL). Medium was replaced every two days, until cultures reached confluence. We will refer to these cultures as control group.
Isolation of the effluent-derived mesothelial cells was performed using a method previously described (34). Briefly, peritoneal dialysates collected overnight were drained and processed immediately. The dialysis bag content was centrifuged for 20 min, at 327 g, at 3 °C. The pellet was resuspended, plated and maintained in culture media, which were replaced every two days, until cultures were confluents. Culture media were as described for control cultures. All experiments were performed in cultures in passage 3.
Immunofluorescence
Cells were cultured until confluence in the presence of ATRA 0, 50 or 100 nM. Monolayers were washed with phosphate buffered saline, fixed with cold methanol for 10 min at 4 °C, rehydrated in PBS, permeabilized with 0.25% Triton X100 for 15 min, and then blocked with 0.5% wt/vol bovine serum albumin (Sigma-Aldrich, St. Louis, MO, USA). They were incubated overnight with the primary antibody at 4 °C. This was followed by washes with phosphate buffered saline, and incubation with the secondary antibody for 1 h at room temperature. Labeled specimens were examined under confocal laser scanning microscope Leica DMIRE-2 (Wetzlar, Germany).
Western Blot
Cells were cultured in 100 mm x 20 mm dishes (Corning, NY, USA) with ATRA 0, 50 or 100 nM until confluence. Monolayers were washed twice with cold PBS. Soluble (cytosolic) and insoluble (membrane) fractions were extracted by adding mannose-binding lectin and radioimmunoprecipitation assay buffer (100 μL each) respectively, in the presence of phenylmethylsulfonyl fluoride (Sigma, St. Louis, MO) and Complete (Roche Diagnostics, Mannheim, Germany), protease inhibitors. Total protein quantification was performed using the modified Lowry method (Bio Rad laboratories, CA, USA). Samples were denatured by boiling for 12 min and then diluted 1:5 in Laemmli (Bio Rad laboratories, CA, USA), urea buffer (0.5 M) and 2-mercaptoethanol (Bio Rad laboratories, CA). Proteins were loaded on SDS-PAGE 10% (occludin and ZO-1) or 12% (claudin-1, -2 and -8) gels and transferred to polyvinylidene difluoride sheets (Amersham BioSciences, Buckinghamshire, UK). Nonspecific binding was blocked by incubation with 5% non-fat dry milk in TBS 1X containing 0.4% Tween 20, for 1 h, at room temperature. Specific bands were detected with specific antibodies and chemiluminiscence (ECL plus Western blotting detections agents). Chemiluminescense was detected in an EC3 imaging System (UVP, Bioimaging Systems, Cambridge, UK). Protein band density was quantified by transmittance densitometry (UVP Bioimaging Systems software, Cambridge, UK).
Clinical Features from High or Low Transporters
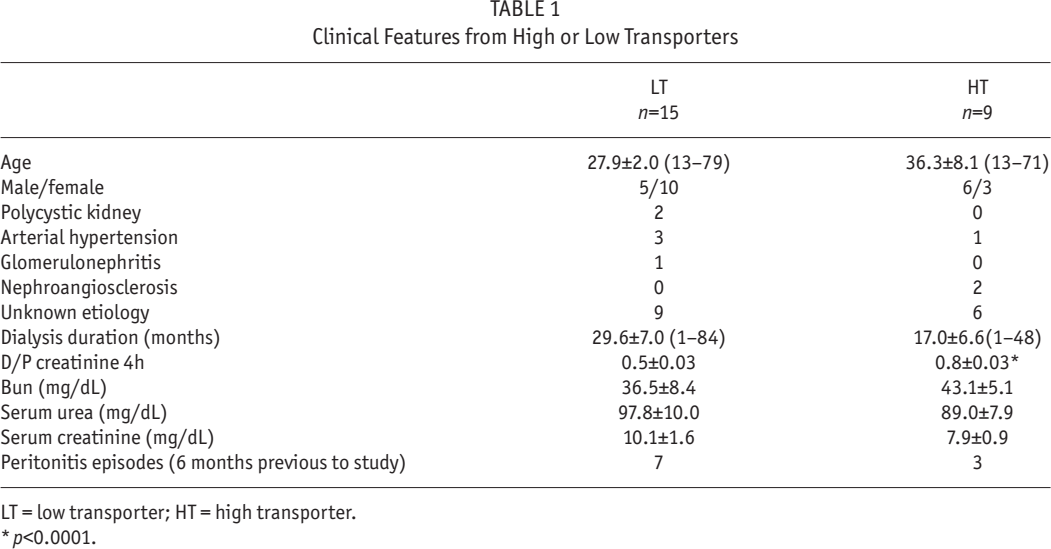
LT = low transporter; HT = high transporter.
p<0.0001.
Transepithelial Electrical Resistance (TER)
Cell suspensions from control, LT or HT (1 x 10 5 cells/ cm2) were seeded and cultured on a collagen-coated mesh (Transwell, 0.33 cm2 growth surface area, 3 μm pore size, (Corning, NY, USA)). The inner and outer chambers were filled with 0.2 ml and 1ml culture medium with ATRA 0, 50 or 100 nM, respectively. Culture media were replaced every other day. The TER was measured every other day using a voltmeter Millicell-ERS (Millipore Corporation Bedford, MA, USA). The TER was expressed as Ω•cm2. The TER of the filters without cells (30.3 ± 1.3 Ω•cm2) was subtracted from the total TER.
Statistical Analyses
Results are expressed as mean ± standard error of the mean (SEM). Differences between means from the two groups were evaluated by the Student t-test. Analysis of variance (ANOVA) was used for multiple comparisons among groups. Tukey post test was performed. P < 0.05 was considered to be statistically significant.
Results
Retinoic Acid Improved Claudin-1 Organization at the Cell Border
In control HPMCs (Figure 1 A, panel a), claudin-1 showed the usual “chicken fence” distribution at the cell boundaries (arrows) and to a lesser extent at the cytosol (asterisk) and nuclei (arrowhead) with a finely punctuated pattern. This pattern was severely altered in LT (Figure 1 A, panel b), label at cell borders was scarce and discontinuous (arrow) and some fluorescence remained at the nuclei (arrowhead). In HT (Figure 1 A, panel c), claudin-1 label was also delocalized from the cell borders (arrow), with faint localization at the cytosol (asterisks). All-trans retinoic acid 50 or 100 nM (Figure 1 A, panels d and g, respectively) induced reduction of the label at the cell borders (arrows), in control cultures. In LT (Figure 1 A, panels e and h), ATRA improved the distribution of claudin-1 at the cell limits (arrows). In HT (Figure 1 A, panels f and i), ATRA had the same effect (arrows), being more evident at 100 nM (panel i).
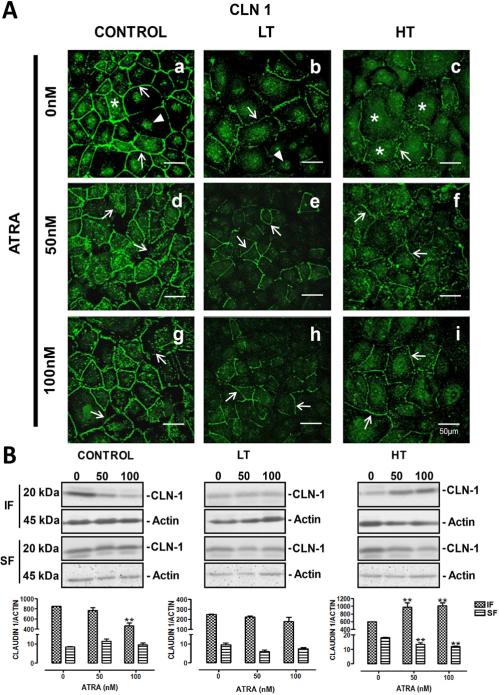
ATRA improved claudin-1 distribution in LT and HT. Panel A. Immunofluorescence for claudin-1 in control, LT and HT human peritoneal mesothelial cells grown until confluence in the presence of ATRA 0, 50 and 100 nM. The cell contour is outlined by continuous fluorescence in the control cells (a, arrows). There is also label in cytoplasm (a, asterisk) and in nuclei (a, arrowhead). Fluorescence in LT and HT (b and c, respectively) is faint and discontinuous (arrows). In LT, label at nuclei was also observed (b, arrowheads), and in HT, it was in cytoplasm (c, asterisks). Fluorescence increased and became continuous at the cell border when LT (e and h, arrows) and HT (f and i, arrows) were treated with ATRA. Panel B. Western blot analyses of soluble (cytosolic fraction, SF) and insoluble (membranal fraction, IF) claudin-1 fractions. Under basal conditions LT and HT express less claudin-1 compared to control, this being more evident in LT. In control, ATRA 100 nM decreased the expression of claudin-1 in the insoluble fraction, while in LT it did not have an effect. In HT, ATRA induced an increment of claudin-1 in the insoluble fraction accompanied by a diminution of claudin-1 in the soluble fraction. Mean±SEM of three experiments are shown. **P<0.01 vs group without ATRA. Bar = 50 μm. CLN = claudin; ATRA = all-trans retinoic acid; LT = low transporter; HT = high transporter; IF = insoluble fraction; SF = soluble fraction; SEM = standard error of the mean.
Western blot analyses were in agreement with the observations from confocal microscopy. In control cultures, ATRA reduced the claudin-1 expression in the insoluble fraction (which corresponds to TJ membranous fraction), at the highest concentration (100 nM), without changes in the soluble fraction (cytosolic), panel B. In contrast, ATRA incremented the content of claudin-1 in the insoluble fraction of HT cells, accompanied by a reduction in the soluble component (panel B). In LT, ATRA did not induce changes.
Atra Enhanced Occludin Distribution and Increased its Expression
Occludin also showed a fine distribution at the cell borders (arrow), accompanied by scarce cytosolic (asterisks) and nuclear location (arrowheads), in control HPMCs cultures (Figure 2 A, panel a). In LT (Figure 2 A, panel b), occludin immunofluorescence showed a weak and discontinuous pattern (arrows). Faint label was observed at nuclei (arrowhead). In HT (Figure 2 A, panel c), occludin was present at the cell borders (arrows) and in cytosol of some cells (asterisks). In control cultures (Figure 2A), ATRA decreases the cytosolic label of occludin (panel g, asterisks), while no change was observed in the cell borders location (panels d and g, arrows). In LT cultures (Figure 2 A, panels e and h), ATRA enhanced occludin distribution at the cell borders (arrows). Occludin location at the cell limits (arrows) was also improved by ATRA in HT (Figure 2 A, panels f and i). In control cultures, ATRA (100 nM) induced a discrete, although significant, reduction of cytosolic expression of occludin (panel B). In HT cultures, ATRA also decreased cytosolic expression; however membranous fraction was improved (panel B). As in the case of claudin-1, ATRA did not change occludin expression in LT.
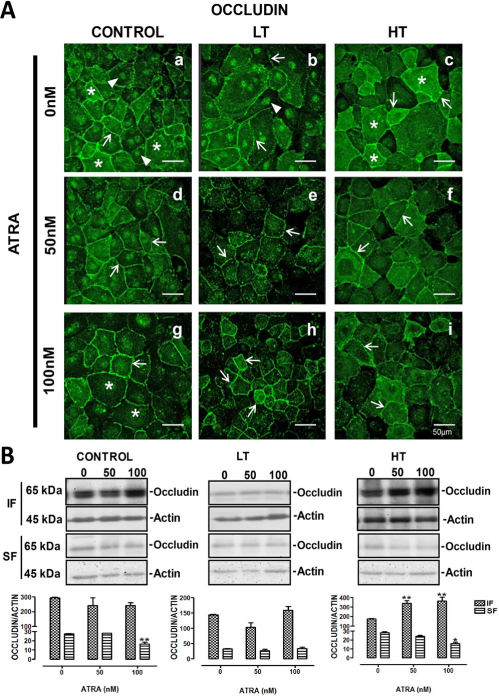
Occludin distribution at cell borders was improved by ATRA. Panel A. Occludin immunofluorescence in control, LT and HT human peritoneal mesothelial cells grown until confluence in the presence of ATRA 0, 50 and 100 nM. The cell contour is outlined by continuous fluorescence in control cells (a, arrow). There is also label in cytoplasm (a, asterisks) and in nuclei (a, arrowheads). Fluorescence in LT and HT (b and c, respectively) is weak and discontinuous at the cell border (arrows). In LT, label at nuclei (b, arrowhead) is also observed and in HT, it is abundant in cytoplasm (c, asterisks). Fluorescence increased and became continuous at the cell border when LT (e and h, arrows) and HT (f and i, arrows) were treated with ATRA. Panel B. Western blot analyses of soluble (cytosolic fraction, FS) and insoluble (membranal fraction, IF) occludin fractions. Under basal conditions LT and HT express less occludin compared to control, this being more apparent in LT. In control and LT, ATRA did not change occludin in the insoluble fraction. In HT, occludin was increased in the insoluble fraction, while it was decreased in the soluble fraction, when cells were treated with ATRA. Mean±SEM of three experiments are shown. *P<0.05 and **P<0.01 vs group without ATRA. Bar = 50 μm. ATRA = all-trans retinoic acid; LT = low transporter; HT = high transporter; IF = insoluble fraction; SF = soluble fraction; SEM = standard error of the mean.
Atra Improved ZO-1 Distribution and Increased its Expression
In control cells, ZO-1 showed a continuous linear pattern (Figure 3 A, panel a, arrow). In HMPCs obtained from the dialysate of LT or HT (Figure 3 A, panels b and c, respectively), we observed decreased labeling of ZO-1 at the cells border (arrow), compared to control. This change was more evident in cultures from LT (Figure 3 A, panel b) and also dotted label was present at cytosol (asterisks) in these cultures. ZO-1 fluorescence in HT (Figure 3 A, panel c) remained at cell borders albeit reduced (arrow). Similarly to LT, cytosolic label was observed (asterisks). All-trans retinoic acid did not modify the ZO-1 pattern in control cultures (Figure 3 A, panels d and g). In contrast, this retinoid enhanced ZO-1 location at the cell borders in LT (Figure 3 A, panels e and h, arrows). Similar results were observed in HT (Figure 3 A, panels f and i, arrows). Western blot analysis confirmed the findings obtained with confocal microscopy. In LT and HT, ATRA increased the ZO-1 expression in the membranous fraction (panel B). In control cultures, this retinoid did not induce changes.
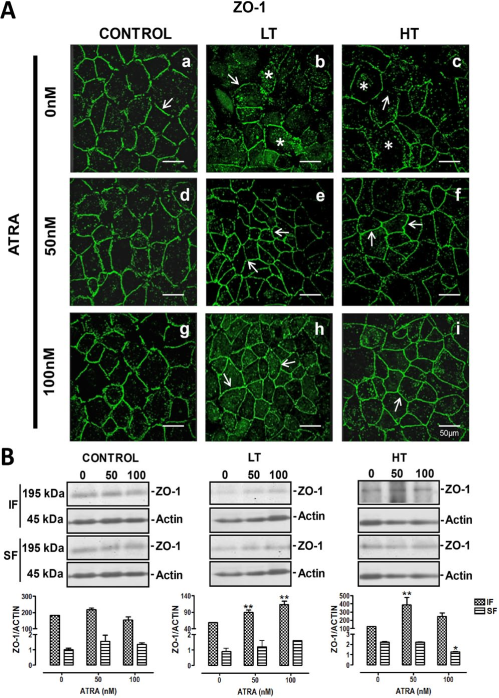
ATRA improved location of ZO-1 in LT and HT. Panel A. Immunofluorescence for ZO-1 in control, LT and HT human peritoneal mesothelial cells grown until confluence in the presence of ATRA 0, 50 and 100 nM. The cell contour is outlined by continuous label in control cultures (a, arrow). The fluorescence in LT and HT (b and c, respectively) is weak and discontinuous (arrows). ZO-1 label was also observed in cytoplasm (asterisks). Fluorescence increased and became continuous at the cell border when LT (e and h, arrows) and HT (f and i, arrows) were treated with ATRA. Panel B. Western blot analyses of soluble (cytosolic fraction, SF) and insoluble (membranal fraction, IF) ZO-1 fractions. Under basal conditions LT and HT express less ZO-1 compared to control, being more evident in LT. In control cultures, ATRA did not have an effect on the ZO-1 expression, while in LT and HT cultures, it incremented the amount of ZO-1 in the insoluble fraction. Mean±SEM of three experiments, from three different patients. **P<0.01 and *P<0.05 vs group without ATRA. Bar = 50 μm. ATRA = all-trans retinoic acid; LT = low transporter; HT = high transporter; IF = insoluble fraction; SF = soluble fraction; SEM = standard error of the mean.
Claudin-2 is Located at Nuclei
In control HPMCs, label for claudin-2 did not show the typical “chicken fence” pattern. This protein was observed at nuclei (Figure 4, panel a, white arrows). This was confirmed by co-localization between claudin-2 and nuclei label (Figure 4, panel c). LT and HT exhibited the same claudin-2 pattern observed in control cells (Figure 5 A, panels b and c). All-trans retinoic acid did not modify the claudin-2 localization in these groups (Figure 5A). Western blot analysis showed that claudin-2 was also present in the insoluble fraction (membranal fraction) of control, LT and HT cells. Expression of claudin-2 in the insoluble and soluble fractions was similar among groups. All-trans retinoic acid treatment did not alter the expression of this protein in any group (Figure 5B).
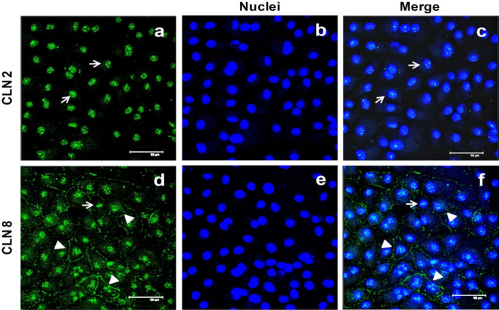
Immunofluorescence for claudin-2 and -8 in human peritoneal mesothelial cells (HPMCs). In HPMCs, claudin-2 was located at nuclei (panel a). Co-localization between claudin-2 and nuclei (panel c) corroborated it. Fluorescence for claudin-8 was observed along the cell contour (arrowheads) and at nuclei (arrow). Representative image of three experiments, from three different patients. Bar = 50 μm. CLN = claudin.
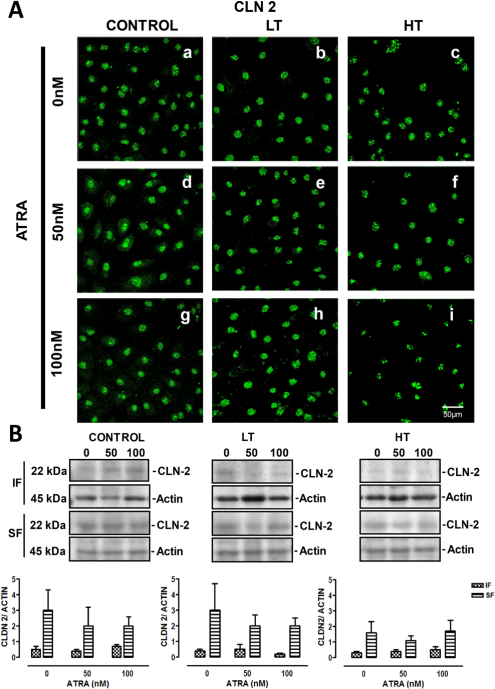
Panel A. Immunofluorescence for claudin-2 in control, LT and HT human peritoneal mesothelial cells (HPMCs) grown until confluence in the presence of ATRA 0, 50 and 100 nM. Claudin-2 was located at nuclei in control, LT and HT cultures (a, b and c, respectively). ATRA treatment did not modify the distribution of claudin-2 in these groups. Panel B. Western blot analyses showed that claudin-2 was also present in the insoluble (membranal fraction). Claudin-2 expression was similar among groups. ATRA treatment did not have an effect on claudin-2 expression in control, LT and HT cultures. Mean±SEM of three experiments, from 3 different patients. CLN = claudin; ATRA = all-trans retinoic acid; LT = low transporter; HT = high transporter; IF = insoluble fraction; SF = soluble fraction; SEM = standard error of the mean.
Atra Improved Claudin-8 Distribution at the Cell Border
In control cells, claudin-8 was at the cell border, as a thin continuous line (arrowheads), and at nuclei (arrow), (Figure 4, panel d). In LT and HT cultures, the fluorescence at the cell border was faint (Figure 6 A, panels b and c, respectively), but perinuclear regions showed marked fluorescence (arrow). All-trans retinoic acid improved claudin-8 distribution at the cell border in control cells (Figure 6 A, panels b and c). In LT and HT, the same effect was observed, being more notable at 50 nM (Figure 6 A, panels e and f, respectively). Western blot analysis showed that claudin-8 expression, in the insoluble and soluble fractions, was similar among control, LT and HT. All-trans retinoic acid did not induce changes in the expression of claudin-8 in control and LT, while in HT a non significant tendency to decrease was observed (Figure 6B).
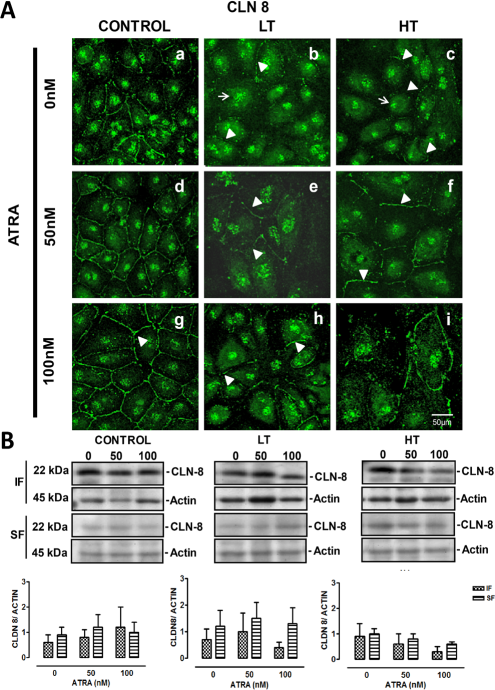
Panel A. Immunofluorescence for claudin-8 in control, LT and HT human peritoneal mesothelial cells grown until confluence in the presence of ATRA 0, 50 and 100 nM. Panel A. In control cells, claudin-8 was located at the cell border and at nuclei (a). In LT (b) and HT (c), this label was at nuclei (arrows) and almost absent at the cell border (arrowheads). Control cells treated with ATRA showed a best organization of claudin-8 at the cell border (observing the typical “chicken fence” pattern, d and g), compared to the group without ATRA (a). This effect was concentration-dependent. In LT and HT, ATRA had the same effect, being more evident at 50 nM (e and f, respectively). Panel B. Western blot analysis showed that claudin-8 expression, in the insoluble and soluble fractions, was similar in control, LT and HT. ATRA treatment did not have an effect on claudin-8 expression in control and LT, while in HT a non-significant tendency to decrease was observed. Mean±SEM of three experiments, from 3 different patients. CLN = claudin; ATRA = all-trans retinoic acid; LT = low transporter; HT = high transporter; IF = insoluble fraction; SF = soluble fraction; SEM = standard error of the mean.
Transepithelial Electrical Resistance of HPMCs from Patients in CAPD with LT OR HT
Water and solute transport in mesothelium during dialysis occurs mainly through the paracellular route. The permeability through this route is evaluated by the measurement of TER: the lower the resistance, the higher the permeability, and vice versa. We measured mesothelial TER in cells from these patients and from non-uremic individuals. There were no significant differences in TER values between control and LT (11 ± 0.9 and 9 ± 0.7 Ω•cm2, respectively, Figure 7), while in HT cultures it was lower (6 ± 1.1 Ω•cm2, Figure 7).
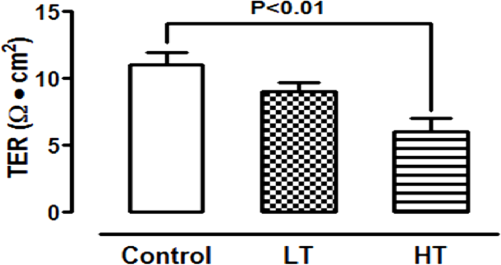
As expected, HT showed the lowest TER. Comparison of the TER among HPMCs from control and patients in CAPD with LT or HT. TER of monolayers cultured on a polyester membrane support (3 μm, pore size) until confluence. There were no significant differences in TER values between control and LT, while in HT cultures TER value was the lowest. Mean±SEM of six experiments in duplicate, from 6 different patients. P<0.01 compared to control group. LT = low transporter; HT = high transporter; TER = transepithelial electrical resistance; CAPD = continuous ambulatory peritoneal dialysis; SEM = standard error of the mean.
Retinoic Acid Effect on the Transepithelial Electrical Resistance of HPMCs from Patients in CAPD
There was a reduction in the TER in control (from 11 ± 0.9 to 3 ± 1.0 Ω•cm2 with ATRA 50 nM and to 4 ± 2.4 Ω•cm2 with ATRA 100 nM) and in HT (from 6 ± 1.1 to 4 ± 0.7 with ATRA 50 nM and to 4 ± 2.5 Ω•cm2 with ATRA 100 nM), when cultures were grown in the presence of retinoid (Figure 8, panels A and C). In contrast, in LT, ATRA treatment did not modify the TER, but it lead to an earlier establishment of TER compared to the cultures that did not receive the retinoid (Figure 8, panel B).
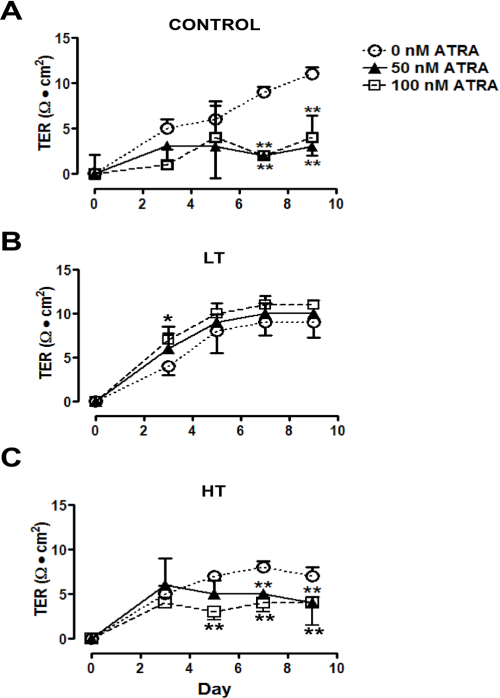
ATRA decreased TER in control and HT. Time-course of the development of the TER in HPMC monolayers from control and patients with LT or HT, cultured until confluence in the presence of ATRA 0 (empty circles), 50 (filled triangles) and 100 nM (empty squares). ATRA treatment decreased TER in control (A) and HT (C) cells, while in LT (B) it did not have an effect on the TER. Mean±SEM of three experiments in duplicate, from three patients are shown. *P<0.05; ** P<0.01, compared to group without ATRA. ATRA = all-trans retinoic acid; LT = low transporter; HT = high transporter; HPMC = human peritoneal mesothelial cell; SEM = standard error of the mean.
Discussion
Continuous ambulatory peritoneal dialysis is a conventional treatment for end-stage renal failure. Solute transport and ultrafiltration rates vary largely among patients. Patients with low transport (LT) exhibit insufficient small solute clearances whereas high transporters (HT) show insufficient fluid removal (2). Since human peritoneal mesothelial cells (HPMCs) act as one of the barriers to the transport of small and large solutes from the capillary lumen into the peritoneal cavity, damage to them might be related to loss of peritoneal membrane function. Human peritoneal mesothelial cells possess different types of intercellular junctions, including TJs, that regulate the passage of molecules through the paracellular pathway (12). Claudins are the major component of the TJ strands and constitute a family of more than 20 proteins (13,35). In the present study, we explored the expression and distribution of claudin-1, occludin and ZO-1, in LT and HT cultures and for the first time the expression of claudin-2 (channel former) and claudin-8 (barrier builder) in HPMCs. In basal conditions, HPMCs express claudin-2 (nuclear) and claudin-8. The distribution pattern of claudin-8 was very faint along the cell contour and discontinuous. However, the presence of abundant claudin-8 into the TJ in our cultures was not expected, since this claudin is usually located in tighter epithelia.
High glucose concentration contained in dialysis solutions, as well as glucose degradation products, hyperosmolality and glucose-stimulated increase of transforming growth factor-β1 and reactive oxygen species, are factors that damage the intercellular junctions of HPMCs (16,24,25,36). Low pH of dialysis solutions is another harmful factor that damages the peritoneum (37). It has been suggested that use of dialysis solutions containing icodextrin, glucose or polyether polymer as osmotic agent, instead of glucose, and bicarbonate to neutralize acid pH diminish this damage (38-40). In addition to dialysis solutions, uremia causes morphological damage to peritoneum, even in patients who were not undergoing peritoneal dialysis (41-43). Vaziri et al. (2012) reported that uremic serum damages the intestinal TJ (claudin-1, occludin and ZO-1), in rats (44). Our cultures were obtained from patients undergoing CAPD and, as expected, both LT and HT showed damage to their TJ proteins such as delocalization from the intercellular space and decrease in their protein content. Damage was observed even in cultures in passage three, showing that the LT or HT phenotype was preserved in culture cells from uremic individuals. This is an important issue since these cells were grown in the absence of exposure to dialysis solutions or to uremic milieu. It is interesting to note that LT cultures showed intervariability in the ZO-1 staining, some of the cells were highly positive for ZO-1, whereas other cells did not show staining. Mesothelial cell cultures from effluents from patients undergoing continuous ambulatory peritoneal dialysis (CAPD) had markedly varied morphologic features, ranging from a cobblestone-like appearance (similar to omentum-derived mesothelial cells) to fibroblast-like cells or mixed cell populations (45). The prevalence of nonepithelioid cells appears to be related both to the duration of CAPD and whether peritonitis had occurred (46). Mesothelial cells undergo epithelial to mesenchymal transition during CAPD (46). Although it was not statistically significant, LT had more time on dialysis compared to HT. Moreover, in the LT group most of the patients had experienced peritonitis previous to the study. Therefore, it is probable that LT cultures had a mix of cells with an epithelial phenotype and cells undergoing a transition from an epithelial phenotype to a mesenchymal phenotype, which would explain why some cells in this group were positive for ZO-1 staining and others not.
Permeability of the paracellular pathway was evaluated by measurement of TER. Transepithelial electrical resistance increases with the degree of tightness of TJ and vice versa. Transepithelial electrical resistance values suggested that HT monolayers were more permeable than LT, since they exhibited low TER compared to LT, which is in agreement with the high permeability depicted by patients with high peritoneal transport. Transepithelial electrical resistance reflects functional integrity of intercellular junctions in various cell types (47-49). In HPMCs, reduction in the TER induced by H2O2 was accompanied by delocalization of the TJ (17,18). LT and HT exhibited similar TJ damage, being more pronounced in LT, in spite of having different TER. This would suggest the presence of different pores for anions and cations in LT and HT. It is likely that other unexplored claudins that participate as ion channels (claudin-10 or -15) or barrier builders (claudin-3,-4,-5,-11,-14 and -19) (50-52) may be regulating the overall ion conductance in these cultures.
All-trans retinoic acid regulates critical genetic programs that control development and homeostasis, cell proliferation and differentiation, as well as death and survival (53). All-trans retinoic acid exerts its functions by regulating gene expression through nuclear receptors, the retinoic acid receptor (RAR) and their heterodimeric counterparts, retinoid X receptors (RXR) which are composed of three subtypes (α, β and γ) (54). There are reports that document the function of ATRA in TJ formation (28,30,55-57). In this study, we investigated the effect of ATRA on the distribution and expression of TJ components in HPMCs. Treatment with ATRA improved the organization at the cell border of claudin-1 and -8, occludin and ZO-1, in LT and HT cells, but in claudin-2 distribution it did not have any effect. Furthermore, ATRA increased the expression of claudin-1, occludin and ZO-1 in HT cultures, whereas in LT only ZO-1 expression was enhanced. Retinoic acid did not modify the claudin-2 and -8 expressions in any group. Findings indicated that ATRA can improve TJ distribution and/or increase their level of expression, depending on the type of cell and the claudin isoform. Tight junctions are highly dynamic structures whose degree of sealing is regulated by phosphorylation. Tight junctions are associated with diverse signaling cascades such as G proteins, kinases and phosphatases. Phosphorylation of the TJ components, claudins, occludin and ZO-1 proteins impacts epithelial and endothelial cell function (13). Mitogen-activated protein kinases (MAPKs) are involved in TJ regulation (13). p38 is one member of the MAPKs family. In HPMCs, the inhibition of p38 pathway led to E-cadherine and ZO-1 disorganization (58). Retinoic acid induces the rapid activation of p38MAPK through RARα pool, present in membrane lipid rafts (59). The effect of ATRA on the TJ distribution in LT and HT might be mediated by the p38 pathway. However, in the present study we did not examine this particular issue and further experiments are necessary to clarify it.
All-trans retinoic acid regulates TJ resistance in various cell types (29-32). Tobioka et al. (1996) reported that ATRA increased TER in rat peritoneal mesothelial cells (47). Our results showed that ATRA decreased the TER in control and HT, but it did not affect the TER in LT. The TER reduction induced by ATRA has also been observed in Caco-2 cells and CaSki cells (human cervical cells) (31,56). It is noteworthy that Tobioka et al. used a much higher ATRA concentration (100 μM) than the one we used (100 nM). The difference in response might be associated with variation of the species (human in this study, and rat in the Tobioka report), suggesting that human cells are more sensitive than those of rats to ATRA. Horiuchi el al. (2009) reported differences in sensitivity to H2O2 between human peritoneal cells and human umbilical vein endothelial cells (18). These data suggest possible variations in cell responses depending on the organ from which they were obtained, in spite of being from the same species.
Beneficial ATRA effects on TJ distribution and expression, and the TER, varied in LT and HT cultures. All-trans retinoic acid effects are mediated through nuclear receptors (28) and disruptions of retinoid signaling due to mutations in RARα and RXRs have been shown to be associated with disorganization of the epithelial architecture, such as that observed in cancer tissues (60). Moreover, Chung et al. (2010) reported that retinoic acid receptor alpha- deficient mice exhibited a delay in the incorporation of ZO-1, into the Sertoli cells TJ (61). All-trans retinoic acid effects also depend on the balance between its synthesis and metabolism (62), and its bioavailability (29). Bioavailability in turn depends on vitamin A transport and distribution, which are mediated by a group of specific binding proteins: retinol binding protein (RBP), which transports retinol from the liver to target cells; cellular RBP and cellular retinoic acid-binding protein, both of which are found within cells (63,64). The importance of vitamin A/carrier complexes as markers of bioavailability has been demonstrated. Aguilera et al. (2002) reported that although vitamin A is increased in the plasma of dialysis patients, intracellular and clinical signs of hypovitaminosis are frequently found (65). This is due to a low expression of RBP, a protein sensitive to zinc and protein deficiency, in these patients. If the supply of these nutrients is low, patients may show signs of vitamin A deficiency, although their ingesta is adequate. Therefore, the different responses observed in LT and HT to ATRA treatment in these patients might be due to differences in the expression and function of molecules involved in ATRA signaling pathway or in ATRA bioavailability.
This is the first study that analyzes HPMCs from patients with LT or HT. Our results showed that LT and HT exhibited different permeability that was in agreement with the peritoneal permeability depicted by patients from which cells were obtained. This is an important issue since we show that cells preserved their phenotype in culture. They also depicted a differential response to ATRA treatment. These findings suggest that these cultured cells are suitable for further studies to be performed to characterize the barrier function in LT and HT, and to study the expression and function of the ATRA signaling components in these cells. All-trans retinoic acid might be a therapeutic alternative to maintain the mesothelial integrity in dialysis patients, since we showed that ATRA improved the localization and expression of TJ proteins, which is relevant to maintain the cellular polarity and function of peritoneum.
Footnotes
Acknowledgments
The authors gratefully acknowledge the technical support provided by Nicolas Corona, MD, Veronica Sanchez, MD, Dora Aguilar, MD, Rafael Rodriguez, PhD, and nurses Juana Cortez, Maria Escudero, Concepcion Garcia and Yolanda Calva. This study was partially supported by Consejo Nacional de Ciencia y Tecnologia (CONACYT), Mexico (Grant 0179870). Carmen Retana is the recipient of a postgraduate fellowship from CONACYT (176602).
The authors have no financial conflicts of interest to declare.