
Abstract
♦ Background
Interventional trials failed to demonstrate that increasing urea clearance improved peritoneal dialysis (PD) patient survival. Hyperphosphatemia is a well- recognized predictor of cardiovascular and all-cause mortality in PD patients. Simplification of PD small solute clearance targets focuses away from larger solutes, including phosphate. In the US and UK, increasing use of automated peritoneal dialysis (APD) cyclers with shorter dwell times could also potentially reduce peritoneal phosphate removal compared to continuous ambulatory peritoneal dialysis (CAPD).
♦ Methods
Total phosphate and peritoneal phosphate clearances were measured in a prospective observational cohort of 380 adult PD patients attending a tertiary university hospital between 1996 and 2013 for routine assessment of PD adequacy.
♦Results
Eighty-seven patients (22.9%) were hyperphosphatemic. Taking the mean 4-hour dialysate to plasma (D/P) ratio for phosphate, 193 (50.8%) were fast and fast-average transporters and 187 (49.2%) were slow and slow-average transporters (compared to 276 [72.6%] and 104 [27.4%], respectively, for peritoneal creatinine transporter status). Faster peritoneal phosphate transporter status was associated with over-hydration (odds ratio [OR] = 2.45 [1.43 – 4.20], p = 0.001). Whereas the 4-hour D/P creatinine and peritoneal weekly creatinine clearance did not differ between those who were hyperphosphatemic or not, the hyperphosphatemic patients had lower 4-hour D/P phosphate and lower peritoneal weekly phosphate clearance (p = 0.019, and p = 0.06 respectively). We found greater peritoneal phosphate clearance for patients choosing CAPD compared to APD, irrespective of the peritoneal phosphate transporter status.
♦ Conclusion
Peritoneal creatinine transporter status and creatinine clearance cannot be used as surrogate markers of peritoneal phosphate transport and clearance. Hyperphosphatemia was more common in PD patients with slower peritoneal transporter status and lower peritoneal phosphate clearance. Greater peritoneal phosphate clearance was achieved with CAPD prescriptions. Slower peritoneal transporters should be advised to choose CAPD to improve serum phosphate control.
Phosphate is predominantly an intracellular anion with a molecular weight of 96 Da, but as it is charged with a water shell, it behaves as a much larger molecule, and therefore diffuses much slower than expected simply from its molecular weight. More recently there has been a move to simplify PD solute clearance targets to be based on urea clearance alone and dispense with creatinine clearance (13). This may potentially have an adverse impact on the removal of larger solutes, including phosphate. In the US and UK, the introduction of cycler-based PD prescriptions has led to shorter dwell times, and the question arises as to whether this also has an impact on peritoneal phosphate clearance, particularly for the anuric patient. To understand the clinically relevant factors for phosphate clearance in PD patients, we examined total and peritoneal phosphate clearance in a contemporary cohort of PD patients.
Patients and Methods
Study Population
We audited 371 adult PD outpatients attending for routine assessment of PD adequacy and transport status. Patients were consecutively included from June 1996 to February 2013. Patients were treated with continuous ambulatory peritoneal dialysis (CAPD) or automated peritoneal dialysis (APD) with lactate-based low calcium (2.5 meq/L) glucose and 7.5% icodextrin solutions as standard of care (Baxter Health Care, Deerfield, IL, USA). This retrospective audit complied with the UK National Health Service guidelines for audit and clinical service development.
Study Parameters
Demographic (age at start of PD and gender), clinical (weight, height, past history of diabetes mellitus diagnosed on need for insulin or oral anti-diabetic therapy, phosphate binding prescription), biological parameters (serum phosphate and albumin levels) and C-reactive protein (CRP) and average time on PD and PD regimens were assessed. The Stoke-Davies comorbidity count was used (14) and grade of comorbidity was derived directly from this score: grade 0 (low risk) is a 0 score, grade 1 (medium risk) is a score of 1 - 2, and grade 2 (high risk) a cumulative score ≥ 3.
Multifrequency bioelectrical impedance analysis measurements were made after the patient had voided and with the dialysate drained out (InBody 720, Biospace, Seoul, South Korea) using tetrapolar 8-point tactile electrode) (15,16). Patients with amputations or cardiac pacemaker/defibrillator were excluded. We used an extra-cellular water (ECW)/total body water (TBW) ratio of > 0.4 to classify patients as increased ECW or normal ECW (17).
We divided patients into 2 groups according to estimation of RRF by calculating creatinine clearance (Cr Clear) in 24-hour urine (Cr Clear = creatinine concentration in 24-h urine x volume 24-h urine / creatinine concentration in plasma x 1,440 minutes, then corrected for 1.73 m2): those with Cr Clear < 2 mL/min (low RRF group) and patients with Cr Clear ≥ 2 mL/min (high RRF group).
A standard 2-L volume exchange, 2.27% 4-hour glucose peritoneal equilibration test (PET) was performed. Dialysate/plasma creatinine (D/P Cr) and phosphate (D/P Pi) ratios were derived from the 4-hour dialysate effluent with a corresponding serum sample. For phosphate transport status, the mean D/P Pi ratio was 0.63 ± 0.16. We then classified patients as slow (D/P Pi < 0.46), slow-average (0.47 ≤ D/P Pi < 0.62), fast-average (0.63 ≤ D/P Pi < 0.79), and fast (D/P Pi ≥ 0.80) phosphate transporters. Patients were also classified as slow, slow-average, fast-average, and fast transporters (18).
A 24-hour dialysate collection was performed (patients used their usual overnight dialysis regime) prior to the PET for all patients. For patients treated by CAPD, patients were asked to record the weights of each bag after both the “flush before fill” before instilling the fresh dialysate and then at the end of drainage of the spent dialysate. A sample of spent dialysate was taken from each CAPD effluent bag, analyzed separately, and 24-hour peritoneal phosphate removal was calculated for each individual exchange. For patients treated with cyclers, a single sample from the mixed dialysate was analyzed and phosphate removal calculated using the volume of peritoneal dialysate measured by the cycler. A corresponding 24-hour urine sample was analyzed for urea, creatinine, and phosphate. Standard parameters of dialysis adequacy were determined by measuring total (renal and peritoneal) weekly urea clearance (Kt/V), and liters of creatinine cleared by standard methods (L/week/1.73 m2) (18). Phosphate was measured by adding ammonium molybdate in the presence of sulfuric acid, to form ammonium phosphomolybdate complex, which was photometrically read in the ultra-violet region (340 nm) (Roche P module analyzer, Roche diagnostics Ltd, Rotkreuz, Switzerland), coefficient of variation for serum, peritoneal dialysate and urine ranged from 0.7 - 0.9%. Protein equivalent of nitrogen appearance normalized to body weight (nPNA) was calculated using methods described by Randerson et al. (19). Total 24-hour peritoneal ultrafiltration (24hUF, L/24 h) was also recorded as the difference between the volume instilled and that drained out.
Statistical Analysis
Results are given as means and standard deviation (SD), or as median and range according to their distribution. Differences between groups were evaluated using chi-squared test, Student's t-test or Mann-Whitney U-test, as appropriate, while correlations between variables were tested using Spearman rank correlation. Bland Altman analysis was used to compare peritoneal phosphate and creatinine clearances.
Multivariate analyses using logistic regression models were performed to analyze the determinants of hyperphosphatemic status, 4-hour D/P Pi (as categorical variable: fast and fast-average against slow and slow-average) and peritoneal weekly phosphate clearance > 30 L/kg/m2. Following independents, variables tested were considered as continuous variables: age, body surface area (BSA), vintage PD, serum albumin level, CRP, nPNA, and renal/peritoneal phosphate clearances. The following parameters were considered as categorical variables: male gender, diabetes mellitus, high RRF, hyperphosphatemic status, high ECW/TBW, APD modality and 4-hour D/P Pi (fast and fast-average against slow and slow-average) and long dwell time in PD regimen and 24-hour PD ultrafiltration (UF). A step back approach was taken, with removal of variables that were not statistically significant (p > 0.2). P < 0.05 was considered statistically significant. All data were evaluated using MedCalc Statistical Software version 12.7.2 (MedCalc Software bvba, Ostend, Belgium).
Results
Patient baseline characteristics are displayed in Table 1. Median PD vintage was 4 months (1 - 179). Patients were predominantly treated by APD (75%). Nineteen percent (n = 72) of patients had residual Cr Clear < 2 mL/min (Low RRF group). Eighty-seven patients (23%) were hyperphosphatemic (defined by a serum phosphate of ≥ 1.78 mmol/L).
Study Population: Baseline Characteristics a
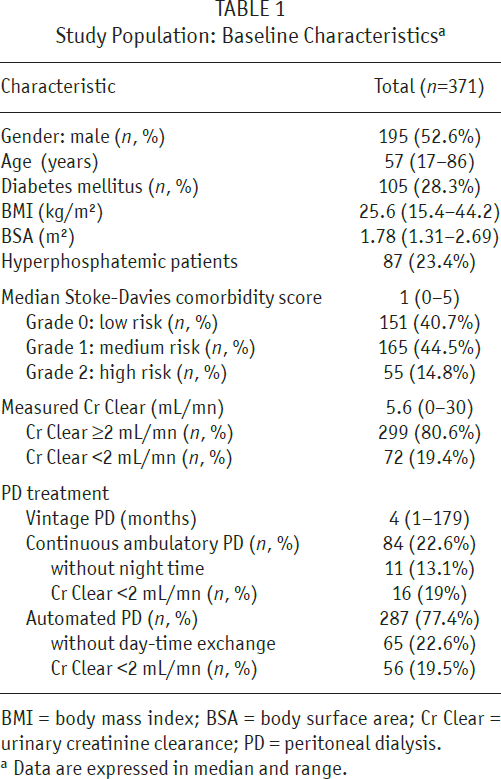
BMI = body mass index; BSA = body surface area; Cr Clear = urinary creatinine clearance; PD = peritoneal dialysis.
Data are expressed in median and range.
Serum Phosphate (Table 2)
Dialysis Adequacy, Phosphate Clearance, and Peritoneal Transport Status *
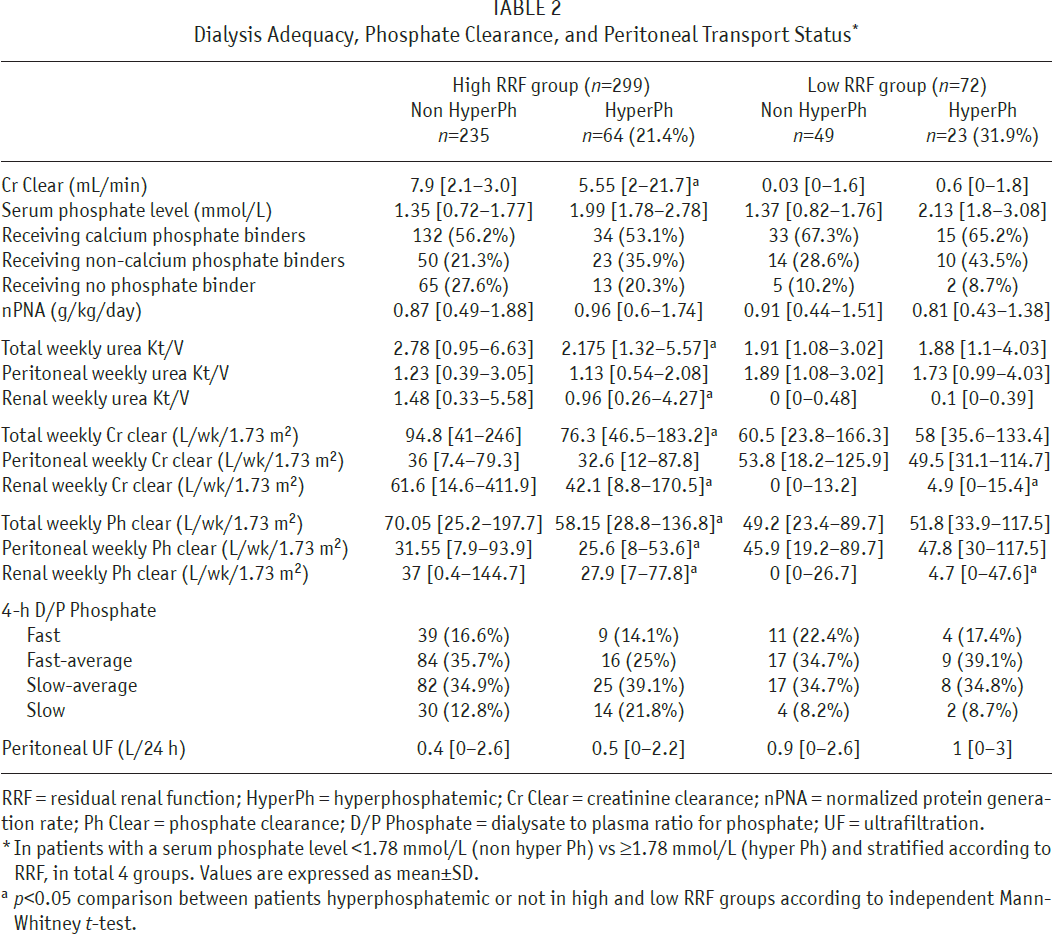
RRF = residual renal function; HyperPh = hyperphosphatemic; Cr Clear = creatinine clearance; nPNA = normalized protein generation rate; Ph Clear = phosphate clearance; D/P Phosphate = dialysate to plasma ratio for phosphate; UF = ultrafiltration. *In patients with a serum phosphate level <1.78 mmol/L (non hyper Ph) vs ≥1.78 mmol/L (hyper Ph) and stratified according to RRF, in total 4 groups. Values are expressed as mean±SD.
p<0.05 comparison between patients hyperphosphatemic or not in high and low RRF groups according to independent Mann-Whitney t-test.
There were no differences in Stoke-Davies comorbidity grades between the non-hyperphosphatemic and hyperphosphatemic patients: patients were grade 1 in 41.2% vs 39.1%, grade 2 in 44% vs 46%, and grade 3 in 14.8 vs 14.9% respectively.
Calcium-based phosphate binders were prescribed in 56.3% of hyperphosphatemic patients, compared to 58% non-hyperphosphatemic patients (p = 0.7), non-calcium based phosphate binders in 37.9% vs 22.5% (p = 0.004), active vitamin D (cholecalciferol) prescription 87.5% vs 83% (p = 0.3), and cinacalcet to 3.3% vs 1.6% (p = 0.4), respectively. Eighty-five patients (23%) were not prescribed phosphate binders (17.2% of hyperphosphatemic patients vs 24.6% of non-hyperphosphatemic patients, p = 0.007). Serum phosphate concentration was negatively correlated with RRF as determined by residual Cr Clear (r = -0.24, p < 0.0001). Hyperphosphatemia was more prevalent in the low RRF group: 31.9% vs 21.4% in high RRF group (p = 0.05). Among the high RRF group, those with hyperphosphatemia had also significant lower residual Cr Clear: 5.5 (2.0 – 21.7) vs 7.9 (2.1 – 30) mL/min, respectively, p < 0.001 and correspondingly lower renal phosphate clearance (p = 0.01).
On logistic regression analyses, multivariate analyses showed that higher serum phosphate concentrations were associated with both lower renal and peritoneal phosphate clearances (residual renal function: r = -1.31, p < 0.0002, and peritoneal clearance: r = -0.032, p = 0.002 respectively). High serum phosphate concentration was also independently associated with higher nPNA (r = 1.09, p = 0.03).
Peritoneal Phosphate Transport Status
Mean 4-hour D/P ratio was 0.63 ± 0.16 for phosphate and 0.72 ± 0.13 for creatinine. Based on peritoneal phosphate transport, taking the mean and standard deviations (SD), 63 patients (17%) were classified as fast transporters (> 1 SD above the mean), 126 (34%) as fast-average transporters (< 1 SD above the mean), 132 (35.6%) as slow-average transporters (<1 SD below the mean), and 50 (13.4%) as slow transporters (>1 SD below the mean). We observed no correlation between 4-hour D/P Pi and PD treatment vintage (r = -0.03, p = 0.52). In terms of peritoneal creatinine transport, 97 patients (26.2%) were classified as fast transporters, 173 (46.6%), as fast-average transporters, 84 (22.6%) as slow-average transporters and 17 (4.6%) as slow transporters. There was a positive correlation between 4-hour D/P Pi and D/P Cr (r = 0.78, p < 0.0001). However, when patients were divided according to transporter status, we observed a higher proportion of slow, slow-average transporters and a lower proportion of fast, fast-average transporters for phosphate compared to creatinine when comparing 4-hour D/P Pi to D/P Cr (Figure 1).
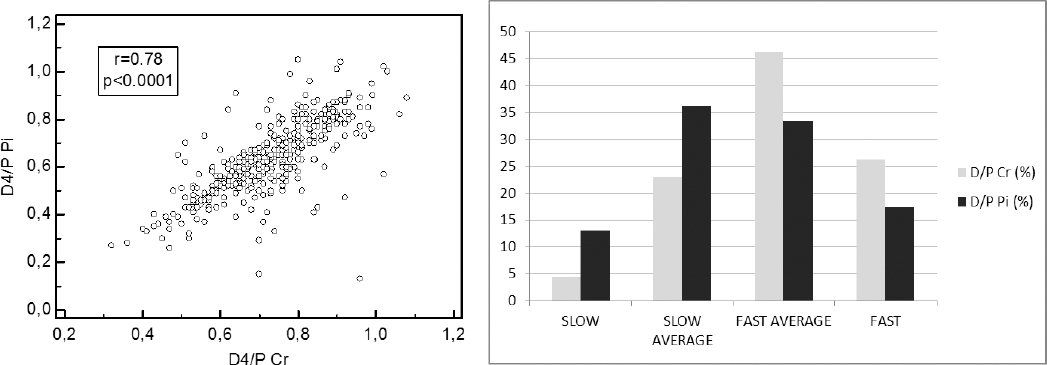
Mean 4-hour D/P Phosphate (Pi) and D/P Creatinine (Cr) according to 4 categories of peritoneal phosphate and creatinine transport status. D/P Cr = dialysate to plasma ratio for creatinine; D/P Pi = dialysate to plasma ratio for phosphate.
In the low RRF group, 31 (43%) patients were classified as slow, slow-average transporters for phosphate (4-hour D/P Pi) vs 15 (21%) slow, slow-average peritoneal transport status for creatinine (D/P Cr). However, there was no difference in the percentage of patients with hyperphosphatemia according to phosphate transport status (Table 2).
Comparing patients according to whether they were hyperphosphatemic or achieved serum phosphate targets, the 4-hour D/P Cr and peritoneal weekly creatinine clearance did not differ between the groups; hyperphosphatemic patients had both lower 4-hour D/P Pi and peritoneal weekly phosphate clearance (p = 0.05, and p = 0.02, respectively) (Table 3).
Comparison Between Hyperphosphatemic (≥1.78 mmol/L) and Non-Hyperphosphatemic (<1.78 mmol/L) Patients a
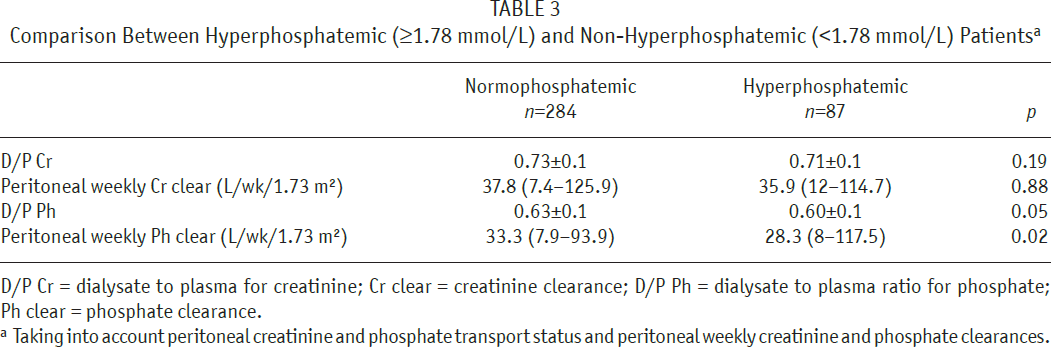
D/P Cr = dialysate to plasma for creatinine; Cr clear = creatinine clearance; D/P Ph = dialysate to plasma ratio for phosphate;
Ph clear = phosphate clearance.
Taking into account peritoneal creatinine and phosphate transport status and peritoneal weekly creatinine and phosphate clearances.
In a logistic regression analysis comparing fast and fast-average phosphate transporters against slow and slow-average phosphate transporters, univariate analysis showed an association between 4-hour D/P Pi transport status and CRP, nPNA and increased ECW/TBW. There was no statistical association with weight, BSA, sex or age. On multivariate analysis, only increasing ECW/TBW was independently associated with faster transport phosphate status (odds ratio = 2.24 [1.27 – 3.95], p = 0.005).
Peritoneal Weekly Phosphate Clearance
The association between peritoneal weekly phosphate clearance and peritoneal weekly creatinine clearance (r = 0.8, p < 0.0001) was greater than that for peritoneal weekly urea Kt/V (r = 0.7, p < 0.0001). We observed a similar correlation between peritoneal weekly phosphate clearance and 4-hour D/P Pi and 4-hour D/P Cr (r = 0.5, p < 0.0001).
Comparison between low and high RRF groups according to their phosphatemic status showed that the Low RRF group had significant increased peritoneal urea, creatinine, and phosphate clearances and 24-hour peritoneal UF compared to the high RRF group, to compensate for lack of urinary clearance. The differences in PD phosphate and creatinine clearances, according to serum phosphate status, are shown in Table 3.
Investigating the effect of PD modality, peritoneal weekly phosphate clearance was increased in CAPD vs APD patients: 41.4 (14.8 – 76.9) vs 29.8 (7.9 – 117.5) L/kg/1.73 m2 (p < 0.0001). Comparing fast, fast-average to slow, slow-average peritoneal transporters, peritoneal phosphate removal was still significantly increased for CAPD patients (Table 4).
Peritoneal Phosphate Clearance According to Peritoneal Phosphate Transport Status in Patients in APD and CAPD a
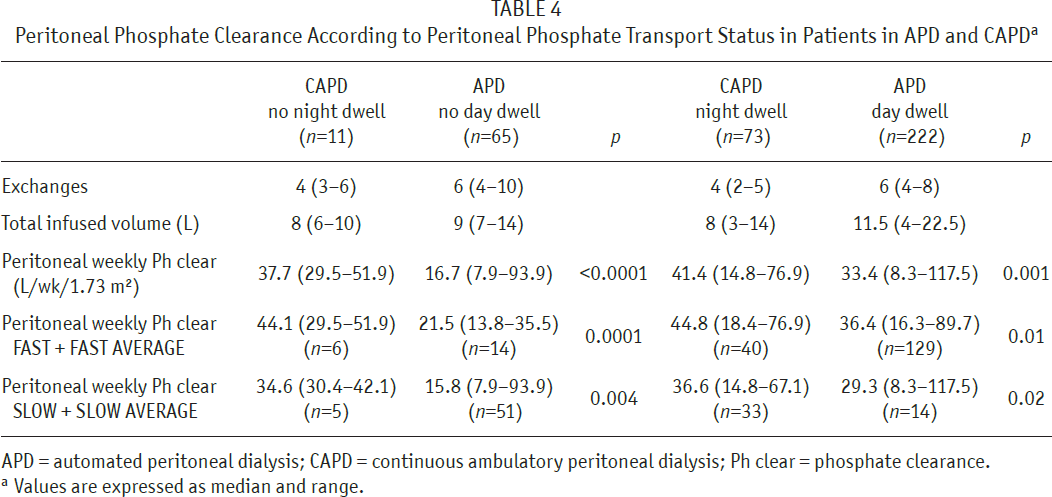
APD = automated peritoneal dialysis; CAPD = continuous ambulatory peritoneal dialysis; Ph clear = phosphate clearance.
Values are expressed as median and range.
Although serum phosphate did not differ: 1.55 ± 0.39 vs 1.51±0.4 mmol/L, and with similar 24-hour urine phosphate excretion: 7 (3.6 – 10.2) vs 6.1 (2.0 – 10.4) mmol/day, CAPD patients had significantly greater peritoneal phosphate losses: 8.0 (5.7 – 10.9) vs APD cycler therapy 6.5 (4.4 – 9.2) mmol/day, p < 0.05.
Median weekly PD phosphate clearance was 32 (3.9 – 117.9) L/kg/1.73 m2. In a logistic regression analysis to determine which factors influenced peritoneal weekly phosphate clearance above 30 L/kg/m2, multivariate analysis showed a negative association with APD modality, high RRF, and hyperphosphatemic status. Peritoneal phosphate removal above 30 L/kg/m2 was associated with PD vintage, increased age, high ECW/TBW, faster peritoneal phosphate transport status, long dwell time in PD regimen, and higher 24-hour PD UF (Table 5).
Univariate and Multivariate Analysis of Determinants of Higher Peritoneal Phosphate Removal a
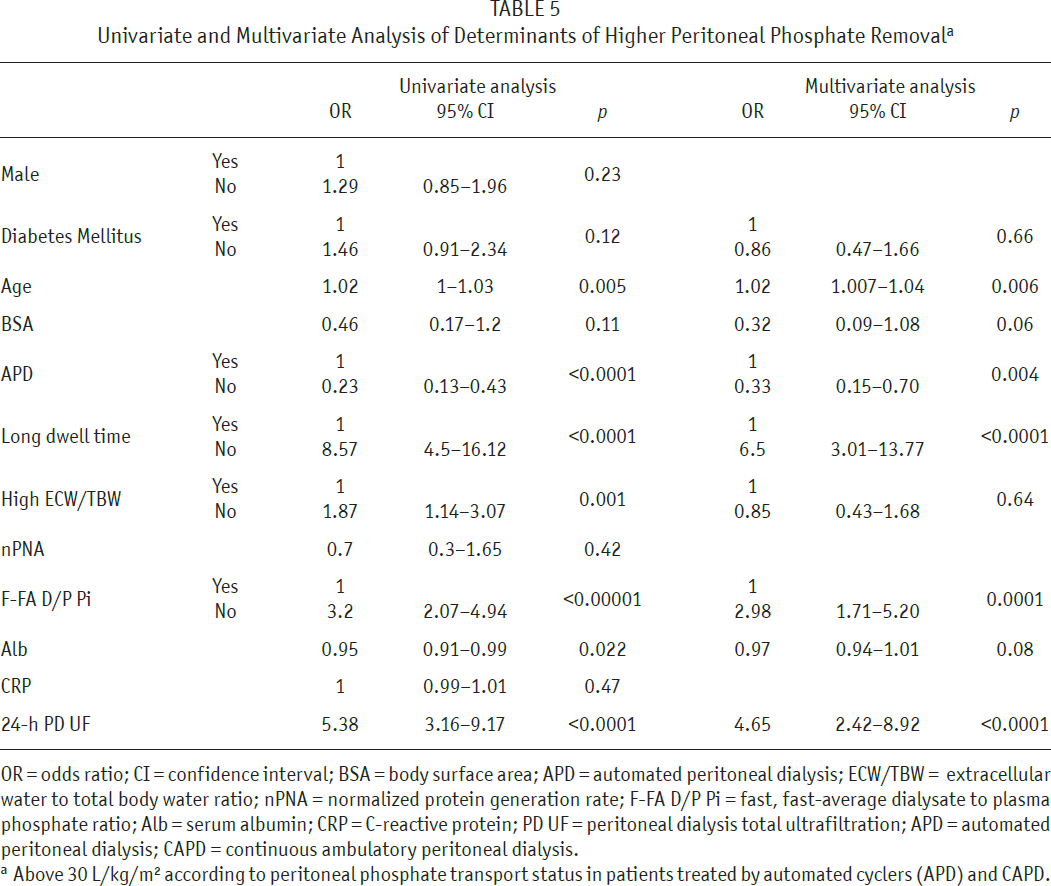
OR = odds ratio; CI = confidence interval; BSA = body surface area; APD = automated peritoneal dialysis; ECW/TBW = extracellular water to total body water ratio; nPNA = normalized protein generation rate; F-FA D/P Pi = fast, fast-average dialysate to plasma phosphate ratio; Alb = serum albumin; CRP = C-reactive protein; PD UF = peritoneal dialysis total ultrafiltration; APD = automated peritoneal dialysis; CAPD = continuous ambulatory peritoneal dialysis.
Above 30 L/kg/m2 according to peritoneal phosphate transport status in patients treated by automated cyclers (APD) and CAPD.
To determine whether peritoneal creatinine clearance could be used as a surrogate for peritoneal phosphate clearance, we compared clearances, and as expected, there was a bias for increased peritoneal creatinine clearance compared to phosphate (Figure 2). However, neither RRF nor peritoneal phosphate transport status had any effect on the bias between peritoneal creatinine and phosphate clearances.
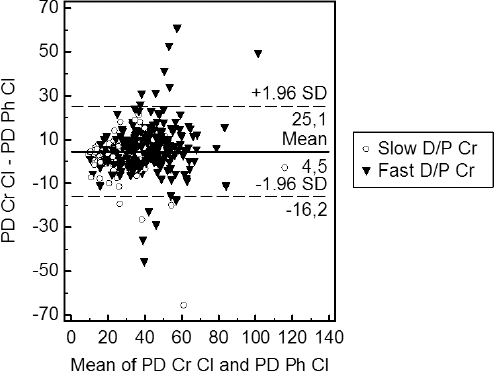
Bland Altman plot peritoneal creatinine clearance and peritoneal phosphate clearance. PD Cr Cl = peritoneal dialysis creatinine clearance; PD Ph Cl = peritoneal dialysis phosphate clearance; D/P Cr = dialysate to plasma ratio for creatinine.
Discussion
Hyperphosphatemia is a recognized risk factor for mortality for PD patients (20). As such, it is important for PD patients to achieve serum phosphate targets. Phosphate balance varies between patients and is complex, depending upon dietary phosphate intake with patients advised to restrict dietary phosphate intake whilst at the same time maintaining adequate dietary protein intake to prevent malnutrition, compliance with phosphate binders, and then phosphate clearance by RRF and peritoneal phosphate removal. Thus, dialytic phosphate clearance makes an important contribution to serum phosphate control and should be monitored. Anuric PD patients are recognized as having worse survival and phosphate balance compared to those with RRF (21).
Hence, a greater understanding of peritoneal phosphate clearance is required to optimize PD prescriptions, to improve phosphate removal and to achieve recommended serum phosphate targets.
There have been a number of smaller studies reporting on peritoneal transporter status and phosphate clearance, with some reporting no effect (22) and others observing an effect only for anuric slow transporters (23,24). We studied a much larger cohort of patients and found a significant effect of peritoneal transporter status on peritoneal phosphate clearance, with a strong correlation between the 4-hour D/P Pi and D/P Cr, using a standard 2.27% glucose exchange. A minority (27.4%) of our cohort were slow or slow-average transporters, and for those with low RRF, significantly more were hyperphosphatemic compared to those with faster transport characteristics. The differences reported in earlier smaller cohort studies most likely reflect differences in terms of patient transporter characteristics and RRF.
It has been suggested that the 4-hour D/P creatinine and peritoneal creatinine clearance could be used as surrogates for phosphate clearance. However, our study showed that creatinine transporter status and peritoneal clearance were not simple surrogates for peritoneal phosphate transport status and clearance, and overestimated clearances, particularly for those patients treated with cycler prescriptions, supporting an earlier observation in a small pediatric cohort (25). As such, it is important to optimize peritoneal phosphate clearance, particularly for anuric patients with slower peritoneal transport status. This requires 4-hour D/P Pi and peritoneal phosphate clearances to be measured to guide PD prescriptions rather than simply relying on 4-hour D/P Cr and peritoneal creatinine clearance (25).
We observed that 4-hour D/P Pi categories were not influenced by sex, BSA, or systemic inflammation, but were only independently associated with an increased ECW/TBW ratio. Although a raised ECW/TBW ratio could be due to a loss of cell mass and intracellular water, it is most likely that the increased ECW/TBW is secondary to extracellular water expansion, as patients characterized by faster peritoneal phosphate transport are more likely to be clinically diagnosed with fluid retention. Indeed, there is a recognized association between faster peritoneal transport and volume overload, as rapid solute transport leads to earlier dissipation of the osmotic gradient required for convective fluid removal (26,27). Left ventricular hypertrophy and hypertension are also more commonly reported in fast transporters, and both are associated with intravascular volume overload. We were unable to demonstrate any association between faster peritoneal transport and CRP or albumin, markers of systemic inflammation, although this does not exclude local inflammatory changes within the peritoneal cavity and faster peritoneal phosphate transport in our cohort (28).
As expected, our study showed that peritoneal phosphate clearance is more closely associated with peritoneal creatinine clearance than urea clearance. Kinetic modeling in a small number of patients suggested that diffusion is the major determinant of peritoneal phosphate clearance through endothelial transmembrane phosphate transporters, aided by some additional convective transport, but with no appreciable lymphatic transport. These differences in basic cellular transport help explain the marked heterogeneity of phosphate and 4-hour creatinine equilibration ratios observed with the PET. As a consequence of this differential transport kinetics, the peritoneal transporter state defined by the creatinine equilibration pattern is poorly predictive of daily phosphate clearances (25).
There has been debate as to whether the choice of PD modality affects phosphate clearance in clinical practice, with several smaller studies suggesting no or minimal effect (22,29). However in our study, the choice of PD modality was a significant determinant of peritoneal phosphate clearance with superior peritoneal phosphate clearance associated with treatment with CAPD, irrespective of the 4-hour D/P Pi transport status. Peritoneal phosphate removal could be achieved by increasing the volume of dialysate infused and dwell times. For patients treated with cycler regimes, in addition to the effect of peritoneal transport characteristics, dialytic clearance in APD is a function of the number, volume, and duration of dialysis cycles, and in particular the addition of daytime exchanges.
In the UK, as in the US, around two-thirds of PD patients are treated with APD. Patient preference and lifestyle are the most common indications to choose APD as a PD modality, and many slow-average and slow transporters are treated with APD and achieve clinical guideline targets for weekly Kt/V urea and ultrafiltration with this modality. As there is typically a high turnover of PD patients in both the US and UK, due to peritonitis (30) and transplantation, it would be difficult to establish a causal link between reduced peritoneal phosphate clearance and patient survival. However, as peritoneal phosphate clearance is slower than that of urea and creatinine, we would suggest peritoneal phosphate clearance should be taken into account particularly for those patients choosing APD cyclers, particularly for the anuric slow peritoneal transporter.
Our study contributes to the understanding of peritoneal phosphate clearance. Creatinine is an inadequate surrogate marker of phosphate transport and cannot replace direct measurements of peritoneal phosphate transport status and clearance. Further studies are required to determine whether increasing total phosphate removal has any effect on patient outcomes.
Footnotes
The authors have no financial conflicts of interest to declare.