
Abstract
Background
A modified version of automated peritoneal dialysis (APD) using not only variable dwell times but also variable fill volumes has been tested against conventional APD (cAPD) with fixed dwell volumes in a randomized controlled clinical study. The results have indicated that the modified schedule for APD, denoted adapted APD (aAPD), can lead to improved small solute clearances, and, above all, a markedly increased sodium removal (NaR). To theoretically test these results, we have modeled aAPD vs cAPD in computer simulations using the 3-pore model (TPM).
Methods
The TPM, modified by including a transient, initial inflation of small solute mass transfer area coefficients (PS values), was employed. For simulations of osmotic ultrafiltration (UF), the TPM uses a constantly inflated value for PS for glucose and also a reduced value for PS for Na+, setting the peritoneal lymphatic reabsorption term at 0.3 mL/min. The simulations were performed by assuming that increases in intraperitoneal hydrostatic pressure (IPP) are transmitted to the capillary level (via vein compression) and therefore do not significantly affect the Starling balance. Furthermore, the effective peritoneal surface area (A) was set to be variable as a function of intraperitoneal volume (IPV).
Results
The simulations demonstrated a minor improvement of small solute clearances (∼0.7 – 1.6%) and a very small improvement of UF and NaR in aAPD compared to cAPD.
Conclusions
Due mainly to the increased fill volumes in 3 out of 5 dwells in aAPD, this modality caused minor increases in small solute clearances and marginal effects on UF and NaR. The computer simulations point to a need for accurate sodium determinations in aAPD, considering all the methodological problems and pitfalls relevant to determining dialysate Na+ concentrations and peritoneal sodium mass balance.
Keywords
Fischbach et al. investigated the outcome of aAPD vs cAPD in an open, randomized multi-center cross-over study (1). Adapted APD was performed using a schedule of 2 exchanges with a cycle time of 45 min and a fill volume of 1,500 mL followed by 3 exchanges with a cycle time of 150 min and a fill volume of 3,000 mL, whereas cAPD was performed with a schedule of 6 x 2 L. The patients were randomly assigned to start with either of the 2 schedules, shifting to the other schedule after 45 days. In each patient the outcome of aAPD vs cAPD was evaluated with respect to UF, NaR, phosphate removal and small solute clearances. Altogether 19 patients from 18 different centers were studied. Adapted APD was in general well tolerated. In addition, there was a small, but statistically significant, enhancement of Kt/Vurea, creatinine clearance (Clcreat) and phosphate removal in aAPD. Also, the peritoneal NaR was found to be higher with aAPD than with cAPD, 32.2 ± 52.0 mmol vs 18.35 ± 48.7 mmol per session, respectively (p < 0.01). However, the peritoneal NaR per dL of UF volume assessed was very low, 4.9 ± 35.7 mmol/dL and 2.5 ± 12.5 mmol/dL, respectively. This is much lower than commonly found during PD, where NaR is typically approximately 8 – 10 mmol/dL (of UF volume) in APD compared with 10 – 11 mmol/dL in continous ambulatory PD (2).
Except for the NaR presented in (1), the slightly improved small solute clearances obtained with aAPD might be expected intuitively. Thus, the predicted disadvantage caused by the raised intraperitoneal hydrostatic pressure (IPP), which is induced by the increased fill volume in 3 out of 5 dwells in aAPD would, at least partly, be compensated for by recruitment of an increased peritoneal surface area available for exchange in the 3-L exchanges (3–6). However, the extent to which changes in exchange surface area and/or in IPP affect solute transport during PD has been a matter of controversy. Rippe has argued that any changes in IPP, by transmission via an altered peritoneal venous pressure in the abdominal compartment, will translate into more or less the same changes in the peritoneal capillary hydrostatic pressure (7). Thereby, the capillary Starling pressure gradient (the transcapillary colloid osmotic pressure gradient minus the transcapillary hydrostatic pressure gradient) will remain largely unchanged when the IPP is altered, resulting in no major changes in UF. In fact, at least when the glucose concentration exceeds 1.36%, 3-pore model (TPM) simulations (5) and experimental data (8) have demonstrated increased UF efficiency by increasing peritoneal fill volumes. Furthermore, the fear of discomfort with greater than 2 L of fill volume is often exaggerated (9).
In the present modeling of peritoneal transport, we simulated aAPD vs cAPD according to the TPM, employing the exchange schedules clinically tested by Fischbach et al. (1). Conventional APD was simulated to result in an outcome identical to that of Fischbach et al. by slight parameter adjustments and allowing for an initial, transient inflation of small solute mass transfer area coefficients (PS values). Furthermore, according to vascular physiology, changes in IPP were modeled not to alter the Starling pressure equilibrium. Also, the peritoneal surface area (cf. A0/ΔX in Table 1) was varied according to the magnitude of the intraperitoneal fluid volume (IPV). The aim of the study was to theoretically investigate the impact of aAPD on UF and small solute removal, and, particularly, to find out whether there might be an advantage to implementing aAPD with respect to NaR.
Parameters Used for Computer Simulations of Intraperitoneal Volume vs Time V(t) Curves According to a 3-Pore Model of Membrane Selectivity
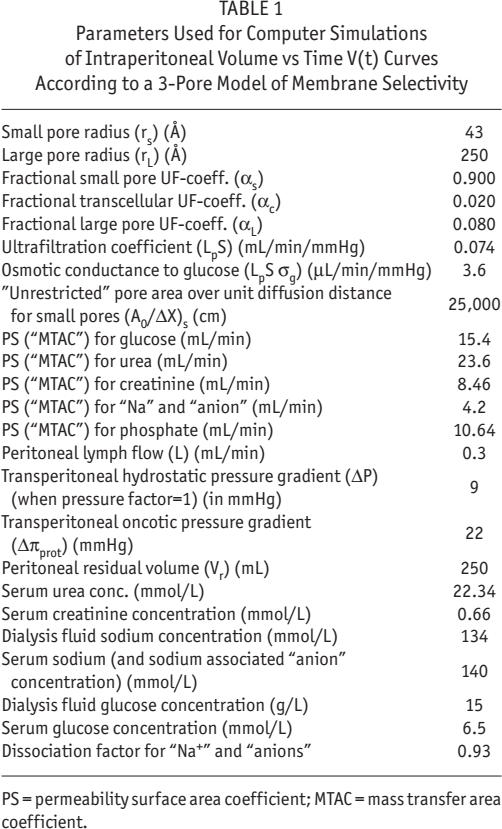
PS = permeability surface area coefficient; MTAC = mass transfer area coefficient.
Methods
Parameter Selection
The TPM has been described at some length in several previous publications (5,6,10). This method conceives the capillary membrane as being the limiting barrier to solute and fluid transport between the blood and the dialysate. It only partly takes the interstitium into account. Because of the presence of interstitial glucose concentration gradients between the peritoneal cavity and the capillaries in the peritoneal tissue, which, in relative terms, seem to become larger and larger over the duration of the dwell, the dissipation of the effective (glucose) osmotic gradient is much faster than the measured disappearance rate of dialysate glucose (11,12). Since it is the effective (glucose) osmotic gradient that governs UF, not the concentration of glucose in the dialysate directly, the rapid dissipation of the osmotic gradient is, in the original TPM (5,6), handled by “inflating” the mass transfer area coefficient (PS, permeability surface area coefficient) for glucose from ∼9.3 to 15.3 mL/min. The glucose disappearance from the dialysate, however, is modeled by using the TPM-predicted PS for glucose (9.3 mL/min). Furthermore, according to measured data, and to yield realistic sodium sieving curves, PS for sodium had to be perturbed, i.e. from 17.1 mL/min (as predicted by the TPM) to much lower values (in this case 4.2 mL/min), as has been discussed at some length previously (2). Several different versions of the TPM exist, which have been validated mostly for conventional glucose and Icodextrin dwells (13). Three-pore model simulations for APD have not been validated to the same extent. However, APD simulations are basically similar to those for conventional PD, except for the solute kinetics for fill and drain times in APD. The TPM was here modified by including an initial inflation of PS values using the inflation algorithm by Waniewski et al. (13,14). The parameters were then slightly adjusted to fit the achieved results for cAPD in the study of Fischbach et al. The basic parameters of the TPM used for the present simulations are shown in Table 1. It was assumed that all transport parameters (except those affected by fill volumes) remained unchanged during aAPD compared to cAPD. The PS for urea was inflated ∼50% to account for transcellular urea transport (15,16) and to comply with the outcome of cAPD by Fischbach et al. The default value for IPP was 8 mmHg, but it varied with IPV using the relationship of Twardowski et al. (17). However, since any changes in IPP will change the capillary hydrostatic pressure about equally, the Starling balance was not modeled to be altered with IPP changes. The effective peritoneal surface area (dictated by A0/ΔX) was set at 25,000 cm at a fill volume of 2 L (cf. cAPD) but was varied using an “area (A) factor” determined by the IPV as reported by Keshaviah et al. (3). Dwell times in the simulations of both aAPD and cAPD included not only the dwell times proper (during which peritoneal cavity dwell volumes were 100% or larger), but also 50% of fill and drain periods. In a supplement, we show data in which changes in IPP will change the Starling equilibrium by a pressure (P) factor. In these cases, the net hydrostatic pressure gradient was calculated from
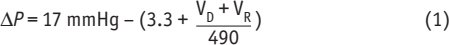
based on Twardowski et al. (17). Otherwise a net hydrostatic pressure gradient of 9 mmHg was used. The area factor (A) was calculated from
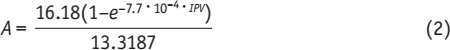
based on the estimate by Keshaviah et al. (3).
Results
Osmotic Ultrafiltration (UF)
The total UF volumes (drained volume minus infused volume) for conventional vs adapted APD were similar, 656 mL and 660 mL, respectively (Figure 1). In a supplement of this paper, the impact of varying the IPP in a way so that it affected the Starling balance is simulated. Under these conditions aAPD was actually less efficient in producing UF than cAPD. In contrast to aAPD, a cAPD schedule with fixed increased fill volumes, i.e. 4 x 3 L, resulted in an increment in UF volume during 9 hours (691 mL; data not shown). In Figure 2 the individual UF volumes for each dwell are shown for cAPD (2 x 6 L), and in Figure 3 UF volumes are shown for each dwell in aAPD. Note that the initial 2 shorter dwells in aAPD produced low levels of UF.
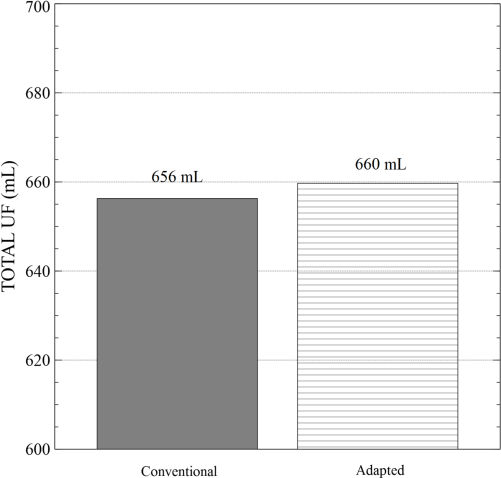
Total UF volume simulated for conventional 6 x 2-L APD vs aAPD. Only a minor difference UF volume occurred in aAPD. UF = ultrafiltration; APD = automated peritoneal dialysis; aAPD = adapted APD.
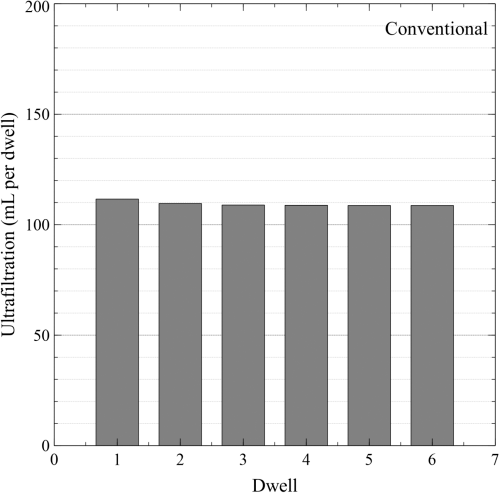
UF in mL/dwell for each individual dwell in conventional APD with 6 x 2-L exchanges. UF = ultrafiltration; APD = automated peritoneal dialysis.
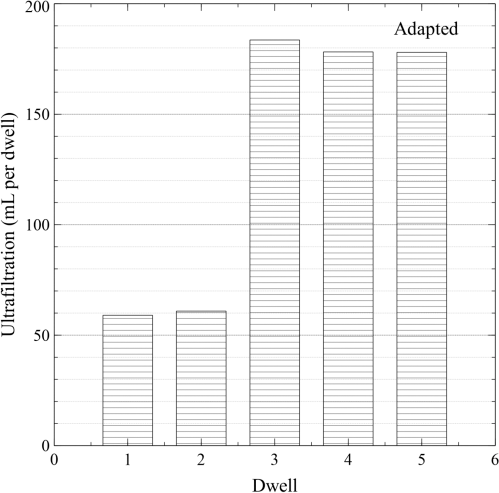
UF in mL/dwell in aAPD. Note the low UF volumes for the initial small (short) dwells. UF = ultrafiltration; APD = automated peritoneal dialysis.
Sodium Removal (Nar)
The peritoneal NaR was found to be slightly below 10 mmol/ dL UF during each dwell for both cAPD and aAPD (Figure 4). Adapted APD resulted in marginally higher (+ 0.4%) NaR than cAPD (Figure 5). A schedule of 4 x 3 L was, however, most efficient in producing NaR (+ 5% compared to aAPD) (data not shown).
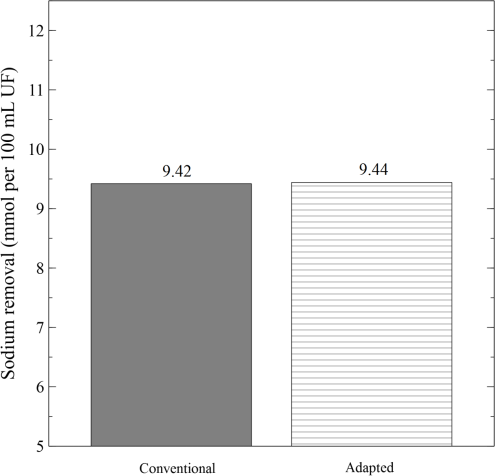
NaR in mmoles/100 dL UF volume in conventional APD and in aAPD. No difference was obtained. NaR = sodium removal; UF = ultrafiltration; APD = automated peritoneal dialysis; aAPD = adapted APD.

NaR in cAPD and aAPD. The increment in NaR was only 0.8% in aAPD. NaR = sodium removal; cAPD = conventional automated peritoneal dialysis; aAPD = adapted automated peritoneal dialysis.
Small Solute Clearances
Urea removal in terms of weekly Kt/Vurea (Figure 6, left panel) and weekly creatinine clearance (KP creatinine) in L/(1.73m2 body surface area)-1 week-1 (Figure 6, middle panel) increased ∼1% in aAPD. These changes are less than those observed in the clinical study of Fischbach et al. (1). Basically, similar alterations occurred with respect to phosphate removal in mmol/session (Figure 6, right panel) (18). All in all, small solute clearances increased by approximately 1% in aAPD compared to cAPD. Calculated solute removal per gram of glucose reabsorbed showed no significant difference in aAPD vs cAPD (data not shown). A (cAPD) schedule of 4 x 3 L caused an increase (+ 8%) in weekly Kt/Vurea compared to either cAPD (6 x 2 L) or aAPD.
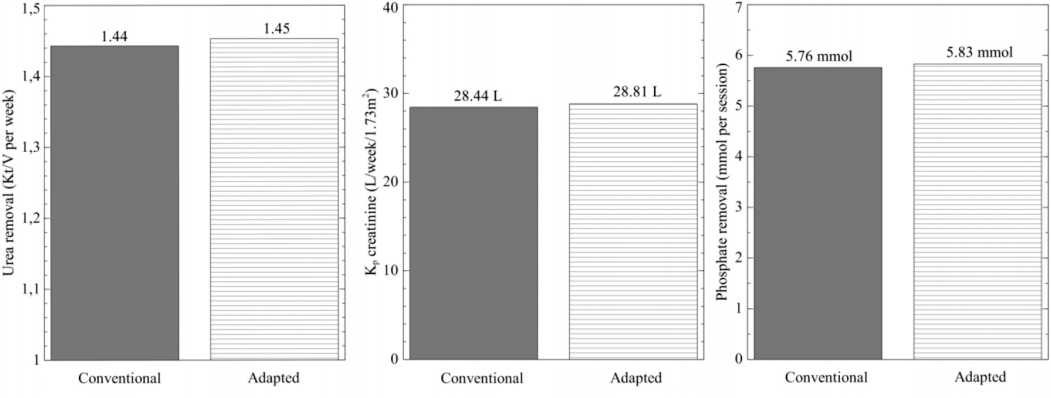
Urea removal in terms of weekly Kt/Vurea for cAPD and aAPD (left panel); weekly creatinine clearance (Kp) in cAPD and aAPD (middle panel); phosphate removal per session in cAPD and aAPD (right panel). cAPD = conventional automated peritoneal dialysis; aAPD = adapted automated peritoneal dialysis.
Discussion
The present computer simulation study of cAPD (6 x 2 L) vs aAPD with an exchange schedule clinically investigated by Fischbach et al. (1) demonstrated a minute (∼ + 1%) advantage from prescribing aAPD compared to cAPD with respect to small solute removal. However, there were no clear-cut advantages of aAPD with respect to UF and NaR. The present computer simulations demonstrated that variations in fill volume, and, hence, in effective peritoneal surface area, moderately affected small solute transport. Furthermore, the concomitant changes in IPP, as predicted from vascular physiology, were of subordinate importance for UF. Actually, cAPD with increased fill volumes (higher IPP), i.e. 4 x 3 L, was found to be (+ 5%) more efficient in producing UF and NaR, and (+ 8%) more efficient in causing urea removal during 9 hours than either aAPD or cAPD (6 x 2 L).
The discrepant result with respect to modeled and the much lower NaR clinically assessed is intriguing and needs special attention. First, there are considerable difficulties in accurately measuring NaR under conditions of PD, as has been pointed out by several authors (2,19). Hence, La Milia et al. concluded that flame-photometric techniques should be used for assessing NaR, since direct ion-selective electrodes, which measure the sodium activity (free Na+ ions) in plasma water (plasma devoid of proteins and lipids) considerably underestimates NaR (19). It should be noted that most clinical chemical laboratories today use ion-selective electrodes for assessing free Na+ ions in plasma water, and then “correct” the values to express the Na+ concentration in flame-photometric units. Usually 7 – 9 mmol/L is subtracted from the measured free Na+ concentration since the plasma water Na+ concentration is ∼ 5% higher than the plasma Na+ concentration. If this technique is applied also for assessing the Na+ concentration in used dialysate, which is devoid of plasma proteins and lipids, large errors arise. Thus, the chemical laboratory employed has to calibrate their measurements to be valid for the actual PD fluid in use. There is no account of such a special calibration of Na+ in the study by Fischbach et al. (1). Neither were the Na+ measurements in their multi-center study centralized in order to avoid center effects. Second, the nominal Na+ concentration in the bags used in (1) was 134 mmol/L, which, however, was not experimentally determined. A nominal PD fluid Na+ concentration of 134 mmol/L may actually represent real Na+ values somewhere in between 133 and 136 mmol/L, depending on shelf-life or other factors causing, for example, different degrees of evaporation from the bags. Third, any flush volumes from the tubing system were not accounted for in the mass balance calculations (18). Fourth, there may have been some additional mass balance calculation problems in the study of Fischbach et al., since the removal of sodium (and phosphate) was calculated from the total volume of dialysate collected at the end of the APD session plus the residual volume (∼4 L) by unused fluid, the “residual hung volume,” left in the dialysis fluid bags. This means that the drained dialysate may have been “contaminated” with ∼4 L of fresh dialysis solution containing ∼134 mmol/L Na+. This “contamination” of the drained volume was not accounted for, unless the “residual hung volume” was also taken into account as input in the mass balance calculations. Although the dilution of the drained volume by ∼4 L of fresh solution caused a reduction in the concentrations of urea, creatinine, phosphate, etc., the mass balance calculations for these solutes were not affected because of their complete absence in the unused dialysis fluid. Thus any dilution of the drained volume by fresh solution would be compensated for by the proportionally larger total drain volume. However, the opposite is true for sodium, because of the relatively high sodium concentration in the unused dialysis fluid. If the mass of sodium remaining in the residual hung volume was indeed added to the initial mass of Na+ provided to the patient, then the principle for the sodium mass balance calculation is, however, not incorrect.
The mean UF achieved per session in aAPD in the study by Fischbach et al. (1) was nearly 90 mL higher than in cAPD (743 ± 275 mL compared with 656 ± 358 mL), and the difference was statistically significantly despite the very large standard deviations. This is mainly thanks to the cross-over design, which made it possible to make paired comparisons in each patient. Direct volumetric UF volumes are cumbersome owing to the presence of a variable intraperitoneal residual volume from one exchange to another due to variable drainage conditions, body position etc. However, by averaging repeated measurements of drained volume over a large number of sessions, it is often possible to attain reasonable accuracy (11,20). Thus, the UF achieved in (1) may actually be slightly improved in aAPD, contrasting with the computer simulated results. We can only speculate on this discrepancy. For example, a slightly increased impact of the A factor than that presented by Keshaviah et al. (3) can yield slightly higher UF volumes as a function of IPV than was obtained in the present simulations. Since a higher IPP transmits to the capillary level almost fully, it will theoretically not affect the filtration forces (the Starling equilibrium) in a negative way. However, if the hydrostatic pressure in the peritoneal tissues is not altered to the same extent as IPP (because of gradients of pressure from the peritoneal cavity to the tissue), then a raised IPP may actually increase the net capillary hydraulic pressure gradient and be advantageous for UF. Such an enhancement of UF, induced by elevations of IPP was not modeled in our study.
The best fit of experimental data to the simulated results occurred if the area was modeled to vary with IPV, while, as predicted from vascular physiology, the Starling equilibrium was not negatively affected by changes in IPV, and hence, in IPP. Although some authors have criticized the concept of variable effective peritoneal surface area as a function of IPV (Krediet R. personal communication), our data thus appear to justify the use of an area factor, variable with IPV, in the simulations. This would be largely consistent with the original predictions by Keshaviah et al. (3) and also in accordance with results from a number of other investigators (4,21,22). By contrast, the effects of IPP on the capillary fluid equilibrium would be very minor, due to the direct transmission of most of the changes in IPP to the capillary level. For a pre- to post-capillary vascular resistance ratio of 4/1 to 5/1 the calculated effect of an elevated IPP on the capillary Starling equilibrium would be, at the most, 20% of the imposed IPP alteration. At higher intraabdominal pressures there is also a reduced perfusion of the peritoneal capillaries which may, in part, explain the reduced UF observed during abdominal compression using a girdle to an IPP of ∼20 mmHg (23). However, the larger fill volumes (3 L) in the current study correspond to an increase in IPP of only a few mmHg, from 8 mmHg to 10 mmHg, compared to the conventional fill volume (2 L). Such a small increase should, theoretically, have a very small impact on the peritoneal capillary blood flow. The lack of a negative influence of IPP on UF is further supported by the lack of decreased UF in aAPD in the study by Fischbach et al. (1).
In conclusion, compared to cAPD (6 x 2 L), computer simulations according to the TPM demonstrated a minute improvement of small solute clearances (∼ + 1%) and of UF and NaR in aAPD performed according to the schedule of Fischbach et al. (1). This occurred if the Starling equilibrium was not modeled to be affected by changes in IPP. Our simulations could not demonstrate a substantial increase in NaR or UF in aAPD, emphasizing that especially the magnitude of NaR in aAPD warrants further study. In such studies peritoneal Na+ mass balance measurements should be based on flame-photometry. Also, the actual Na+ concentrations in the dialysis fluids need to be determined experimentally. Furthermore, the contribution of Na+ in flush volumes should be taken into account. Overall, however, the computer simulations presented here indicate a minute improvement of small solute clearances in aAPD, mainly due to recruitment of peritoneal surface area in the 3-L exchanges. Further clinical and computer simulation studies would be useful to shed light upon the tentative advantages of adapted vs conventional schedules in APD.
Footnotes
Acknowledgments
This study was supported by the Swedish Research Council (Grant 08285), the Swedish Heart and Lung Foundation, the Medical Faculty at Lund university, and a grant from Baxter-Gambro Health Care, at Lund. Kerstin Wihlborg is gratefully acknowledged for skillful typing of the manuscript.
Bengt Rippe is participating in a clinical trial with Fresenius Medical care and has received speaker's honoraria from Fresenius Medical Care and from Baxter Gambro Healthcare at Lund.