






Abstract
The main objective of this systematic review was to determine the effectiveness of school feeding programs in improving physical and psychosocial health for disadvantaged school pupils. A comprehensive search was conducted up to May 2006. We included 18 studies.
School meals may have some small benefits for disadvantaged children. We recommend further well-designed studies on the effectiveness of school meals be undertaken, that results should be reported according to socio-economic status, and that researchers gather robust data on both processes and carefully chosen outcomes.
Abstract
Background
Early malnutrition and/or micronutrient deficiencies can adversely affect physical, mental, and social aspects of child health. School feeding programs are designed to improve attendance, achievement, growth, and other health outcomes.
Objectives
The main objective was to determine the effectiveness of school feeding programs in improving physical and psychosocial health for disadvantaged school pupils.
Search strategy
We searched a number of databases including CENTRAL (2006 Issue 2), MEDLINE (1966 to May 2006), EMBASE (1980 to May 2006), PsycINFO (1980 to May 2006) and CINAHL (1982 to May 2006). Grey literature sources were also searched. Reference lists of included studies and key journals were handsearched and we also contacted selected experts in the field.
Selection criteria
Data from randomized controlled trials (RCTs), non-randomised controlled clinical trials (CCTs), controlled before and after studies (CBAs), and interrupted time series studies (ITSs) were included. Feeding had to be done in school; the majority of participants had to be socio-economically disadvantaged.
Data collection & analysis
Two reviewers assessed all searches and retrieved studies. Data extraction was done by one of four reviewers and reviewed by a second. Two reviewers independently rated quality. If sufficient data were available, they were synthesized using random effects meta-analysis, adjusting for clustering if needed. Analyses were performed separately for RCTs and CBAs and for higher and lower income countries.
Main results
We included 18 studies. For weight, in the RCTs and CBAs from Lower Income Countries, experimental group children gained an average of 0.39 kg (95% C.I: 0.11 to 0.67) over an average of 19 months and 0.71 kg (95% C.I.: 0.48 to 0.95) over 11.3 months respectively. Results for weight were mixed in higher income countries. For height, results were mixed; height gain was greater for younger children. Attendance in lower income countries was higher in experimental groups than in controls; our results show an average increase of 4 to 6 days a year. Math gains were consistently higher for experimental groups in lower income countries; in CBAs, the Standardized Mean Difference was 0.66 (95% C.I. = 0.13 to 1.18). In short-term studies, small improvements in some cognitive tasks were found.
Reviewers’ conclusions
School meals may have some small benefits for disadvantaged children. We recommend further well-designed studies on the effectiveness of school meals be undertaken, that results should be reported according to socio-economic status, and that researchers gather robust data on both processes and carefully chosen outcomes.
Linked article:
Synopsis
Early malnutrition and/or micronutrient deficiencies can negatively affect many aspects of child health and development. School feeding programs are designed to provide food to hungry children and to improve their physical, mental and psychosocial health. This is the first systematic review on the topic of school feeding. Eighteen studies were included in this review; nine were performed in higher income countries and nine in lower income countries. In the highest quality studies (randomized controlled trials (RCTs) from low income countries, children who were fed at school gained an average of 0.39 kg more than controls over 19 months; in lower quality studies (controlled before and after trials (CBAs)), the difference in gain was 0.71 kg over 11.3 months. Children who were fed at school attended school more frequently than those in control groups; this finding translated to an average increase of 4 to 6 days a year per child. For educational and cognitive outcomes, children who were fed at school gained more than controls on math achievement, and on some short-term cognitive tasks.
Results from higher income countries were mixed, but generally positive. For height, results from lower income countries were mixed; in RCTs, differences in gains were important only for younger children, but results from the CBAs were large and significant overall. Results for height from high Income countries were mixed, but generally positive. School meals may have small physical and psychosocial benefits for disadvantaged pupils. We recommend that further well-designed studies on the effectiveness of school meals be undertaken, that results should be reported according to the socio-economic status of the children who take part in them, and that researchers gather robust data on outcomes that directly reflect effects on physical, social, and psychological health.
Background
The world has entered the new millennium inheriting an impressive legacy in health from the 20th century. Life expectancy in most countries has reached a new high and infant mortality a new low (
The rationale for school feeding programs
According to Wynn (
Early malnutrition and/or micronutrient deficiencies can adversely affect physical, mental, and social aspects of child health. Effects on physical health may include underweight, stunted growth, lowered immunity, and mortality. Early malnutrition and/or micronutrient deficiencies have been linked to poorer cognitive functioning (
School feeding programs may help to ameliorate some of these problems. The goals of school feeding programs differ, but often include relieving short-term hunger (
However, there is some controversy over the effectiveness of school feeding programs. According to the World Food Program “Research and experience show that when food is provided at school, hunger is immediately alleviated, and school attendance often doubles within one year” (
One important concern in school feeding studies is that, in poor families, the home diet may be reduced for children who are receiving food at school: this is termed ‘substitution’. For example, a survey on school feeding in Malawi showed that 77% of children reported that they get less food at home when they receive school meals. This is substantiated by caregivers; 82% of caregivers reported that substitution was occurring. When there is extra food, it is used to benefit other household members, particularly children (
Rationale for this review
Many countries have school feeding programs. For example, in 2004 the World Food Program alone had school feeding programs in 72 countries, covering 16.6 million school children (
The purpose of this review is to assess the effectiveness of school meal programs for improving the health of socio-economically disadvantaged children. Another purpose is to study their effectiveness in terms of equity: are they benefiting those children who are more disadvantaged children at least as much as those who are more advantaged?
Previous non-systematic reviews
We have thus far been unable to identify an existing systematic review on the effectiveness of school feeding programs. However, we have identified some non-systematic reviews of school feeding programs (
Some conclusions from these reviews are that: 1) the largest effects of feeding in early childhood on growth are likely to be found between the ages of 6 and 24 or 36 months, 2) growth may not be as important as other outcomes such as improved physical and psychological health (
Although the above reviews provided valuable information, they fail to give us a comprehensive picture of the effectiveness of school feeding across the globe. All were limited in their scope: some to just a few countries, most to either developing or industrialized countries, others to one feeding time (e.g. morning), and others to just a few outcomes. Furthermore, none were systematic reviews. Thus, standard methods were not used; details on search strategies, inclusion and exclusion criteria, number of studies found and considered, and quality of studies was not formally assessed. Importantly, little formal synthesis has been done.
Objectives
To determine the effectiveness of school feeding programs in improving physical and psychosocial health outcomes for low income school children. To compare the effectiveness of school feeding programmes for socio-economically disadvantaged children and advantaged children. To understand the process by which school feeding programs achieve (or fail to achieve) an impact on growth, cognitive development, and school performance.
Criteria for considering studies for this review
Types of studies
Randomized controlled trials (RCTs), non-randomized controlled clinical trials (CCTs), interrupted time series (ITS), and controlled before and after studies (CBAs) were included. Control groups could be either “no-treatment” controls (lunch or breakfast at home or no feeding/fortification) or placebo controls (e.g. low energy glucose syrup at school). Other study designs were excluded.
Types of participants
Children and adolescents, in any country, aged 5 to 19, who attended primary or high school. Note that this age range represents a change from the published protocol, which was focused solely on elementary school children. In the review, elementary and high school children were both included due to the dearth of studies on high school students.
Based on the 2004 World Bank List of Economies (
1. Lower Income countries
2. Higher-income countries
We also included studies in which some children were advantaged but results could be broken down by SES or baseline nutritional status.
Types of interventions
Included: Meals (breakfast or lunch) or snacks (including milk) administered in a school setting. If a study included two or more experimental groups given different types of meals, we chose the meals with the highest energy and/or protein content for data extraction and analysis.
Excluded interventions: micronutrient supplementation or fortification of existing meals, stand-alone nutrition education in schools or at home, obesity prevention programs, breastfeeding programs, food stamps, modifications to school meals to change nutrient content, community kitchens, food banks, and feeding centres.
Because of the increasing emphasis on reducing obesity in higher-income countries, programs built around school meals in these countries increasingly aim to enhance the nutritional content of children's diets by increasing availability and access to low-fat choices, fruits, and vegetables (
Types of outcome measures
We extracted data on changes in the intervention group relative to the control/comparison group.
Physical health outcomes included nutritional status (anthropometry, bone mineral density, bone mineral content, micronutrient status, and haemoglobin, and hematocrit). Both hemoglobin and hematocrit are indices of anaemia, a condition in which the blood cannot carry enough oxygen, and most often due to iron deficiency.
Psychological health outcomes included educational outcomes (e.g., school achievement in math, reading, or spelling, school enrolment, school attendance) and other tests of cognition such as intelligence test scores, psychomotor and mental development, attention, memory, reasoning, verbal fluency, vocabulary, on-task behaviour.
Behavioural outcomes included on-task behaviour, attention problems, and behaviour problems.
Adverse outcomes included stigmatisation, dependency, disruptive behaviour at school, and obesity or excessive weight loss.
Excluded outcomes: Reduction of dental caries, increased nutritional knowledge, and intermediate physical health outcomes such as reduction of hunger and nutrient intake.
Search strategy for identification of studies
Electronic searches. The search was performed by JM on the following electronic databases:
Cochrane CENTRAL Register of Controlled Trials (2006 ISSUE 2) via the OVID interface
MEDLINE (1966 to May 2006) via the OVID interface
EMBASE (1980 to May 2006) via the OVID interface
ADOLEC - Literature on adolescent health (To May 2006) - via Virtual Health Library interface
AMED (Allied and complementary medicine) (1985-May 2006) via the OVID interface
CAB Health (1973-May 2006) via the Silver Platter interface
CINAHL (1982 to May 2006) via the OVID interface
Current Contents (to May 2006) via the OVID interface
Dissertation Abstracts (1981 to May 2006) via the OVID interface
EBM Review (searched in May 2006) via the OVID interface
ERIC (1966 to May 2006) via the OVID interface
PsycINFO (1980 to May 2006) via the OVID interface
Food and Agriculture Organization Corporate Document Repository
Food Poverty Projects database (http://www.sustainweb.org/povdb_index.asp) (to May 2006)
Graylit Network (http://graylit.osti.gov/) (to May 2006)
Grey Literature New York Academy of Medicine
(http://www.nyam.org/library/grey.shtml) (to May 2006)
HMIS (Health Management Information Consortium),
Healthstar (1985 to May 2006) via the OVID interface
Healthpromis (http://healthpromis.hda-online.org.uk/) (to May 2006)
LILACS database - Latin American and Caribbean Health Sciences Literature (to May 2006) - via Virtual Health Library interface
MEDCARIB - Caribbean Health Sciences Literature (to May 2006) - via Virtual Health Library interface
PAHO - PAHO HQ Library Catalog (To May 2006) - via Virtual Health Library interface
Premedline (2002 to May 2006), EBM Reviews (to May 2006) via the OVID interface
SIGLE - System for Grey literature in Europe (1980 -May 2006) via the Silverplatter interface
Sociofile (1980 to May 2006) via the OVID interface
C2-SPECTR (Social, Psychological, Educational and Criminological Trials Register - http://128.91.199.101/) (to May 2006)
Search Strategy in MEDLINE: Milk.sh,tw. (feeding or school-feeding or meal$ or snack$).tw. (breakfast or break fast or lunch or mid-day or mid day or dinner or supper).tw. Or/1-35. Exp Schools/ (school$ or school-based or kindergarten or preschool or pre-school or daycare or day care).tw. 5 or 6 4 and 7 Breastfeeding/or (breastfeed$ or breast feed$).tw. 8 not 9 Exp Child Nutrition/ Bone density/or bone densit$.tw. Exp growth/ Body mass index/ Nutritional status/or nutrition$.tw. (growth or bone mass or weight or height).tw. Dietary services/or diet/ Food services/ Hunger.sh,tw. Food, Fortified/or (fortification or fortified).tw. (iron or iodine).tw,sh. Dietary Supplements/or (Dietary Supplement$ or nutritional Supplement$ or food Supplement$).tw. Exp Vitamin A/ Or/11-23 10 and 24
The strategy was amended where necessary to search the other databases listed. An RCT filter was not used as we were also looking for CBA and ITS. No language restrictions were applied.
Handsearching
We handsearched the electronic versions of the American Journal of Clinical Nutrition, Journal of Nutrition, European Journal of Clinical Nutrition, Nutrition Reviews, and Social Sciences and Medicine from the beginning of 1998 through to May 2006; Public Health Nutrition was handsearched from the beginning of 1999 to 2006. References of included articles and relevant reviews (
Personal contacts
People and or organizations focusing on nutrition, hunger, and international development were contacted by email to identify relevant studies on school feeding programs that we may have missed; these include Arlene Mitchell and Francisco Espejo of the
Methods of the review
1. Data Abstraction
The abstracts and titles of articles retrieved by the electronic and hand searches were independently assessed for eligibility by two reviewers (EK and VR) and/or one reviewer (EK) and one research assistant (CB), according to the inclusion criteria above.
Full copies of all those deemed potentially eligible by one of the reviewers were retrieved for closer examination. Two reviewers (EK and VR) determined whether or not they met eligibility criteria. We sought the advice of BM, JK and TG when we needed input on whether or not the children were disadvantaged. We sought the input of MP in cases where CBAs had inappropriate controls.
We developed our data abstraction forms a priori based on the data collection forms from the Effective Practice and Organization of Care (EPOC) review group (
2. Process evaluation
In order to identify possible confounders, data on a number of process elements were extracted. Our list was chosen to represent factor that could impact on effectiveness. It included: Intensity of approach (percentage of RDA for energy and whether low or high) Type of feeding and time of day food given Settings (e.g. Where is food given- type of school, given in classroom, lunchroom) Provider delivering intervention (was it peer supervised, teacher supervised, supervised by lunchroom staff, volunteers?) Monitoring intake Compliance Quality/acceptability of food given Duration of intervention Substitution
A 2.3. Detail on the Process evaluation
Contemporary research practice recommends process evaluation alongside empirical trials of complex interventions so as to identify how the intervention was implemented in practice, the mechanism by which it achieved its impact, and any local contextual issues that may have influenced outcome (
To this end, TG reviewed all papers included in the final review in order to identify information on process elements that may have helped to explain the process by which each intervention achieved (or failed to achieve) an impact in each primary study. Descriptive data were extracted from the papers on historical context, local political and economic climate, funding source, extent of involvement and partnership with local researchers, sampling (e.g. how ‘disadvantage’ was defined and measured), methodological detail of the implementation (e.g. level of supervision during the supplemented meal), context in which growth measurements and psychometric testing were undertaken, and so on. These data were tabulated in an Excel spreadsheet and used alongside the quantitative findings to help generate the various process hypotheses that are included in the methods, results, and discussion. The process evaluation was particularly helpful in the current review as we lacked sufficient data for meta-regression.
2.1. Energy content
One important process element was energy content, which was assessed by the nutritionists (BM and JK). Only energy was considered as many studies only provided the average kilocalorie content of the meal/snack, but did not provide sufficient detail regarding the food to estimate other nutrients.
2.1.1 Rules used in calculating energy content:
When the total kilocalories or % Recommended Daily Allowance (RDA) of energy were provided in the text of the study, this figure was used. When the amount of kilocalories were not provided but the descriptions of food were sufficient (quantity and type of food), the kilocalorie content of the meal/snack was estimated using the United States Department of Agriculture (USDA) nutrient data file. When meals/snacks with different kilocalorie contents were provided on different days ( When the number of days on which different meals/snacks were given on was not specified (
2.2.2. Calculating % RDA for energy
The % RDA for energy was calculated by dividing the given or estimated average kilocalorie content of the meal/snack by the RDA for the age/sex specific target group in each study (SCN 1989). When the intervention group of a study was comprised of various age and sex groups, and outcomes were given for the entire group only, a weighted average for the RDA was used to calculate the % RDA. In addition, as a check, the % RDA was calculated for each age and sex group for which there was a corresponding RDA by dividing the total kilocalories provided by the meal/snack by the age and sex specific RDA. Energy intensity was considered as a continuous variable. However, for purposes of helping to interpret the data, interventions will also be characterized as having two levels of energy content: low (interventions providing <15% of the RDA for energy) and higher (interventions providing 15% or more of the RDA for energy).
Due to lack of information, we were unable to calculate energy content for three studies (
After data abstraction was completed, tables of included and excluded studies were developed.
3. Data extraction and analysis
Results were analysed separately for lower and higher-income countries because the settings and populations are so different it would be misleading to combine them.
3.1 Continuous data. RCTs, CCTs, and CBAs
To perform meta-analyses of continuous data, we input data on means, standard deviations, and the number of participants for each outcome in the two groups. It is important to note that, in all cases, these means and standard deviations were unadjusted for confounders; however, they were adjusted for clustering when needed. We used mean and standard deviation for change in the meta-analyses in all but one case (
In cases where standard deviations and/or standard deviations for change were not published, and the study was published < 30 years ago (after 1976), we wrote to the authors requesting this information. Susan Walker provided us with means and standard deviations for change, and with before and after correlations in the control group for the Powell 1998 study; data from the
Change data
Data on change was either taken directly or calculated from other information presented in the papers for the following studies: Bailey (
3.2. Interrupted time series
We used the average of before and after session presented in the two ITS studies (
We did not have any discrete outcomes in our meta-analyses.
3.4 Skewness
Except for Shemilt 2004's trail-making test (
3.5 Data synthesis
We conducted meta-analysis using a random effects model. Weighted mean differences were calculated unless otherwise stated. We conducted separate analyses for each outcome across: 1) Lower income countries vs. Higher-income country, and 2) Different study designs (i.e. ITS, RCT and CBA). A clinical psychologist (LJ) commented on the clinical relevance of the psychological outcomes.
3.6 Methods of analysis for studies with potential unit of analysis errors
Studies which allocated by school or class could have unit of analysis errors if they did not adjust for between-cluster correlation. Therefore, we reviewed each primary study to determine whether or not clustering was part of the study design. If it was, we then determined whether or not the analyses adjusted for clustering. If analyses were adjusted in the primary study, we used them.
3.6.1. Methods used to correct for design effect in clustered trials or CBAs that were not adjusted for clustering:
When the pooled estimate used was an SMD (because of varying metrics), the method outlined in section 8.11.2.4 of the Cochrane Handbook ( When the pooled estimate was the WMD approach, we used the Variance Inflation Factor (VIF) to adjust the standard deviations in the treatment and control groups separately. These standard deviations were then used in the meta-analysis, and so are incorporated in the standard error of the mean difference and the weighting procedures. The result of this is equivalent to the method outlined in the Cochrane Handbook (following the SMD approach) when the variance inflation factors are the same in the treatment and control groups.
This approach was used because there is a real possibility that the cluster sizes differ between the treatment and control groups and therefore the VIF, which depends on cluster size, would be different. Therefore, the adjustment for variance inflation would differ between the treatment and control groups. As far as we know, the Cochrane Handbook does not provide for this eventuality. However it is necessary to take account of this difference in VIFs (see, for example, Agarwal in our review (
3.6.2 Calculating the Variance Inflation factor
First we calculated cluster size. When numbers of participants in each analysis were provided, these numbers were divided by the number of clusters to calculate cluster size. Otherwise, we used the number of participants provided in the methods sections of the primary studies and divided that by the number of clusters. Then, we found appropriate Intra-Cluster Correlations (ICCs). For weight and height for For math, reading, spelling, attendance and intelligence outcomes in Agarwal ( c. Then, for experimental and control groups separately, we calculated the VIF as follows: (1+ (m-1) multiplied by (ICC), where m is the average cluster size (
3.7 Subgroup analyses
3.7.1 Equity question. We had planned to perform subgroup analyses by socioeconomic status as well as baseline nutritional status. However, none of the included studies presented tables stratified by SES (although two did briefly describe results by SES). Two studies presented results stratified by baseline nutritional status (Powell 1998 (A),
3.7.2 Age
Because growth rates may vary by age, we conducted a subgroup analysis across age groups for weight and height. We also planned to do subgroup analyses by age for cognition, as it is possible that the effectiveness of school meals in changing cognitive outcomes may vary according to age. However, our data were not sufficient to do this.
3.7.3 Sex
We also conducted subgroup analyses by sex, and reviewed each study to determine whether or not they reported interactions between sex and outcomes.
3.8. Potential effect modifiers
We carefully examined several of the process elements listed above: high/low energy, compliance, substitution, and duration of the intervention. Study quality may also impact on findings; studies of lower quality often show higher effect sizes than those of higher quality. For example, biased outcome assessment is possible in situations where those who assess the outcome variables are not blinded to study group (i.e., intervention or control).
To better understand the influence of potential effect modifiers, we tabulated effects for each study sorting them by type of study, blinding versus unclear blinding, date of study, and high versus low energy (
3.9 Presentation of raw and absolute differences
Since absolute and relative differences convey different information, and both are needed to make an informed decision (
3.10 Heterogeneity
Where meta-analysis was conducted, we assessed heterogeneity using the steps below.
Common sense (e.g. Are the interventions, participants or outcomes so different that they cannot be combined?) I2 measure for heterogeneity ( The Chi-Square test for heterogeneity.
3.11. Assessment of publication bias
There were too few studies in meta-analyses to evaluate the risk of publication bias by means of funnel plots (
Description of studies
After initial screening of titles and abstracts, we retrieved 400 potentially useful articles. Reviewers agreed that 30 studies were potentially relevant and of the appropriate design. Each was read in full. Of these, 18 studies met inclusion criteria; 12 were excluded. The 18 papers included 45 separate comparison groups (see Table of Characteristics of Included Studies).
1. Excluded studies
Twelve studies that met study design criteria (e.g. RCT, CCT, CBA and ITS), but that did not meet other criteria are presented in the Table of Excluded Studies. Among the 12 excluded studies, six were excluded because the interventions and/or outcomes were not relevant for our study, three were excluded because they were not in a school setting, 2 were excluded because the description of SES was not complete enough for us to make a judgement on SES and one was excluded because some control areas were replaced between baseline assessment and follow-up.
2. Description of included studies
2.1 Study design
The 18 included studies comprised seven randomized controlled trials (RCTs), nine controlled before and after studies (CBAs), and two interrupted time series (ITS). Details of included studies are contained in the Characteristics of Included studies).
2.1.1. Allocation/clustering
Clustering was an issue in nine studies; these were all allocated by school or class. Of these nine, three (
2.1.2. Inclusion in meta-analyses
Eight studies were not included in any of the meta-analyses. In five of these (Bro (
2.2 Location
Nine studies were from Lower Income Countries; five of the seven RCTs and four of the eight CBAs. Of the nine studies performed in higher-income countries; two of these were RCTs, six were CBAs, and two were Interrupted Time Series (see also Characteristics of Included Studies).
2.3 Participants
Children participating in studies included within this review ranged in age from 5 to 19 years; most studies included primary school children. Details on age, sex, and socio-economic characteristics of children in each study can be found in the ‘Characteristics of Included Studies’ table.
2.4 Description of the interventions
2.4.1 Lower income countries
Five programs provided meals: four provided breakfast and one provided lunch. The remaining four programs provided snacks/milk. Energy provided ranged from 195 to 730 kcal and protein provided ranged from 10-27 grams per day. Three studies (
Five studies in lower-income countries provided no intervention to children in control groups; these children may have had meals at home, or had no meals. In four studies, children in the control group were given a very low energy snack (e.g. quarter of an orange), drink (e.g. syrup) or iron pill; the three Jamaican studies (
2.4.2. Higher-Income Countries
Five of the feeding programs involved meals: four breakfasts and one lunch, and four involved snacks/milk. Energy content of seven studies ranged from 126 to 705 kcal and the amount of protein provided ranged from 3 to 26 grams.
2.5. Outcomes
2.5.1 Physical outcomes included: weight gain in kg and height gain in cm (11 studies), change in weight and height-for-age z-score or percent height and weight-for-age (three studies), change in mid-upper arm muscle area (one study), change in mid upper arm fat area (one study), change in Bone Mineral Density, Bone Area and Bone Content (one study), and change in haemoglobin (two studies), hematocrit (one study), and in other biochemical indices (two studies).
2.5.2. Psychosocial outcomes included educational and cognitive test outcomes
Educational outcomes comprised: change in school attendance (five studies), change in achievement in arithmetic (four studies), reading (two studies), spelling (two studies). Change in cognitive test outcomes included: end-of-study general intelligence (one study), change in Raven's Progressive Matrices score (one study), change in performance on Trail Making Test (Part A) (one study), sparse reports on ‘mental tests’ or achievement (three studies), and short-term change in cognitive tasks (two studies). Although we had planned to include school enrolment, we could not find any studies on enrolment that met our criteria.
2.5.3. Behavioural outcomes
Change in playground activity was considered in one study, change in hyperactivity (one study), behavioural conduct (two studies), and in on-task behaviour (two studies).
Adverse outcomes were not reported by any studies in this review.
Methodological quality of included studies
Our quality criteria were modified from the EPOC checklist (
1. Criteria used
1.1. Criteria for RCTs
We considered allocation concealment, comparability of groups on physical and/or psychological measures at baseline, reliable primary outcome measures, protection against contamination, blinded assessment of primary outcomes, co-intervention, and loss to follow-up. For each of these criteria, a rating of adequate (criteria met), unclear, or inadequate (criteria not met) was given. We also used the Jadad Scale (
1.2. Criteria for CBAs
In assessing methodological quality of the CBAs, we considered equivalence of baseline measurement of physical/psychological outcomes across groups, reliable primary outcome measures, protection against contamination, blinded assessment of primary outcomes, co-intervention, and loss to follow-up. For each of these criteria, a rating of adequate (criteria met), unclear, or inadequate (criteria not met) was given.
1.3 Criteria for ITS
In assessing methodological quality of the ITS designs, we considered protection against secular changes (including intervention independent of other changes, appropriate data analysis, and reason for number of pre and post points given), protection against detection bias (including intervention unlikely to affect data collection and blinded assessment), reliability of the outcome measures, and completeness of the data set. Each aspect of these criteria is described in more detail in Figure One. For each of these criteria, a rating of adequate (criteria ‘met’), ‘unclear’, or ‘inadequate’ (criteria not met) was given.
Two reviewers (EK and BS) independently rated each aspect of study quality (EK and VR rated Shemilt). Disagreements were resolved at a consensus meeting. A nutritionist (JK) and a registered dietician (AF) assessed the reliability of anthropometric measurements and equivalence of baseline anthropometric measures across experimental and control groups. A registered clinical psychologist (LJ) assessed the reliability of psychological measures and the equivalence of baseline psychological measures across groups. An internal medicine specialist (PT) assessed the quality of haemoglobin, hematocrit, and bone mineral density measurements.
2. Results of Quality Rating
The results of the quality assessment of the included studies are listed in the Table of Included Studies and a complete summary can be seen in
2.1. Jadad criteria
2.1.1. DESCRIBED AS RANDOMIZED. All seven RCTs were described as randomized.
2.1.2 DOUBLE BLINDING. Double-blinding was not done in any of the studies.
2.1.3 DESCRIPTION OF WITHDRAWALS AND DROPOUTS. Five RCTs provided descriptions of withdrawals and dropouts, two did not provide this description.
2.1.4. DESCRIPTION OF METHOD OF RANDOMIZATION. None of the studies described their method of randomization.
2.1.5. DESCRIPTION OF METHOD OF DOUBLE-BLINDING. This was not given for any of the studies.
2.2. EPOC criteria
2.2.1. RELIABLE OUTCOME MEASUREMENTS. Five studies were rated as adequate for all, seven studies were rated as unclear for all, five studies were rated as mixed adequate and unclear, and one study was rated as inadequate.
2.2.2. EQUIVALENCE OF BASELINE MEASURES. Seven studies were rated as adequate for all, five were rated as unclear for all, two studies were rated as mixed adequate and unclear, one was rated mixed inadequate and adequate, and three were not applicable.
2.2.3. PROTECTION AGAINST CONTAMINATION. Nine ratings of adequate were given, five were unclear, two were inadequate, and two were not applicable.
2.2.4. BLINDING OF OUTCOME ASSESSMENT. Blinding of outcome assessment was generally poor; six were rated adequate, nine were unclear, two were inadequate, and one was mixed inadequate and unclear.
2.2.5. CO-INTERVENTION. Co-intervention was almost always unclear; we gave fifteen ratings of unclear, one of adequate, and two were rated not applicable.
2.2.6. LOSS TO FOLLOW-UP. Loss to follow-up was rated adequate for seven of the studies, unclear for seven, inadequate for two, and not applicable for two.
2.2.7. ALLOCATION CONCEALMENT (RCTs only). Allocation concealment was rated as unclear for all 7 of the RCTs.
Results
Physical Outcomes
A1. Weight gain
A1.1 Lower income countries: RCTs. Three RCTs (
A1.2. Lower Income Countries: CBAs. Three CBAs in lower income countries (
A1.3. Higher Income Countries: RCTs. Only one RCT in higher income countries assessed weight gain (Baker 1980 (boys)). Our analyses in REVMAN show no statistically significant differences in weight gain between children who received school milk and those who did not (WMD (kg) = 0.13 (95% confidence interval, -0.23 to 0.49).
A1.4. Higher Income Countries: CBAs. Four CBAs in higher-income countries assessed changes in weight. In the year long Corry-Mann study (
A2 Height gain in cm
A2.1. Lower Income Countries: RCTs. Three RCTs (
A2.2. Lower Income Countries: CBAs. Three CBAs with six independent samples (
A2.3 Higher-Income Countries: RCTs. Only one RCT (Baker 1980 (boys)) studied height. Our analyses in RevMan indicate that children who were given school milk gained a small amount more than controls over two years (WMD = 0.28, 95% confidence interval: -0.01 to 0.56).
A2.4 Higher-Income Countries: CBAs. Height gain was studied in four CBAs. In a meta-analysis of the Corry-Mann (
A3. Change in Weight-for-age z-scores
A3.1 Lower Income Countries: RCTs.
A3.2. Lower-Income Countries: CBAs. In the 1983 Powell study (
A4. Change in Weight-for-height z-scores
A4.1 Lower-Income Countries: RCTs. Grillenberger reported that in the Kenya study the decline in z-score was 0.20 less for the children who received meat as a snack than for the control group; this difference was not statistically significant (95% confidence interval, - 0.24 to 0.64) (
A5. Change in Height-for-age z-scores
A5.1 Lower-Income Countries: RCTs. In a meta-analysis of two RCTs (
A6. Percentage of Height-for-age
A6.1. Lower-Income Countries: CBAs. Our analyses for Powell's study (
A7. Change in mid-arm muscle area, mid-arm fat area, and mid-upper arm circumference
A7.1 Lower-Income Countries: RCT. Authors of the Kenya study presented data on change in mid-arm muscle area, mid-arm fat area, and MUAC (
A8. Change in bone mass and body composition
A8.1 Lower-Income Countries: RCT. Du and his colleagues (
A9. Biochemical outcomes
A9.1. Lower-income countries: RCT. In the Kenya study (
A9.2. Higher income countries. Tisdall (
A10. Hemoglobin and hematocrit
A10.1 Lower-Income countries. RCT. One paper produced from the Kenya study (an RCT in a lower-income country) found no differences in hemoglobin increase between the experimental (meat) and the control group; the mean increase in g/L was 7.5 (s.d = 15.1) in the experimental group and 11.5 (s.d. = 19.8) in the control group (
A10.2. Lower-Income Countries: CBAs. Devadas (
A10.3 Higher income countries: CBAs. Tisdall (
B. Psychosocial Outcomes (Educational outcomes, short and long-term cognition)
B1. School Attendance
B1.1 Lower-Income Countries: RCTs. Jacoby and colleagues (
B1.2 Lower-Income Countries: CBAs. Our meta-analyses adjusting for clustering in the control groups showed that change in attendance was not significantly different between the breakfast group and the pooled control groups (WMD = 4.95, 95% C.I. = -3.95, 13.46). Sensitivity analyses at 0.10 and 0.20 did not change the outcome. Agarwal (
B2.1.3 Higher-Income Countries: CBAs. Three authors (
B2. Math performance
B2.1. Lower-Income Countries: RCTs Two RCTs (Powell 1998 (A)); and the Kenya study (
B2.2. Lower income Countries: CBAs. Two CBAs
B3. Spelling achievement
B3.1 Lower Income Countries: RCTs. Multilevel regression analyses performed by Powell (Powell 1998) showed no difference in change in spelling achievement as measured by an adapted version of the WRAT for the experimental group than for the controls (b = -0.5, s.e. = 0.27, ns.).
B3.2 Lower Income Countries: CBAs. In one CBA (
B4. Reading achievement
B4.1 Lower-Income countries: RCTs. Powell and colleagues (Powell 1998 (A)) assessed change in reading performance on an adapted version of the WRAT. A multi-level regression analysis demonstrated that there was no difference in reading performance between experimental and control groups after adjusting for baseline performance, age, and sex (b = 0.12, s.e. = .29, n.s.).
B4.2 Powell and colleagues (
B5. Intelligence-type test scores
B5.1 Lower Income Countries: RCTs. Some trialists (
B5.2. Lower Income Countries: CBAs. In the Agarwal study (
In another analysis, we used subgroups from Agarwal (
B5.3. Higher Income Countries: CBAs. One CBA in a higher income country (
B6. Short-term effects on cognition
B6.1 Lower-income countries. RCTs. Chandler and her colleagues (
Jacoby and his colleagues (
B6.2. Higher Income Countries: RCTs. One cluster RCT in a high income country (
C. Behavioural Outcomes
In a sub-study of the larger Chandler study (
D. Subgroup analyses
D1. Effects by socio-economic status
D1.1. Lower-Income countries: RCT. None of the included studies displayed data on outcome by SES. However, Grillenberger and her colleagues (part of
D2. Effects by baseline nutritional status
D2.1. Lower-Income Countries
D.2.1.1. Weight. A subgroup analysis for change in weight from the Powell study (Powell 1998 (A)) showed no interaction between treatment and baseline nutritional status (fixed and mixed effects: Q/Z = 0.01, P-value = 0.97).
D.2.1.2. Height. Subgroup analysis of the Powell RCT (
D2.1.3. As previously described, Jacoby (
D3. Age
D.3.1. Lower Income countries: weight. In a meta-regression of the three RCTs (
In a meta-regression of the 3 CBAs (
D.3.2. Higher Income Countries: weight. As previously shown, in the Paige study (
D.3.3. Lower Income Countries: height. Meta-regression analysis for height in three RCTS (
The relative differences in weight and height also show a gradient in benefit across age, with a relative benefit of 98%, 41%, 45%, 0.9% for the ages 5-6, 6–8, 9–10 and mixed ages respectively.
D. 3.4. Higher income countries: height. As mentioned previously, the average height gain was larger in the middle two age groups (7 and 8 year olds) in the Paige study (
For cognition, Powell (Powell 1998 (A)) reported a significant grade by treatment interaction for math (b = -0.85, s.e. = 0.44, p = 0.05) indicating that the effect of school breakfast mainly occurred for younger children.
D4. Sex
D4.1. Lower Income countries: RCTs. Powell (Powell 1998) found no significant sex by treatment interaction for height and weight. However, Grillenberger (
D4.2 Lower Income: CBAs In the Agarwal study (
D4.3. Higher Income countries: RCTs. In the Baker study, no differences were evident between boys and girls in weight gain of the experimental group relative to the controls (
None of the studies tested a treatment by sex interaction for cognition.
E. Potential Confounders
E1. Study quality
E1.1. Comparison of RCTs and CBAs. Our meta-analyses of height and weight gain described above show there was a large difference between RCTs and CBAs in height gain (0.35 cm (n.s) in RCTs and 1.45 cm (sig) in the CBAs). For weight, differences between RCTs and CBAs in meta-analyses were smaller (0.39 kg in RCTS and 0.71 kg in CBAs); both showed significant overall effects. For most of the cognitive functions, comparisons of effect sizes are difficult, as every study used different scales and different methods of reporting. For arithmetic, two RCTs and two combined CBAs showed significant effects.
In higher income countries, both weight and height gains were non-significant and very small in one RCT, but higher in the CBAs. However, it must be noted that the % RDA for energy provided in that RCT was very low. No comparison of cognitive functions is possible, as this RCT did not assess cognitive function.
E1.2. Comparison of blinding to unclear blinding
Findings for this comparison were very similar to findings from comparisons of study types. However, for attendance, one of two RCTs in lower-income countries that assessed attendance had unclear blinding. This study had a very slightly larger effect size than the one that did blind outcome assessment.
E2. Substitution
Only three included studies (
E3. Compliance
Compliance was very poor in some studies from higher income countries. For example, in the Lieberman study, only 10% of children attended breakfast 90% of the time, and less than half attended 55% or more of the time (
Discussion
In performing this review, we found that many of the articles on school feeding did not use rigorous outcome assessment. Many articles simply provide descriptions of the nutritional quality of school meals and/or the dietary intake of participants, others describe program operation, management, or cost, others simply survey participants, parents, or providers. Another group of studies comprise cross-sectional comparisons of participants and non-participants; still others are longitudinal studies with no control. The 18 included and 12 excluded studies included in this review are the only studies we found which assessed effectiveness with a reasonable degree of rigour. Despite the practical difficulties involved in undertaking research on school meals, it is clear that more high quality research on school feeding programs needs to be undertaken in both higher and lower income countries.
We included a wide range of studies in this review; they were conducted over eight decades and in many different countries. Their heterogeneity in terms of setting, historical/policy context, sample, inclusion criteria, interventions, and outcomes is striking. Sorting the studies into historical order gives a feel for the way the focus of the research has moved from en masse feeding of the disadvantaged and measuring growth plus ‘general condition’ of the children to a much tighter focus on selected samples of the socially excluded and measuring cognitive and educational performance as well as growth.
The quality of included studies improved over time. Some of the earlier studies (which go back to the 1920s) were probably excellent according to standards of their time, but were not described in enough detail to allow them to meet current quality criteria. Reports from studies in the 1960s and 1970s also lacked sufficient detail. Methodological quality was highest in the more recent studies from lower-income countries. Our process evaluation showed a great deal of variability in study implementation and in attention to important confounders. This is discussed more fully under potential confounders.
A. Effects of school feeding on growth
In this review, we found positive, significant effects of school feeding on weight in lower-income countries and mixed, but generally positive effects in higher income countries. Extrapolating from the average yearly gain seen in RCTS in our review, if meals were given throughout six years of primary school as suggested by Powell 1998 (A), total gains could be 1.3 kg. Extrapolating from the CBA results suggests gains of 4.5 kg over the six year period of primary school.
In terms of height, results from lower income countries were mixed, but in higher income countries, results were moderate and positive. Interestingly, evidence from our subgroup analyses in lower income countries shows that height gain was significantly greater for younger children than for mixed age groups. However, it is difficult to determine whether this trend is due to age, or to low energy content of the interventions that did not seperate out children by age.
It is difficult to determine clinical significance for growth, particularly in this review. There are a number of reasons for this: 1) lack of standards for weight and height gain in school age children, 2) few studies presented data on baseline nutritional status and the importance of change depends on this, and 3) growth velocity will differ among different ages of school age children, and in most studies, results were not presented by age group. It is important to note, however, that effects on weight were small.
As noted in the introduction, growth may not be the most important outcome of school feeding. Other outcomes may have an important impact on education and on later functioning. These outcomes include: decreased morbidity, increased muscle mass, improved attention and behaviour, improved academic achievement and improved cognitive functioning. Although these benefits are sometimes seen at the same time as improved growth, it is essential to study them separately rather than infer them from increased growth.
B. Other physical outcomes
Results from one study suggested that school feeding with meat led to an increase in muscle mass. Grillenberger et al, when considering the Kenya study, hypothesized that the higher quality protein and more available micronutrients in the meat supplement may have been responsible for these differences. If this finding on increased muscle mass was replicated, it could be important, as increased muscle mass has important practical implications, including the potential for increased work and play capacity. However, it is important to note that, as this outcome was only assessed in one study, results can only be taken as preliminary (
One study (
Effects on Biochemical outcomes
It is difficult to draw any firm conclusions about the effects of school feeding on biochemical outcomes, as only a few studies reported on them. In those that did, results for haemoglobin and hematocrit were mixed, and except for Vitamin B12 and Vitamin A, other biochemical outcomes were unaffected by feeding. In the case of Vitamin A, Tisdall noted that differences were not clinically meaningful (
C. Psychological outcomes/clinical relevance
In general, there are two ways through which school feeding may impact on cognitive function; 1) long-term contributions of feeding to overall health and brain function and 2) short-term metabolic changes due to immediate energy supply (
Thus far in school feeding studies, only a few researchers have paid attention to the selection of appropriate cognitive outcome measures (
In the majority of the studies included in this review, it is difficult to determine the clinical significance of the findings. Many of the reports fail to include the range, mean and standard deviation of the specific cognitive measures, fail to adequately describe the cognitive measures used or how conventional measures were adapted or modified, and how the reported scores were derived. Furthermore, there is no universally agreed-upon definition of clinical significance in this field. However, we were able to draw some inferences about clinical relevance.
Significant improvements in math performance were consistently found in studies from low income countries. Thus, we conclude that school feeding can result in improvements in math performance. The arithmetic measures used in these 4 studies vary and it is difficult to determine the clinical relevance of these statistically significant findings without further information about the psychometric properties of the tests. However, it seems as if the small effect found in the Kenya study (
Results from two studies suggest that school feeding may impact on intelligence type tests, but these results are far from conclusive. Results from the Agarwal study (a small CBA) are difficult to interpret because we had to use ICCs from achievement tests and significance differed according to whether subgroups or totals were used (this was due to differences in cluster size). If replicated, these results would be important. For example, the Performance IQ increase of 5 points represents a third of a standard deviation. The observed FSIQ increase of 4 points (one-fourth of a standard deviation) is comparable to that seen between breast-fed and formula fed infants, which is considered to be clinically significant and is used extensively to promote breast-feeding (
In the Chandler study those who received breakfast generated 1.5 more words on average on the semantic verbal fluency task than controls. Assuming that scores across two categories were summed, the undernourished children in the treatment group generated less than 1 additional word per category relative to controls. A review of norms for 1 minute semantic verbal fluency tasks (similar to those used by Chandler et al) for 8 and 9 year olds reveal standard deviations in the range of 2.7 to 3.9 words per category (
Although there are discrepancies, most of the psychosocial outcomes in this review that improved as a result with school feeding are related. These include: fluid intelligence, processing speed, and arithmetic. These functions require more concentration and attention; and application of skills and/or rules to novel situations. In contrast, outcomes such as spelling achievement are done by rote. It has been hypothesized that these cognitive functions are highly dependent on the functional integrity of the central nervous system (CNS) and may fluctuate from moment to moment due to physical or emotional factors (
Effects on School Attendance
One of the most commonly cited benefits of school feeding is in improved attendance. The mechanisms for enhancing attendance may include not only the attraction of a free meal, but also possible effects on immune function that reduce illness and the effect on concentration that may make school more enjoyable.
The results of this review are consistent with other findings showing that school meals can improve school attendance in lower income countries. However, effects were small. Taking estimates from the two RCTs together, in a school year of 172 days a year (i.e. Peru), this would mean an increase of 4 to 6 days per year. The improvement in attendance noted in three CBAs in the United States was lower (and nonsignificant). This difference may be due to the fact that children in higher-income countries had more regular attendance at baseline than those from lower-income countries. It may also be due to the fact that families in lower-income countries were more motivated by the prospects of receiving food. This fits well with the high non-compliance rate we observed in many of the North American studies. These studies suggest that the impact of free school meals on school attendance may be greatest in areas of greatest poverty.
Improved attendance could mean greater opportunities for learning and mental stimulation and consequently, improved academic performance, more opportunities for social interaction with adults and peers, and possibly, a better attitude towards school. However, it is difficult to say whether the projected 4 to 6 days of increased attendance per year in lower and lower-middle income countries is sufficient to result in such changes.
Behaviour
Playground activity. Results from one study in our review indicate that playground activity levels, particularly pro-social activity, are higher for those who received school meals; although absolute differences are small, relative differences are large.
Evidence from three of our included studies shows that school feeding may have positive effects on classroom behaviour in both high and low income countries. However, as discussed below, effects may depend on the quality of the educational environment.
D. Possible Confounders
There are a number of factors that could have impacted on effectiveness; here we provide details on a few of them. It is important to note that although potential confounders are looked at individually, the reality is much more complex and confounders are likely highly intertwined.
D1. Substitution
As mentioned in the introduction, one important concern in school feeding studies is substitution. In poor families, to spread limited resources, the home diet may be reduced for children who are receiving food at school. In two studies that assessed substitution (
Interestingly, the results from the Kenyan Study (
D2. Energy intensity of meal/snack
It seems logical that the energy intensity provided by school meals would impact on outcome. Our review provides some support for this hypothesis. Three (
D3. Pupil / student compliance
Another factor that is almost certain to impact on effectiveness is compliance. While compliance rates were very high in the Kenya study (
The lack of compliance shown in several studies in high income countries suggests that school feeding programs in higher income countries should take measures to increase compliance. Timing of the meal may be important in high income countries; it seems logical that students would be less likely to attend school breakfast (which means leaving home early) than they would be to attend lunch or a snack session.
The degree to which those who implement the intervention comply with the protocol (e.g. continuous provision of food, complying with group assignment) is very likely to impact on results. For example, in the Shemilt study, some experimental schools implemented breakfast clubs before baseline measurements could be taken; others (4 out of 17) did not have breakfast clubs at the time of first follow-up (
D4. Short-term reduction in hunger
Evidence from this and other reviews (
D5. Study duration
For growth, one would expect to see effects on weight with shorter study durations, and effects on height only with longer durations. In this review, studies that assessed growth were generally of long duration; the shortest was seven months. In reviewing the results, it is difficult to discern any clear pattern by duration of the study. The Du study (
For cognition, the importance of study length depends on the outcome measure. It is reasonable to expect to see improved attention and concentration following short-term interventions, while increased performance in other cognitive domains may be demonstrated only following longer feeding intervals. Two studies in this review have suggested that when performance is evaluated using a mechanical, stimulus-response format (for example, “put a ring round all the letter As on this page”), short-term feeding has little impact on performance, whereas if the test involves a greater degree of creativity and motivation and the expenditure of cognitive effort (for example, “name as many animals as you can in time limit Y”), feeding has a significant effect. For example, the Chandler study (
Within the longer-term interventions, it is difficult to discern whether or not a pattern exists according to length of the study. This is largely due to the fact that outcomes were so different, and few could be combined. For math, effects were strongest for the Agarwal study (
The interval between feeding and cognitive testing may also prove to be an important variable. It is expected that feeding would have immediate, but short-lived effects on cognitive processes such as processing speed and attention. Measurement of these functions should occur within minutes or hours of the feeding in order to quantify these changes. In contrast, feeding programs of a longer duration, such as months to years would be required to effect improvements on language, learning or academic tests and the interval between feeding and testing is less important when measuring these functions.
D6. Benevolent attention
A mechanism of action, implicit in some later studies, is that provision of school breakfast makes children feel valued and increases the general attention given to them. According to Powell (
D7. Quality of the educational environment
The quality of the educational environment plays an important role in learning. For example, Levinger (
E Effect modifiers
E1 Age
Evidence from this review shows that younger children realize greater height benefits than older children. However, it is important to note that few studies on growth involved older children and that some of our studies did not separate out age groups. Few studies in our review assessed the interaction between age and treatment effectiveness on cognition, although one study did show that younger children benefited more from feeding.
E4. Sex
We found that there was generally little evidence for difference in effectiveness by sex.
In terms of cognition, developmental studies have shown that sex differences in cognition in children are evident as early as the age of five. For example, girls are more proficient than boys in verbal memory, (
Considering that the World Food Program strategic plan includes reduction of sex disparities as a goal of school-feeding, the relationship between sex and the effectiveness of school meals clearly warrants further investigation.
F. Equity question: Effectiveness by level of disadvantage
Results from this review provide some preliminary evidence that school meals may be more effective for those who are more in need. Furthermore, relative to controls, undernourished children showed greater gains in short-term cognitive performance than did well nourished children. The findings on short-term cognition support Pollitt's (
A further bit of evidence for greater effectiveness in poorer children is suggested by our findings that: 1) effects on attendance and cognition were greater in low income countries, 2) within more recent studies, effects on weight were higher in lower income countries, and 3) effects from very old studies in higher income countries were highest. The latter finding can be explained by that fact that children in the Corry-Mann study were from a home for destitute, or orphaned boys in 1920s England, and that the Orr study was performed in a mining village in 1920s Scotland in a time of recession and, unemployment. Thus these children were very disadvantaged.
However, it is very important to note that data on effectiveness by level of disadvantage was very limited.
Reviewers’ conclusions
Implications for practice
School meals may have a number of small benefits for children. In the studies reviewed, school meals resulted in small improvements in weight, height in younger children, attendance, math performance, and behaviour. Evidence suggests a possible impact on intelligence tests, but replication is needed. Evidence from single studies shows that school meals may also increase bone mineral density, arm muscle, and Vitamin B concentrations. The magnitude of benefits realized are probably dependent on the design of the program, amount of energy and other nutrients provided by the meal/snack, baseline nutritional status, conditions for learning in the classroom, timing of meal/snack, substitution and social environment at home, age of the child, and not surprisingly, on compliance. However, it is unrealistic to expect that school meals or any other single intervention can be a panacea for all of the deprivation of children living in poverty.
In considering the worth of school meals, it is also important to consider intangibles such as the worth and pleasure derived from having a full stomach and eating a good meal. This is something qualitative that it is difficult to measure adequately, but the relief of hunger alone is important.
School meal programs should be well-designed, and provide sufficient energy, protein, fat and micronutrient content for children's age and baseline nutritional status. Special attention should be paid to ensure that micronutrients important for growth, physical health, and cognition such as iodine, iron, zinc, Vitamin B-12, and calcium are provided. The amount and type of fat and cholesterol should also be taken into account given their role in structure and function of parts of the brain which continue to develop into adolescence and influence cognitive outcome. Since 1969, the pattern of nutritional status in high-income countries has shifted from under-nutrition to increasing obesity (
Palatability and special needs of the target population are also extremely important. Food should be appealing, acceptable, and locally available. Most of the researchers in included studies went to a great deal of trouble to ensure that foods were culturally acceptable and tempting to the palate. In terms of digestibility, Paige hypothesized that the African-American children in the population studied had a high prevalence of lactose deficiency (that is, they were intolerant of milk), as evidenced by the fact that in a pilot study, 25% of them had rejected a cow's milk supplement even when chocolate flavoured. The definitive intervention comprised a specially formulated low-lactose milk supplement tailored to the particular physiological make-up of the population and refined in response to the children's feedback on its palatability; a significant impact on growth was demonstrated. This study prompts the additional conclusion that piloting a school nutrition intervention is not just about confirming palatability, but about identifying specific nutritional issues / needs in the program's target population. Follow-up results from one study in the developing world reported that most effects of feeding with milk disappeared three years after feeding stopped; this would suggest that school feeding should be continued throughout school years (
Implications for research
Considering the dearth of high quality evidence on school meals, as well as the complexity of our findings, we conclude that further well-designed research is needed in both lower and higher income countries. RCTs are needed in order to ensure that causality can be attributed. We suggest randomisation by school, and appropriate statistical methods to account for cluster randomization. In order to more clearly answer the question about effects by level of disadvantage, we would like to see all primary researchers provide breakdowns of effects by socio-economic status of parents as well as by sex and baseline nutritional status. Double blinding should also be considered in terms of providing, meals/snacks with similar appearance but high and negligible content of energy and other nutrients (e.g. high and low calorie milk shakes).
In conducting studies, attention needs to be paid to ensuring that the intervention is delivered as intended. Process evaluation is crucial. As shown in this review, it is very important to encourage full participation, and to measure participation, and consumption carefully.. We might tentatively conclude for future trials that measuring non-consumption of food is best done for each individual child. Substitution should also be monitored. We also conclude that studies on long-term effects of school feeding should feed children in both groups on the day of testing to control for the relief of short-term hunger. Other factors such as benevolent attention and quality of educational environment should also be considered.
We suggest that in terms of physical health, important outcomes are: changes in weight and height, muscle mass, body fat percentage, micronutrient status, physical activity, and bone mineral density. Weight is an important outcome, both in lower income countries where programs seek to increase growth of under-nourished children, and in high income countries where school feeding programs increasingly aim to reduce childhood obesity rather than increase growth.
For psychosocial outcomes, attendance, enrolment, and retention in school are all highly important for lower-income countries. This is particularly true for girls. As education of the populace is key to a country's improved development, school feeding should be combined with other interventions that aim to improve country educational attainment. It is essential to measure educational achievement and cognitive outcomes in all countries. We suggest that in the next generation of studies of school feeding on cognitive performance, the choice of tests should be explicitly hypothesis-driven so as to discriminate between different cognitive and motivational effects. It is important to measure a full range of brain function with neuropsychological testing: we suggest a comprehensive assessment of intelligence, processing speed, attention, executive functions, memory, language, visual-abilities and motor and sensory function. In order to disentangle the effects of short-term hunger relief from long-term physiological changes, we suggest that all children be fed before psychological testing.
School meal programs take place in a context which may significantly impact on their effectiveness. As noted by Levinger (
Acknowledgements
We would like to express our thanks and sincere gratitude to Geraldine Macdonald, Jane Dennis, Jo Abbott and Georgia Salanti for all of their help and hard work on this review. We would also like to thank three anonymous reviewers and two Campbell methods reviewers for their important feedback. This review has benefited immensely from all of their input.
We would like to thank the Cochrane Health Promotion and Public Health Field for providing a bursary to fund protocol development, and the Canadian Institutes of Health Research for personnel funding in the form of a postdoctoral fellowship to the primary author.
Importantly, we need to thank the primary study authors who went above and beyond the call of duty to send us needed information: Susan Walker of the Powell study team, Quang Zhang of the Du study team, Ernesto Pollitt and Cueto of the Peruvian study team, Charlotte Neumann of the Kenyan study team, and Ian Shemilt. We greatly appreciate their help.
We would also like to thank Francisco Espejo, Chiara Bruneli, and Aulo Gelli of the World Food Program for references and for helpful comments.
Finally, we would also like to thank the following research assistants for their dedicated and careful work: Carl Wilkins, Daniel Francis, Caitlin Burley, Alicia Ashton, Megan Kendall, and Joan Peterson.
Potential conflict of interest
None known.
Contribution of reviewers
BK had the idea for the review, obtained funding for developing the protocol, wrote the protocol, identified articles to retrieve, looked over all of the articles, decided on inclusion/exclusion of studies, extracted data, performed analyses, rated quality, and wrote the review.
VR helped with writing the protocol, identified articles to retrieve, looked over all of the articles, decided on inclusion/exclusion of studies, performed analyses, extracted data, and edited the review/.
MP provided guidance on many aspects of the review, and edited the review at all stages.
BM helped to decide on inclusion/exclusion of studies, helped to calculate RDA for energy, read each study for clinical impact, gave advice on clinical relevance, and helped to write the review
JK calculated RDA for energy, extracted data for nutritional tables on each study, read each study for clinical impact, gave advice on clinical relevance, and helped to write the review.
TG provided input on classification and inclusion/exclusion of studies, wrote a thorough realist review, and edited the review. Parts of the realist review were incorporated into the dicsussion. It will also be published as a complementary article. LJ read all included papers with psycho-social outcomes, rated baseline measurement and reliability of outcome measures, identified clinical significance of these outcomes, and wrote sections ot the discussion.
GW was the study statistician and provided statistical advice at all stages of the review.
JM developed the search strategy and performed literature searches.
AF rated baseline measurement and reliability of outcome measures for growhth outcomes.
BS rated quality of included studies.
AM provided advice on certain study designs, inclusion/exclusion of studies, helped with quality ratings, and edited the review.
PT provided advice and guidance, rated the reliability of biochemical outcome measurements and biochemical measurements at baseline, and edited the review.
External sources of support
Cochrane Health Promotion and Public Health Field, AUSTRALIA
Published notes
This review is co-registered within the Cochrane and Campbell Collaborations.
Characteristics of included studies
Characteristics of excluded studies
References to studies
References to included studies
References to excluded studies
Other references
Additional references
Comparisons and data
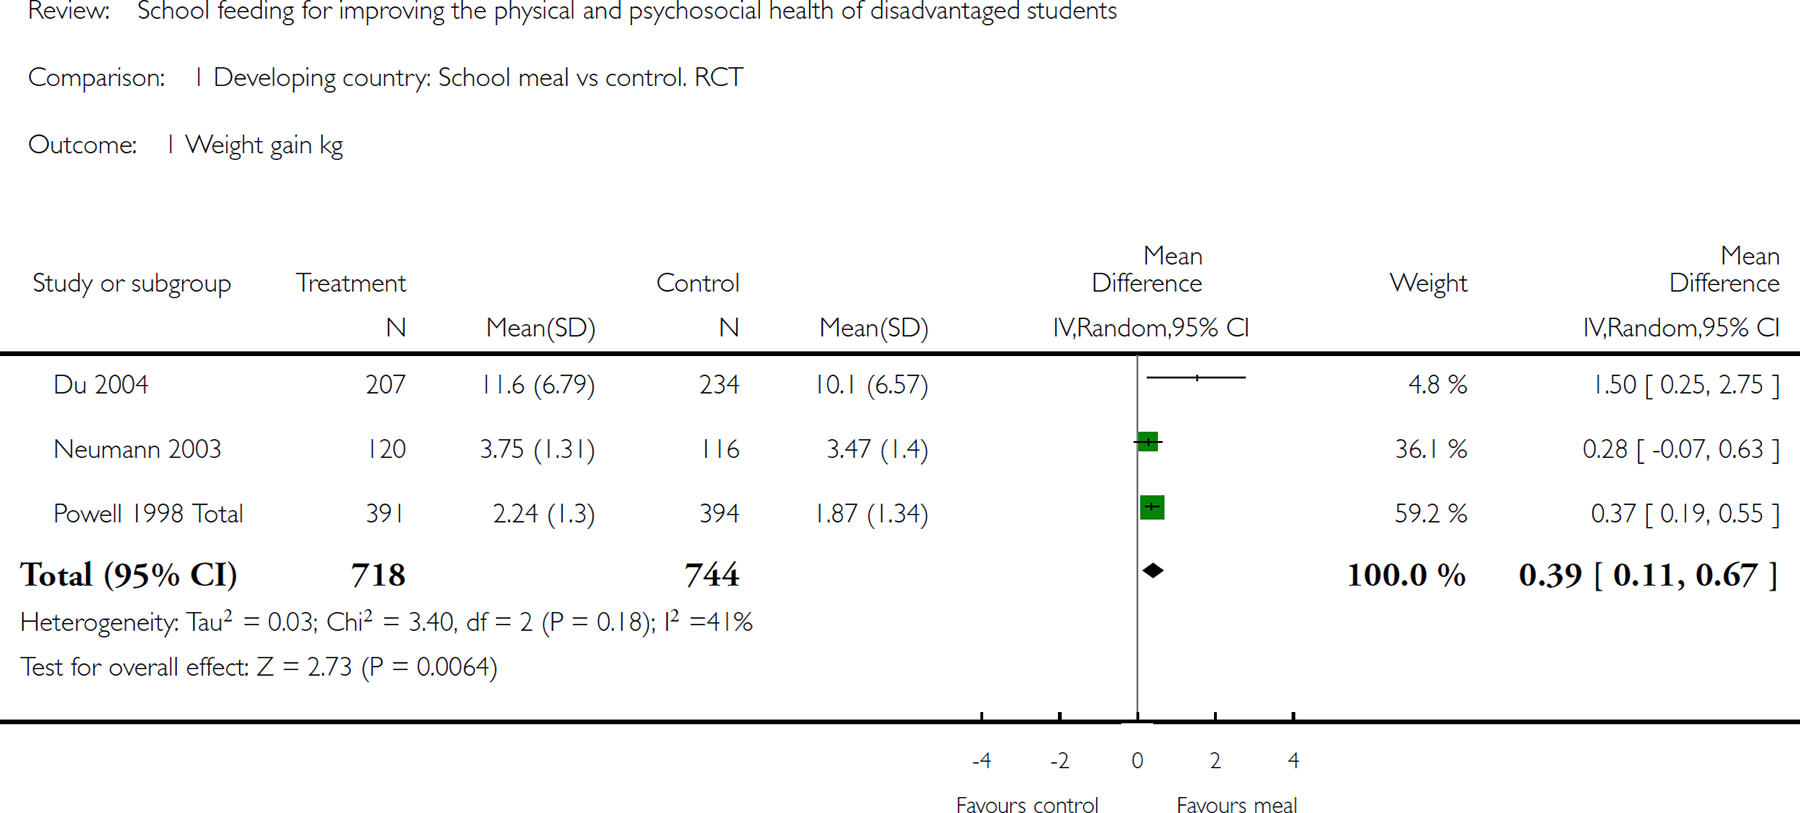
Comparison 1 Developing country: School meal vs control. RCT, Outcome 1Weight gain kg.
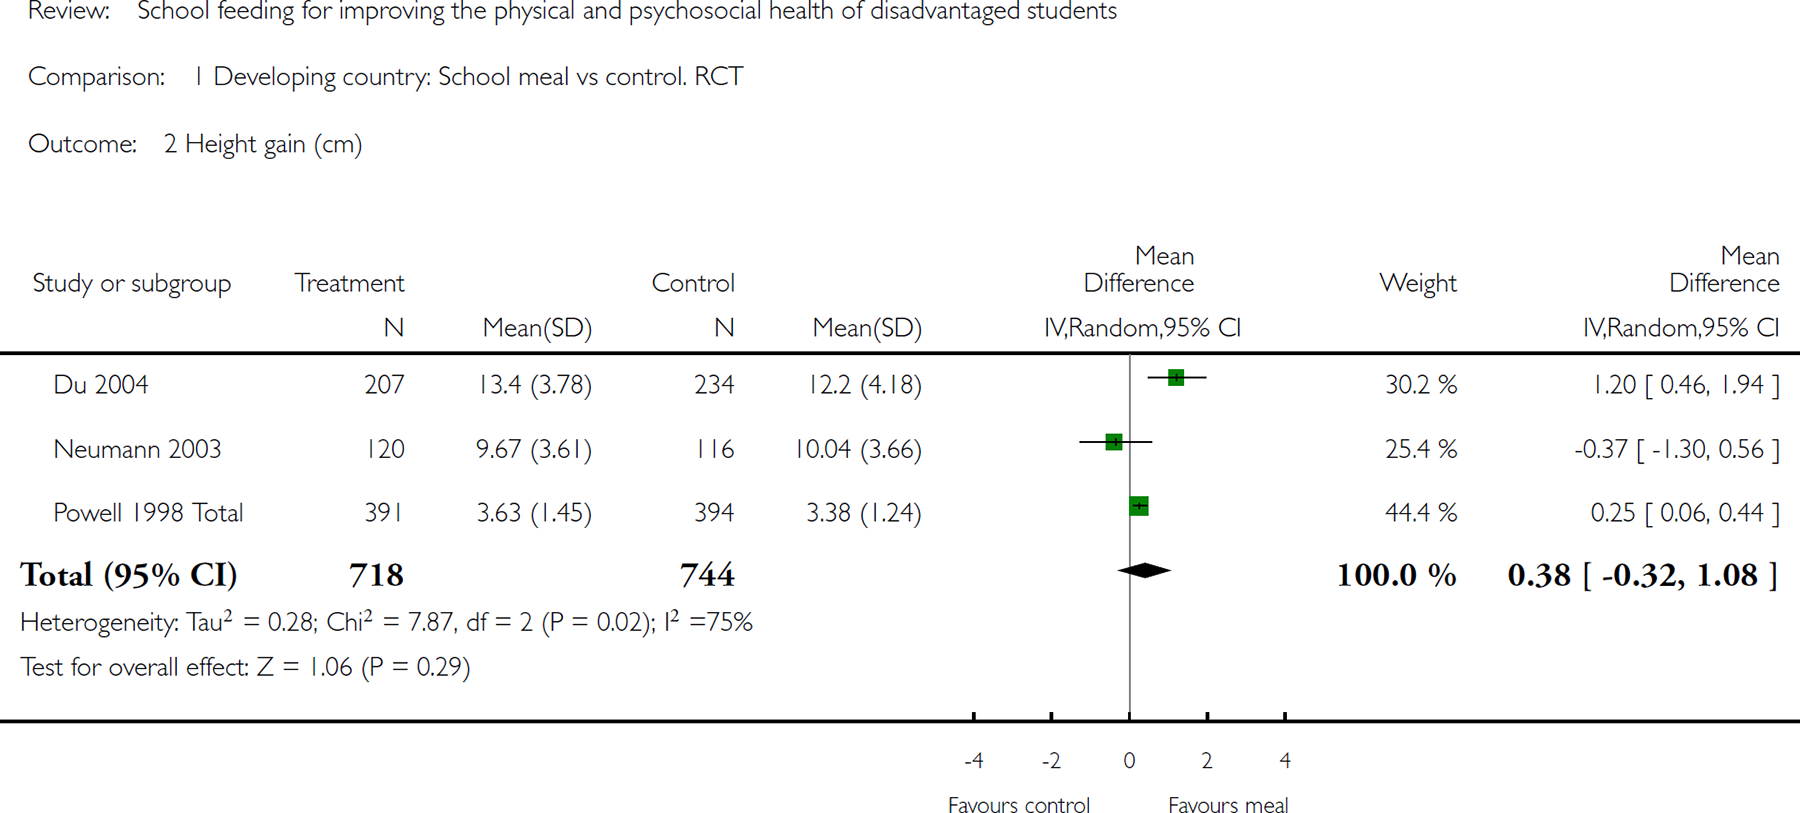
Comparison 1 Developing country: School meal vs control. RCT, Outcome 2 Height gain (cm).
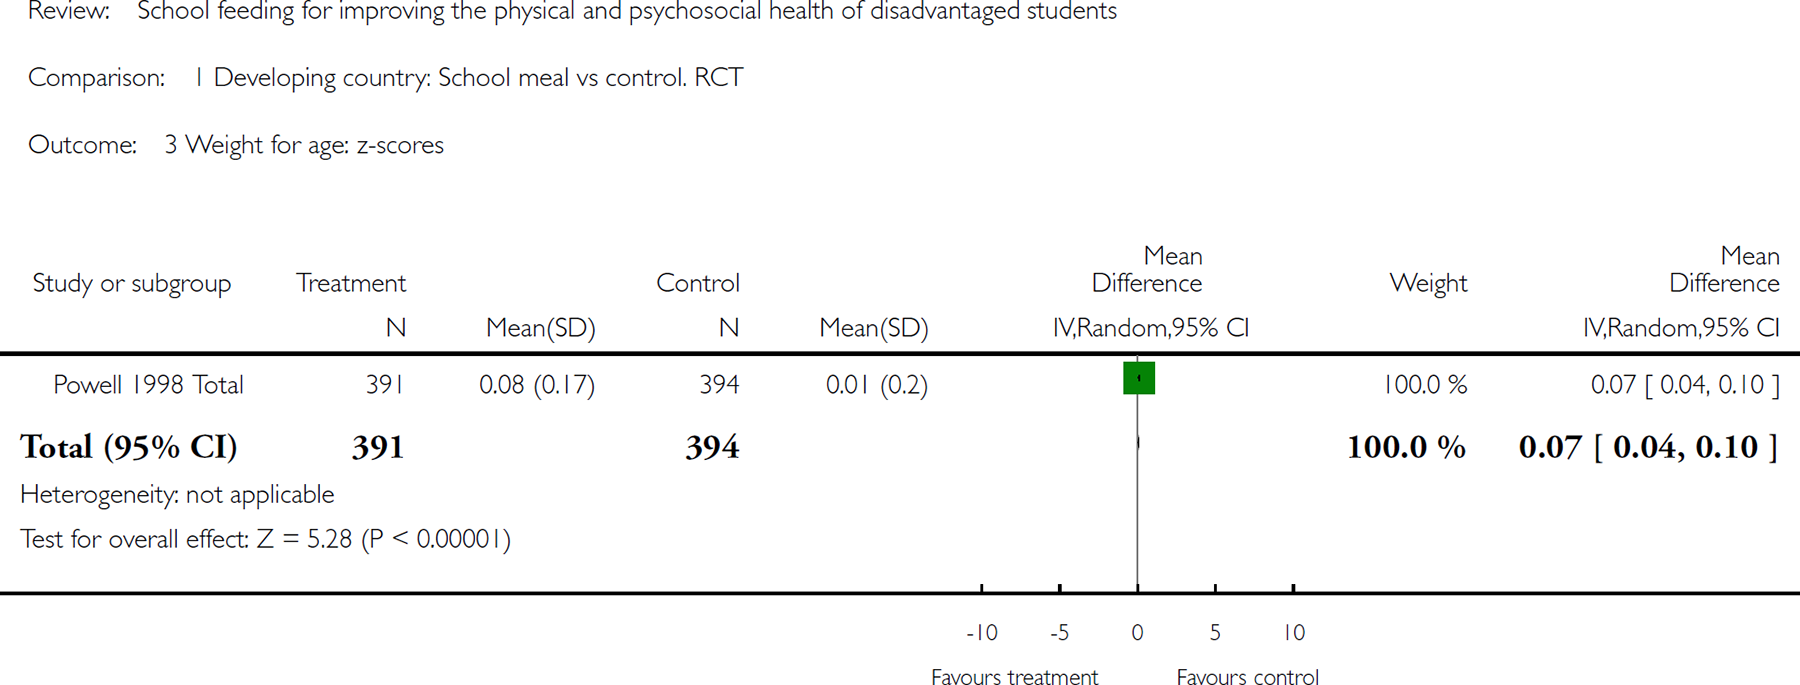
Comparison 1 Developing country: School meal vs control. RCT, Outcome 3Weight for age: z-scores.
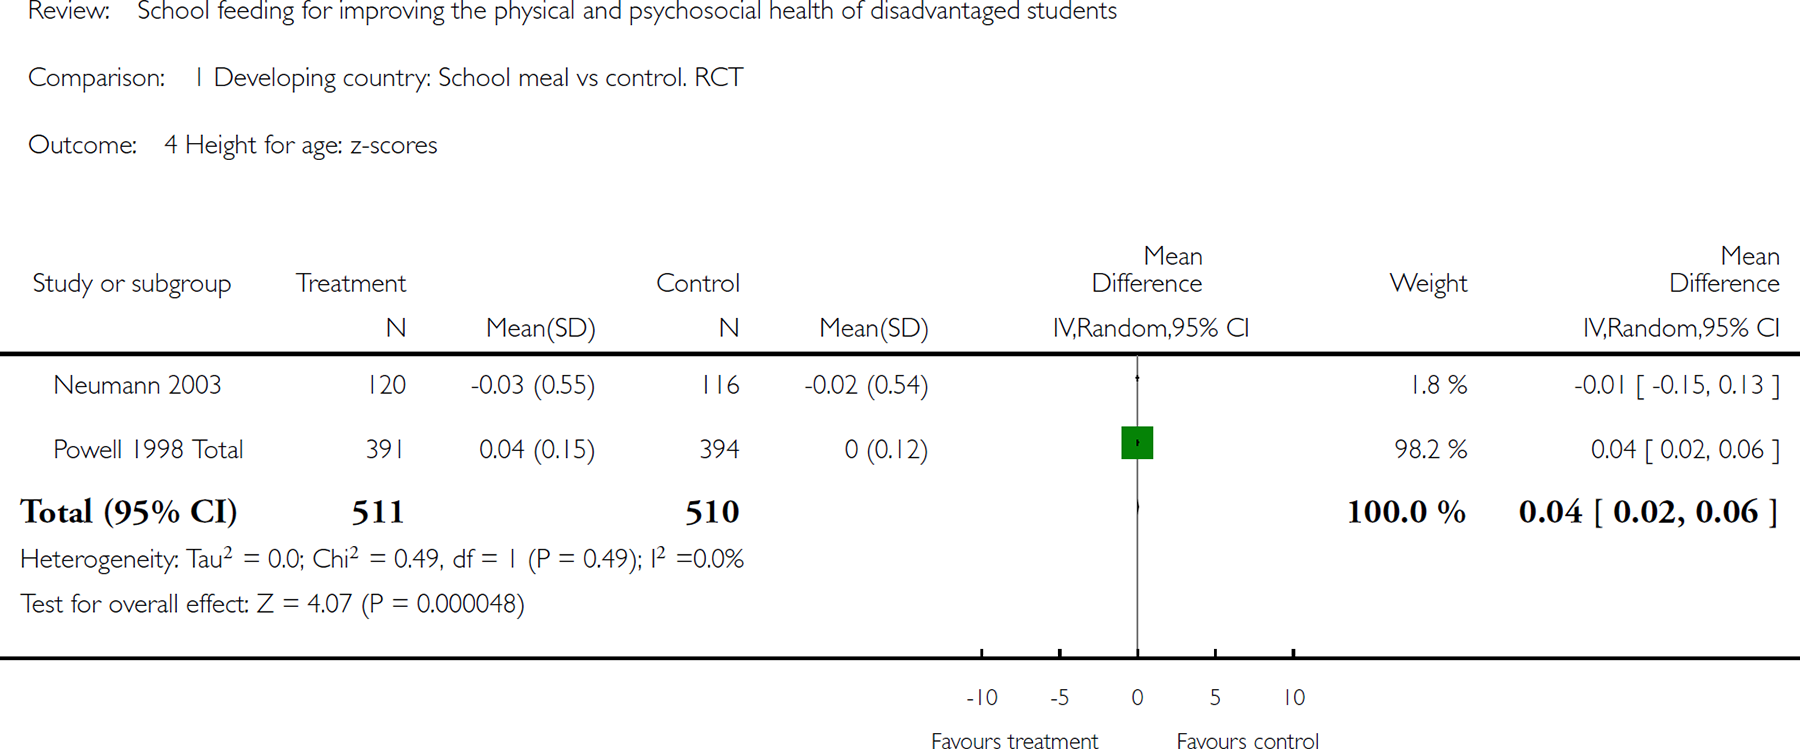
Comparison 1 Developing country: School meal vs control. RCT, Outcome 4 Height for age: zscores.
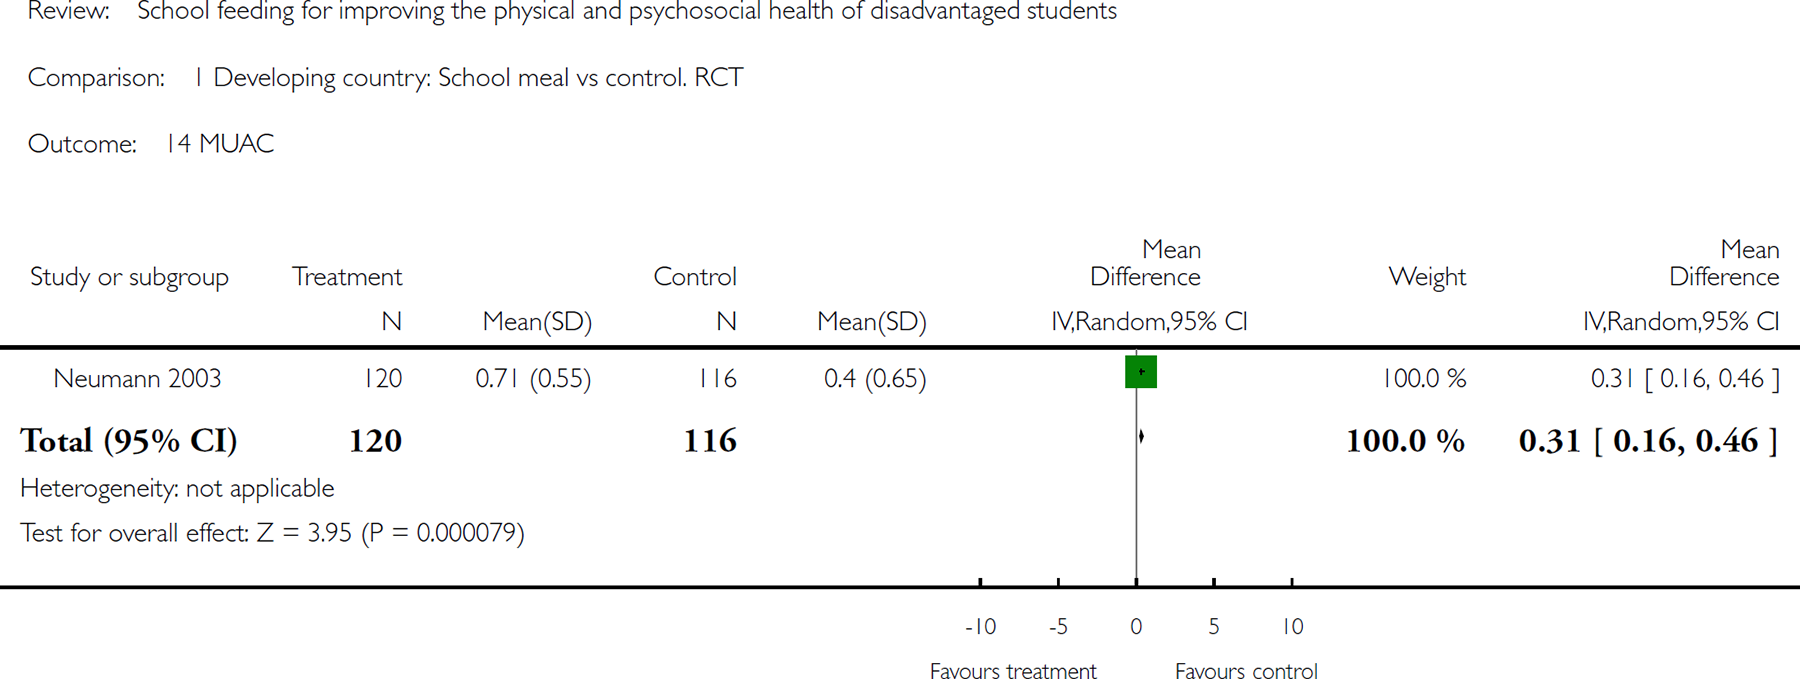
Comparison 1 Developing country: School meal vs control. RCT, Outcome 14 MUAC.
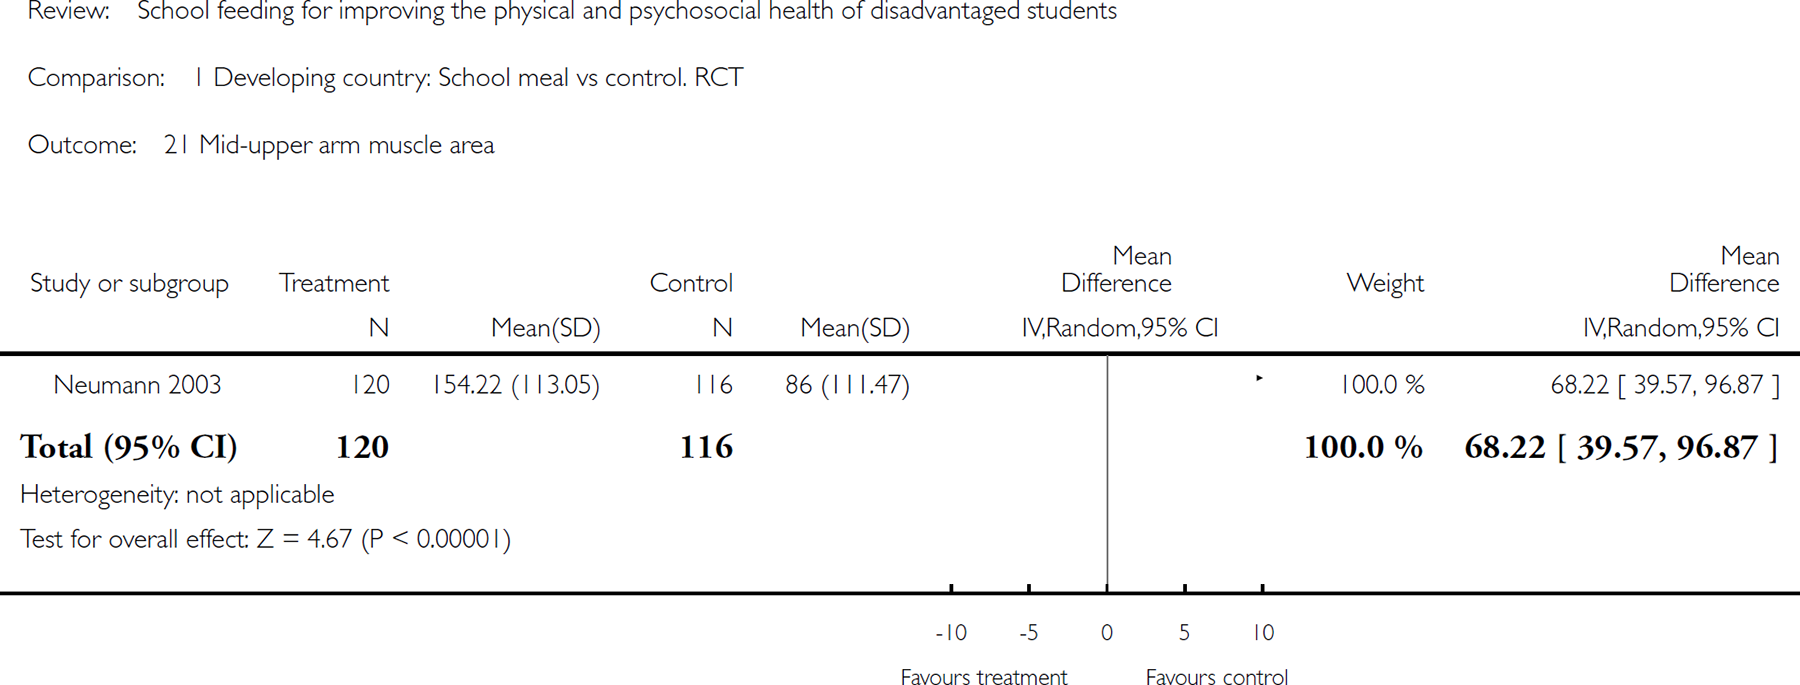
Comparison 1 Developing country: School meal vs control. RCT, Outcome 21 Mid-upper arm muscle area.
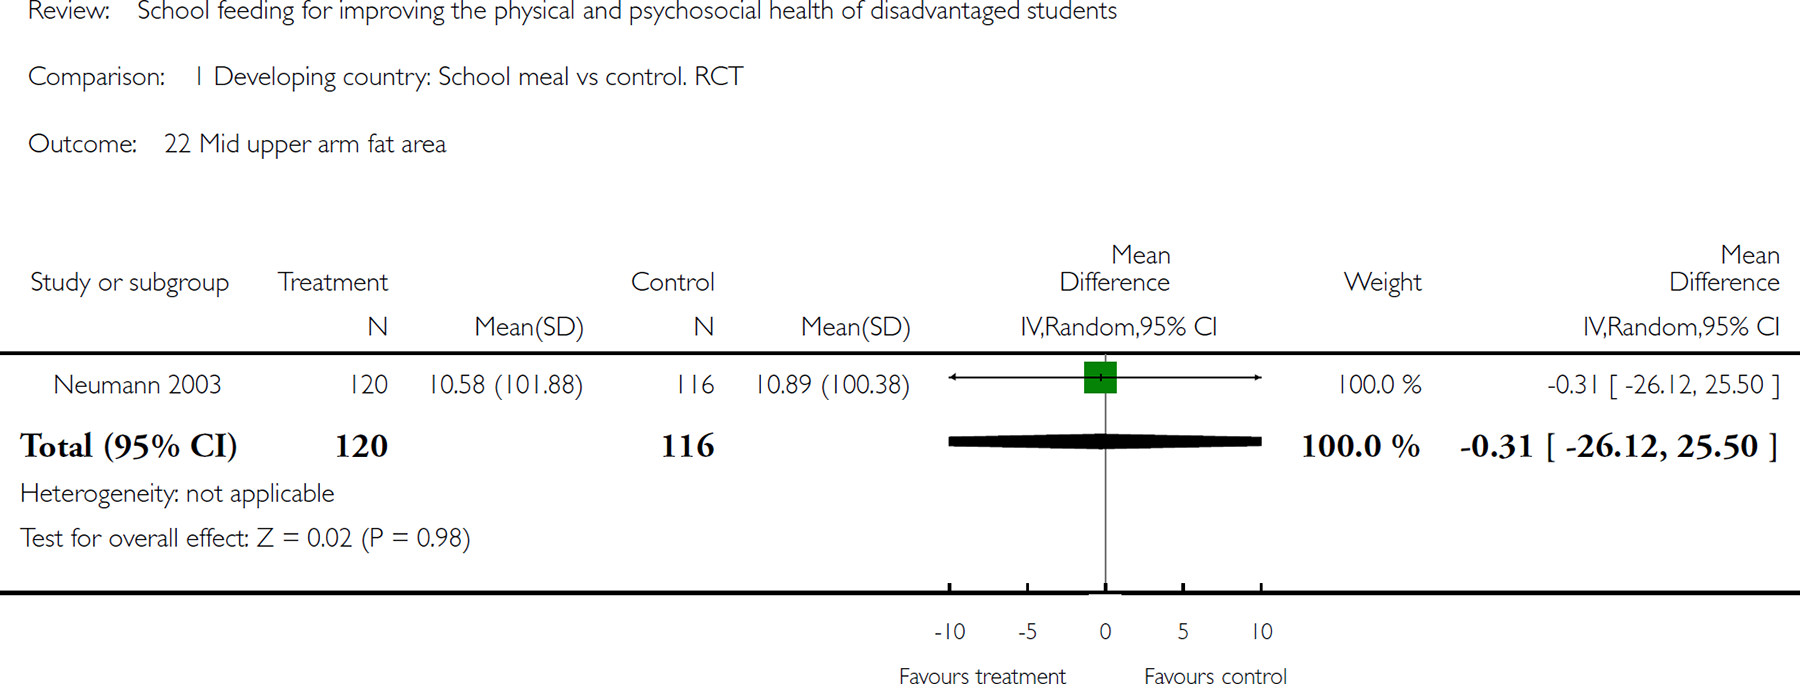
Comparison 1 Developing country: School meal vs control. RCT, Outcome 22 Mid upper arm fat area.
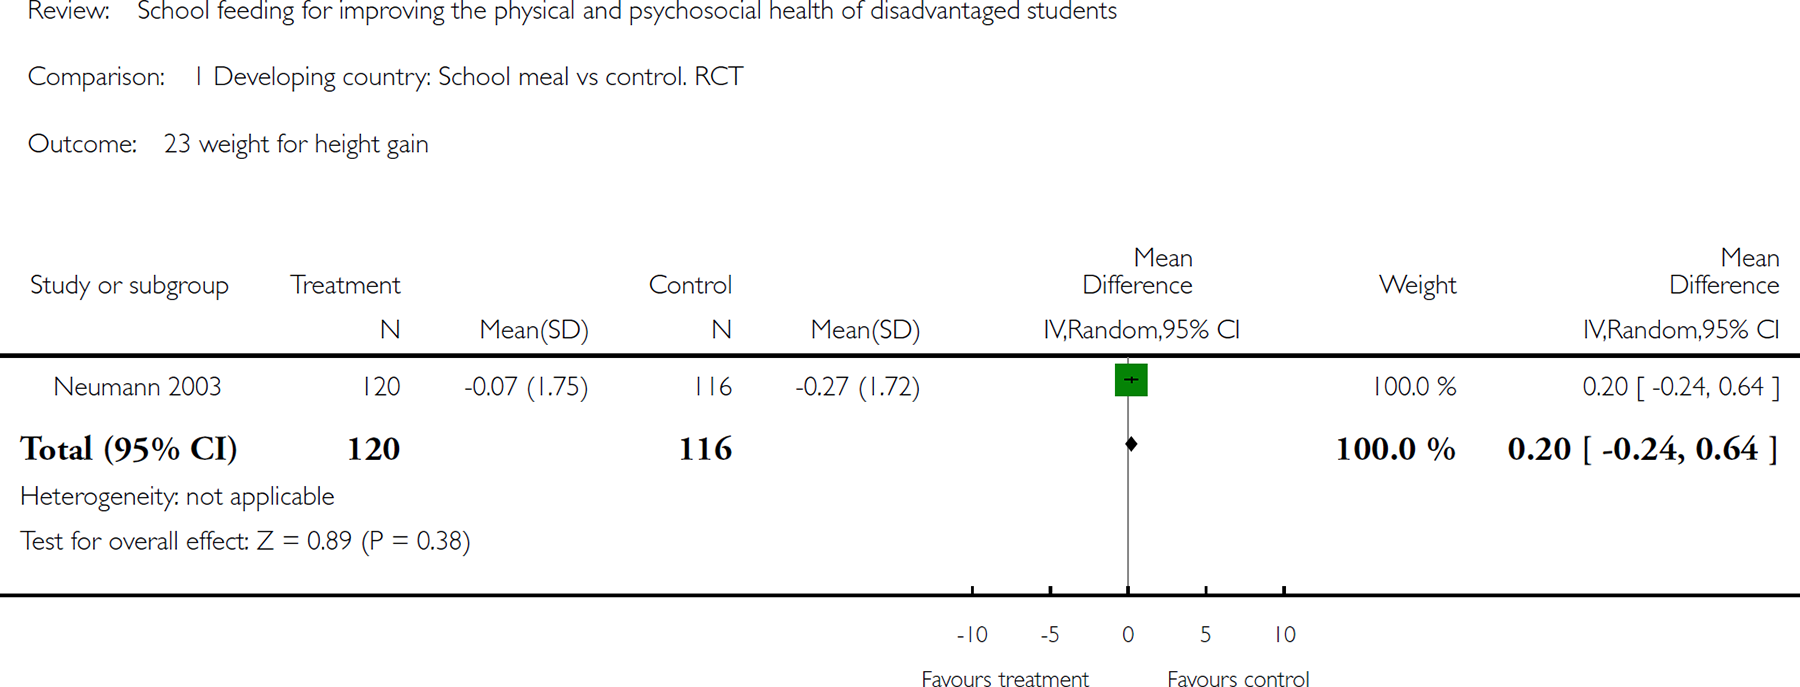
Comparison 1 Developing country: School meal vs control. RCT, Outcome 23 weight for height gain.
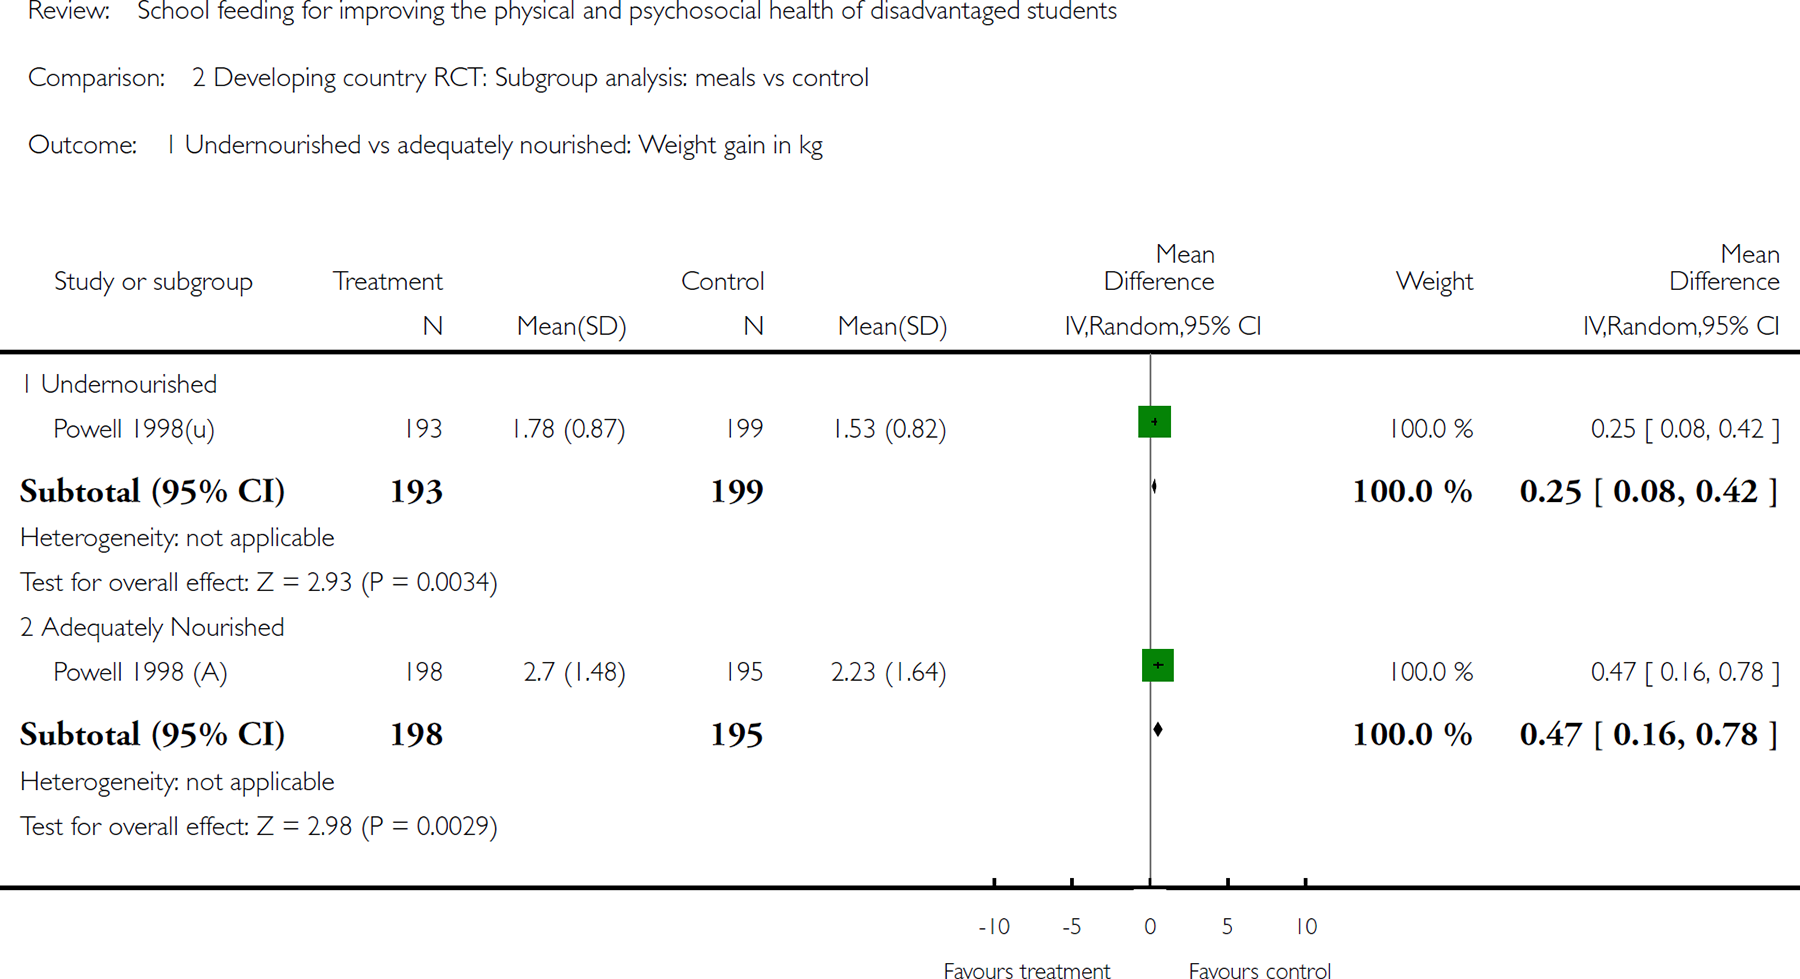
Comparison 2 Developing country RCT: Subgroup analysis: meals vs control, Outcome 1 Undernourished vs adequately nourished: Weight gain in kg.
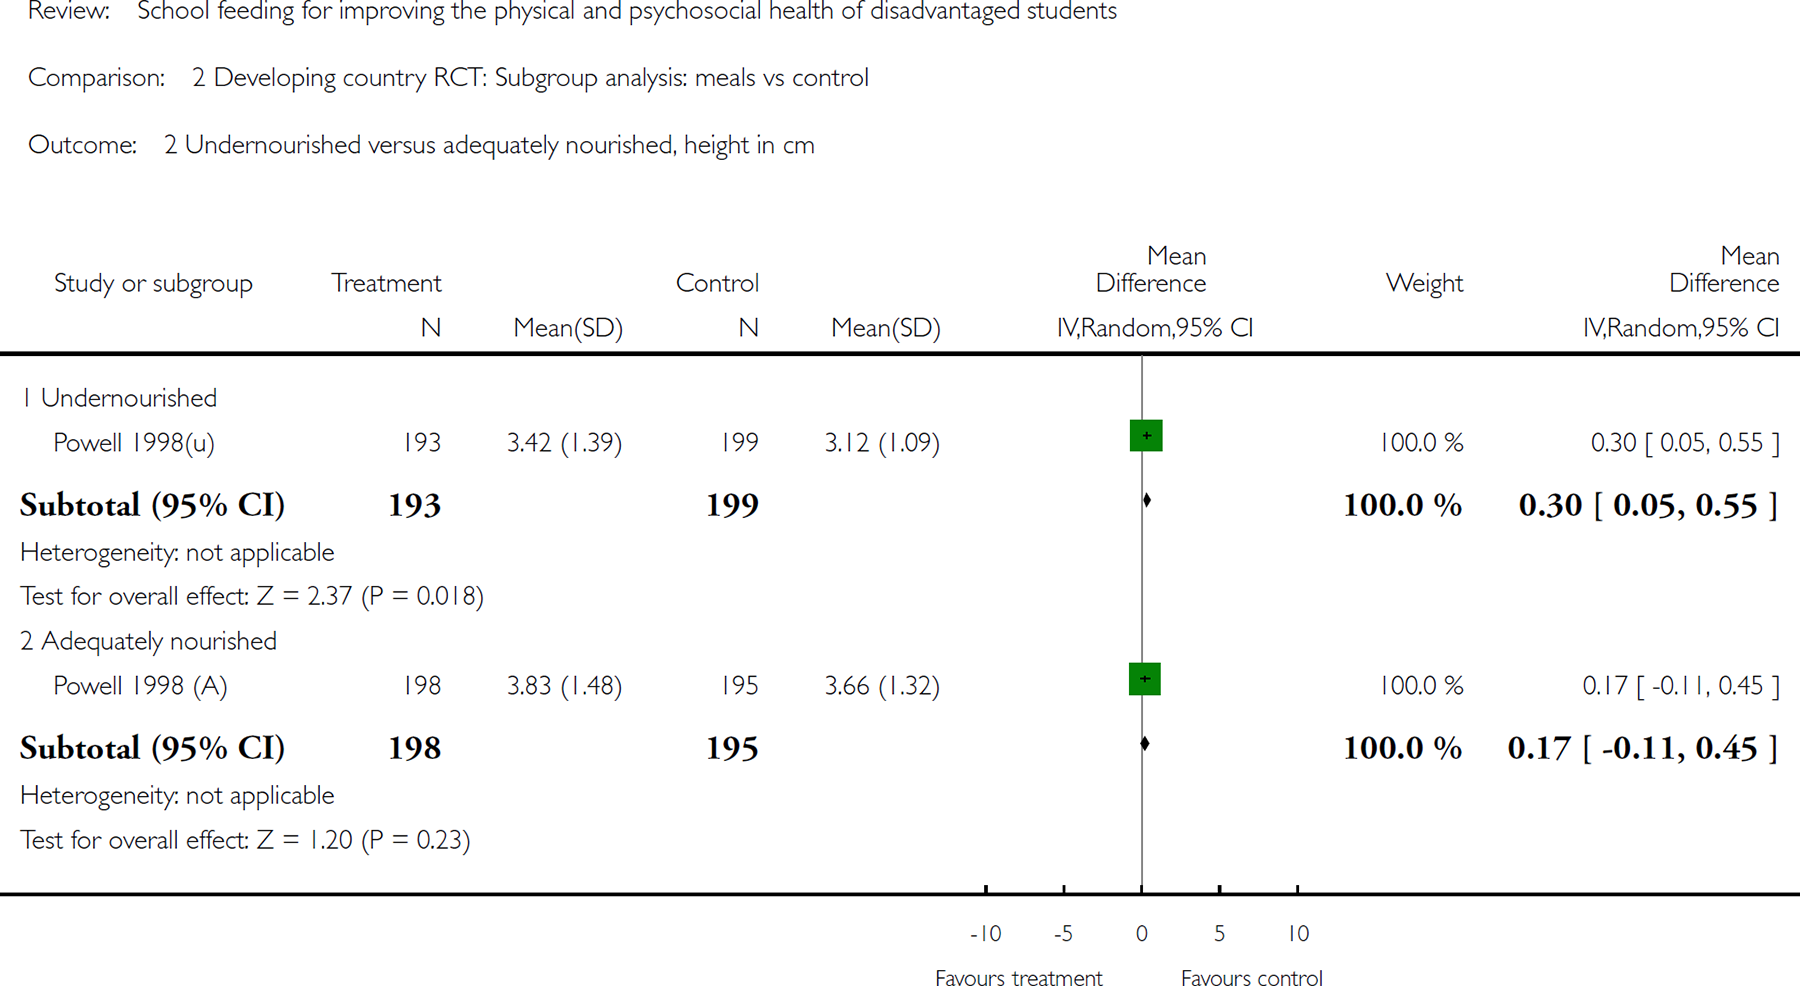
Comparison 2 Developing country RCT: Subgroup analysis: meals vs control, Outcome 2 Undernourished versus adequately nourished, height in cm.
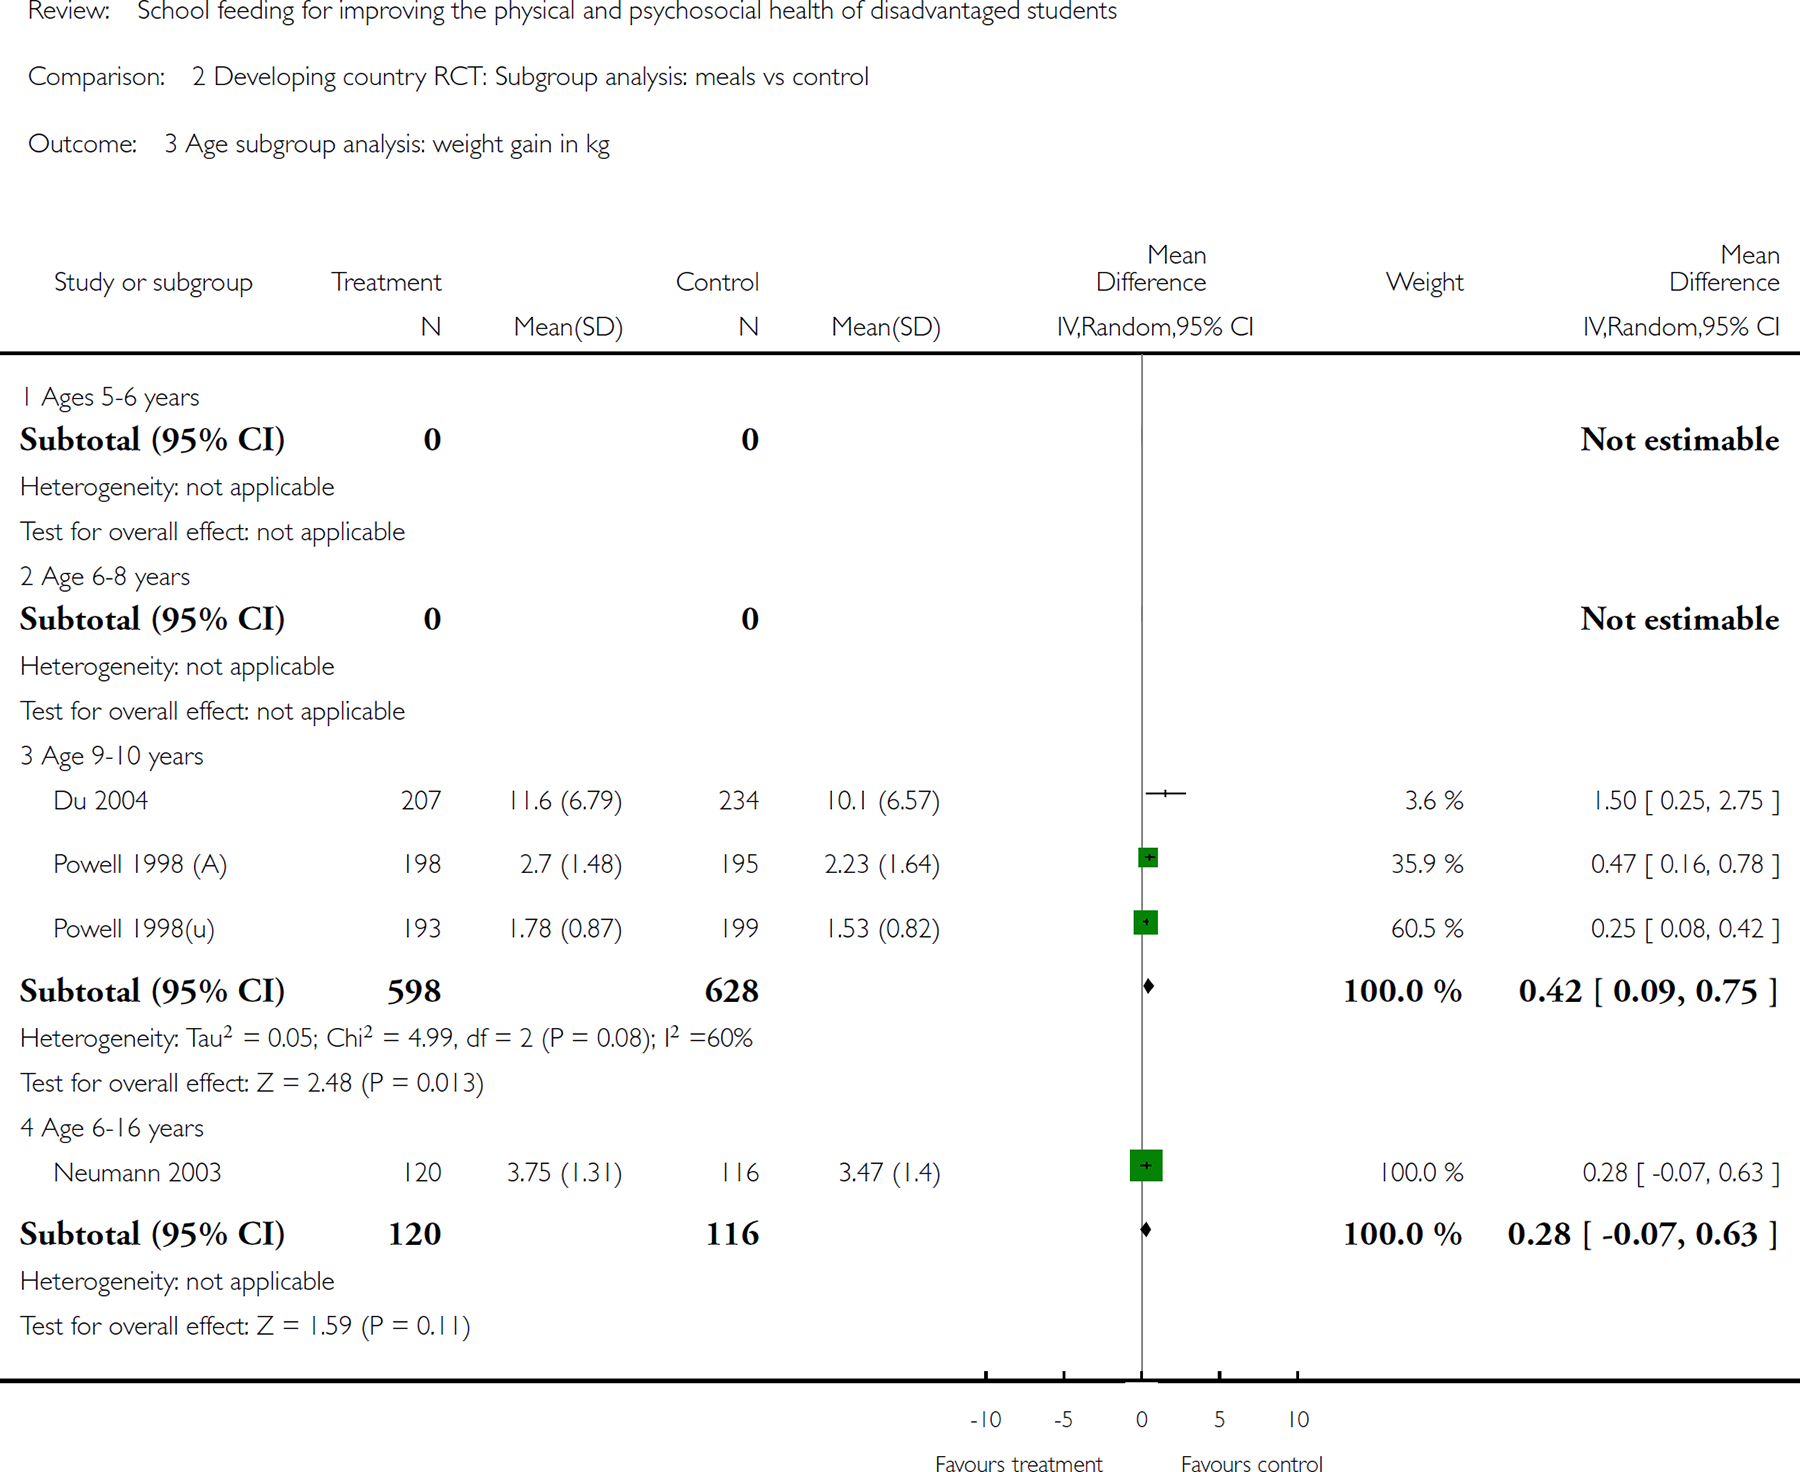
Comparison 2 Developing country RCT: Subgroup analysis: meals vs control, Outcome 3 Age subgroup analysis: weight gain in kg.
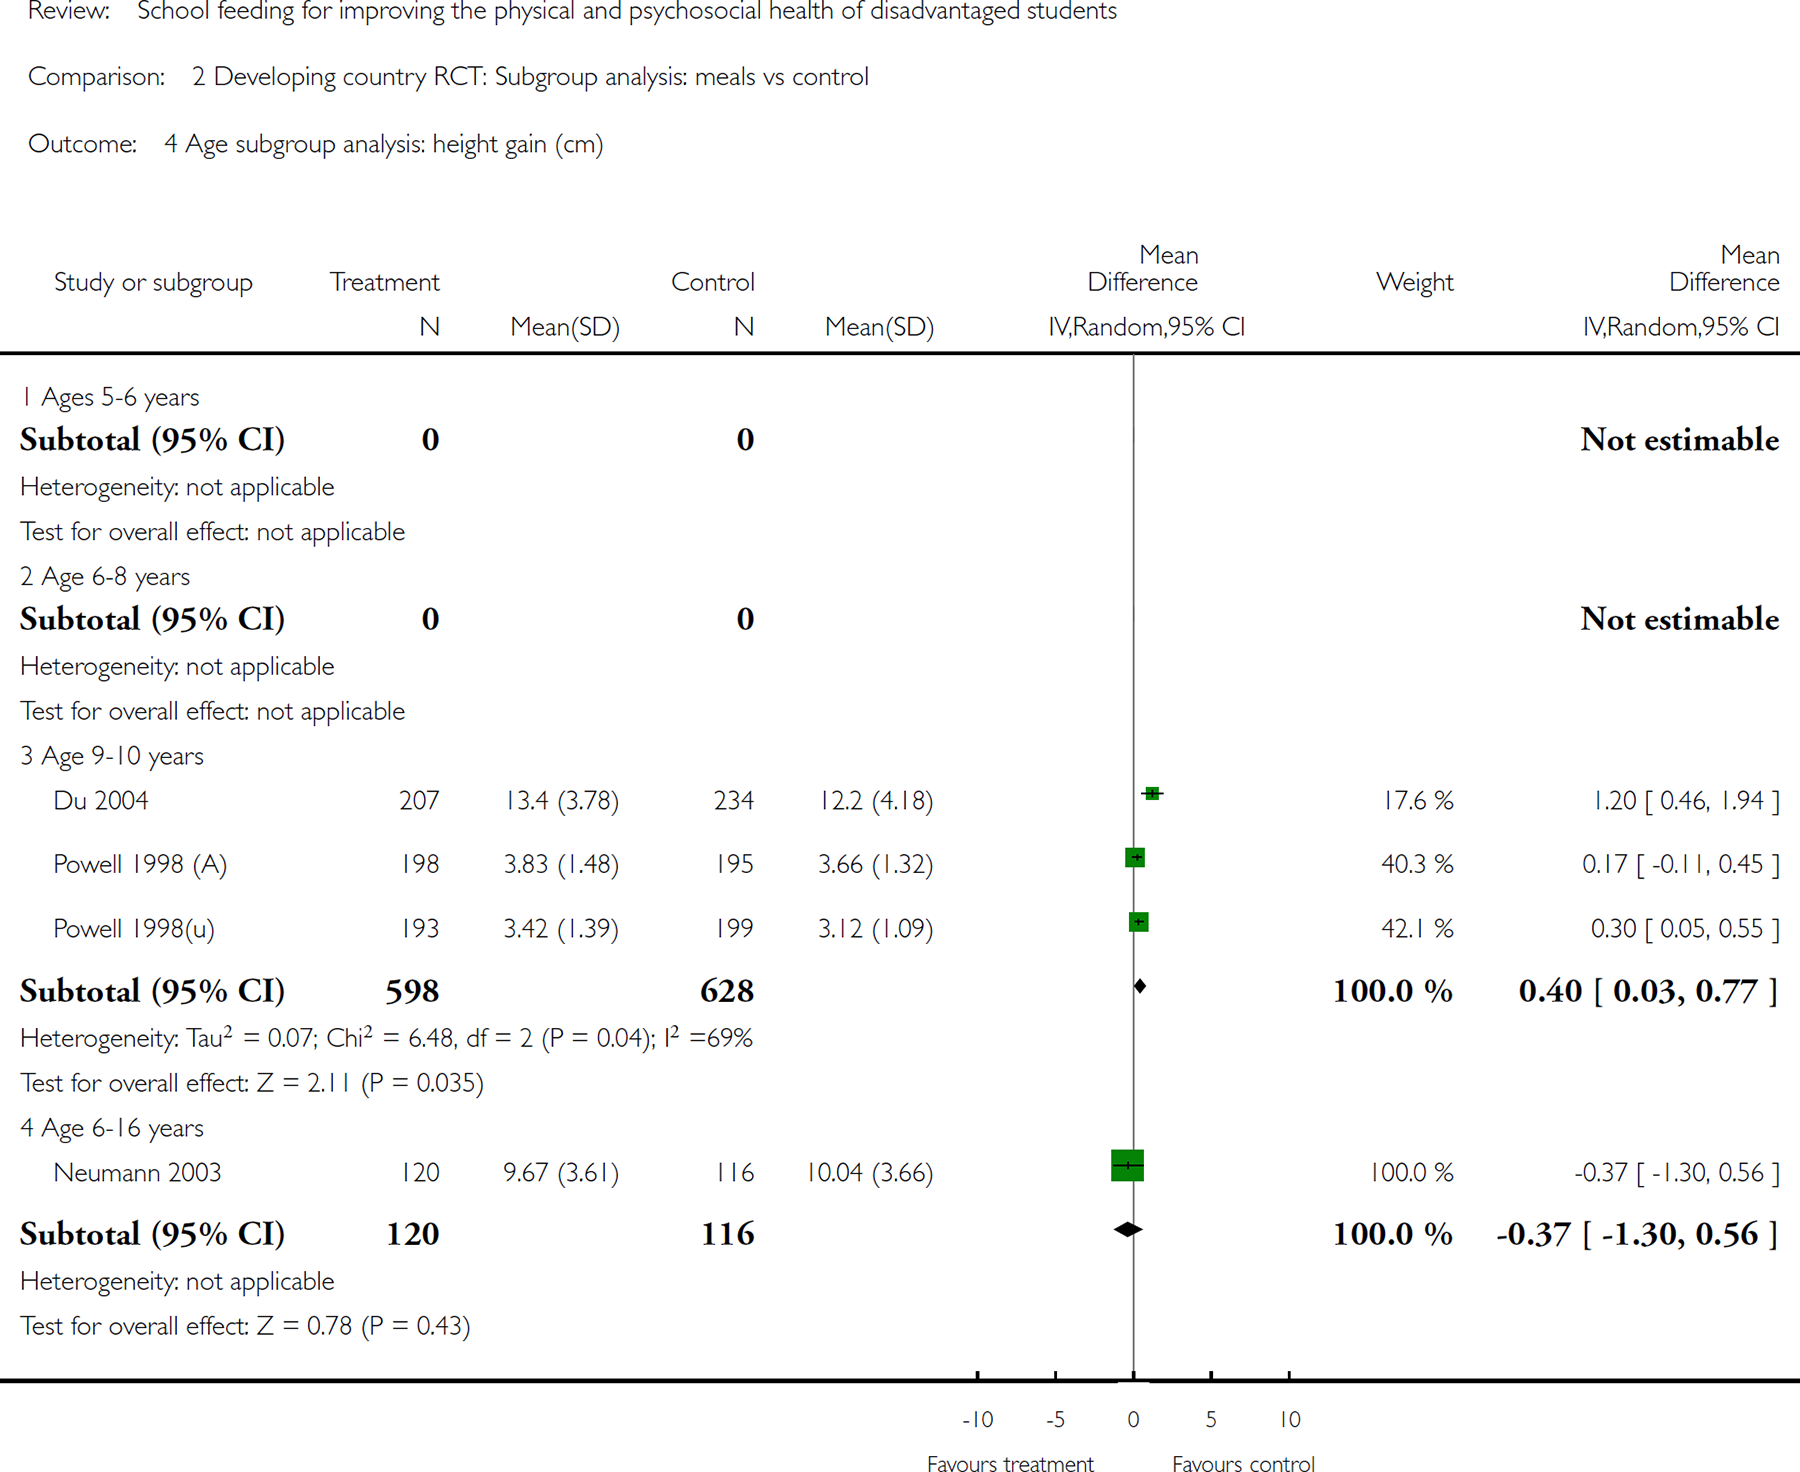
Comparison 2 Developing country RCT: Subgroup analysis: meals vs control, Outcome 4 Age subgroup analysis: height gain (cm).
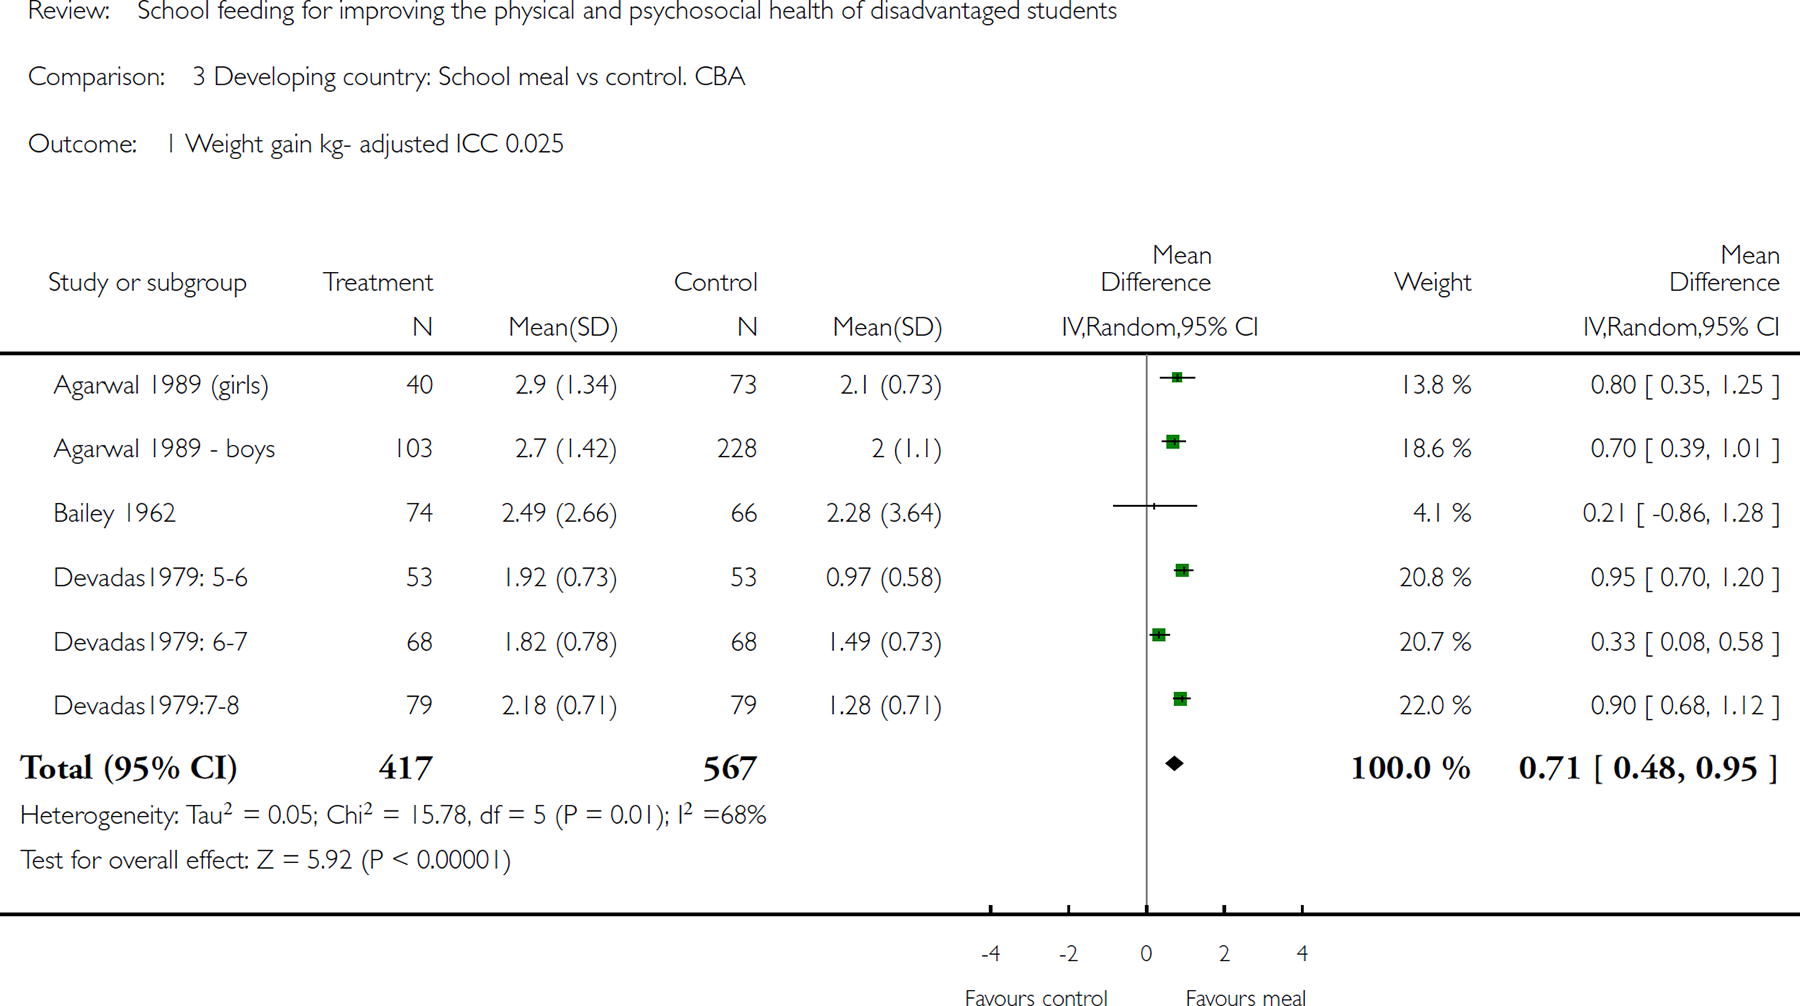
Comparison 3 Developing country: School meal vs control. CBA, Outcome 1Weight gain kgadjusted ICC 0.025.
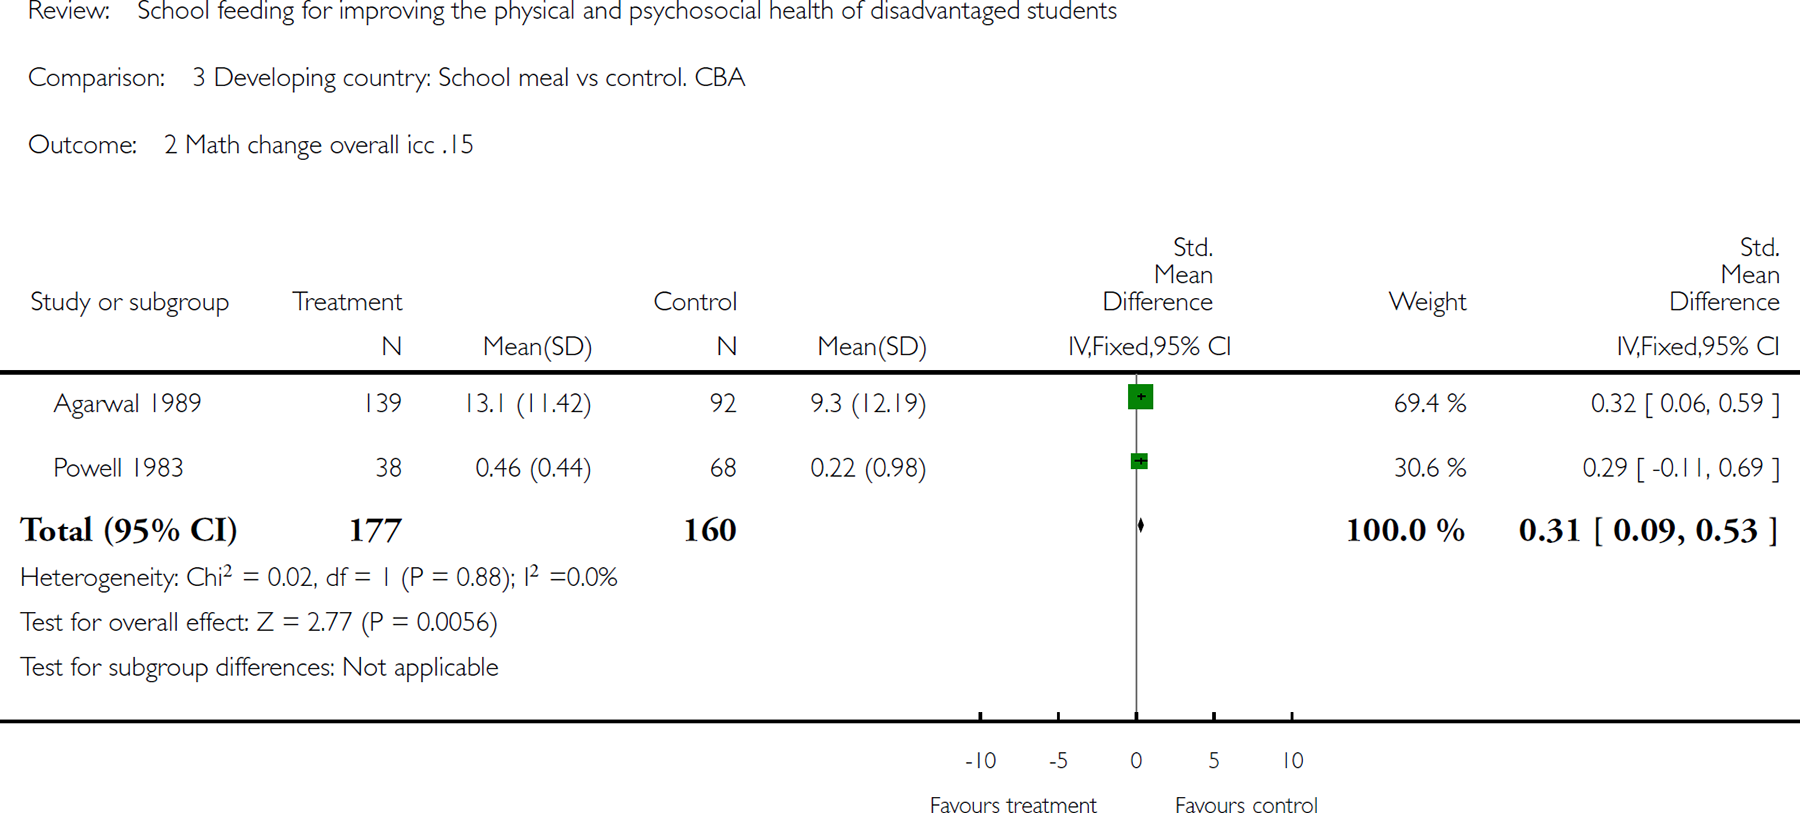
Comparison 3 Developing country: School meal vs control. CBA, Outcome 2 Math change overall icc .15.
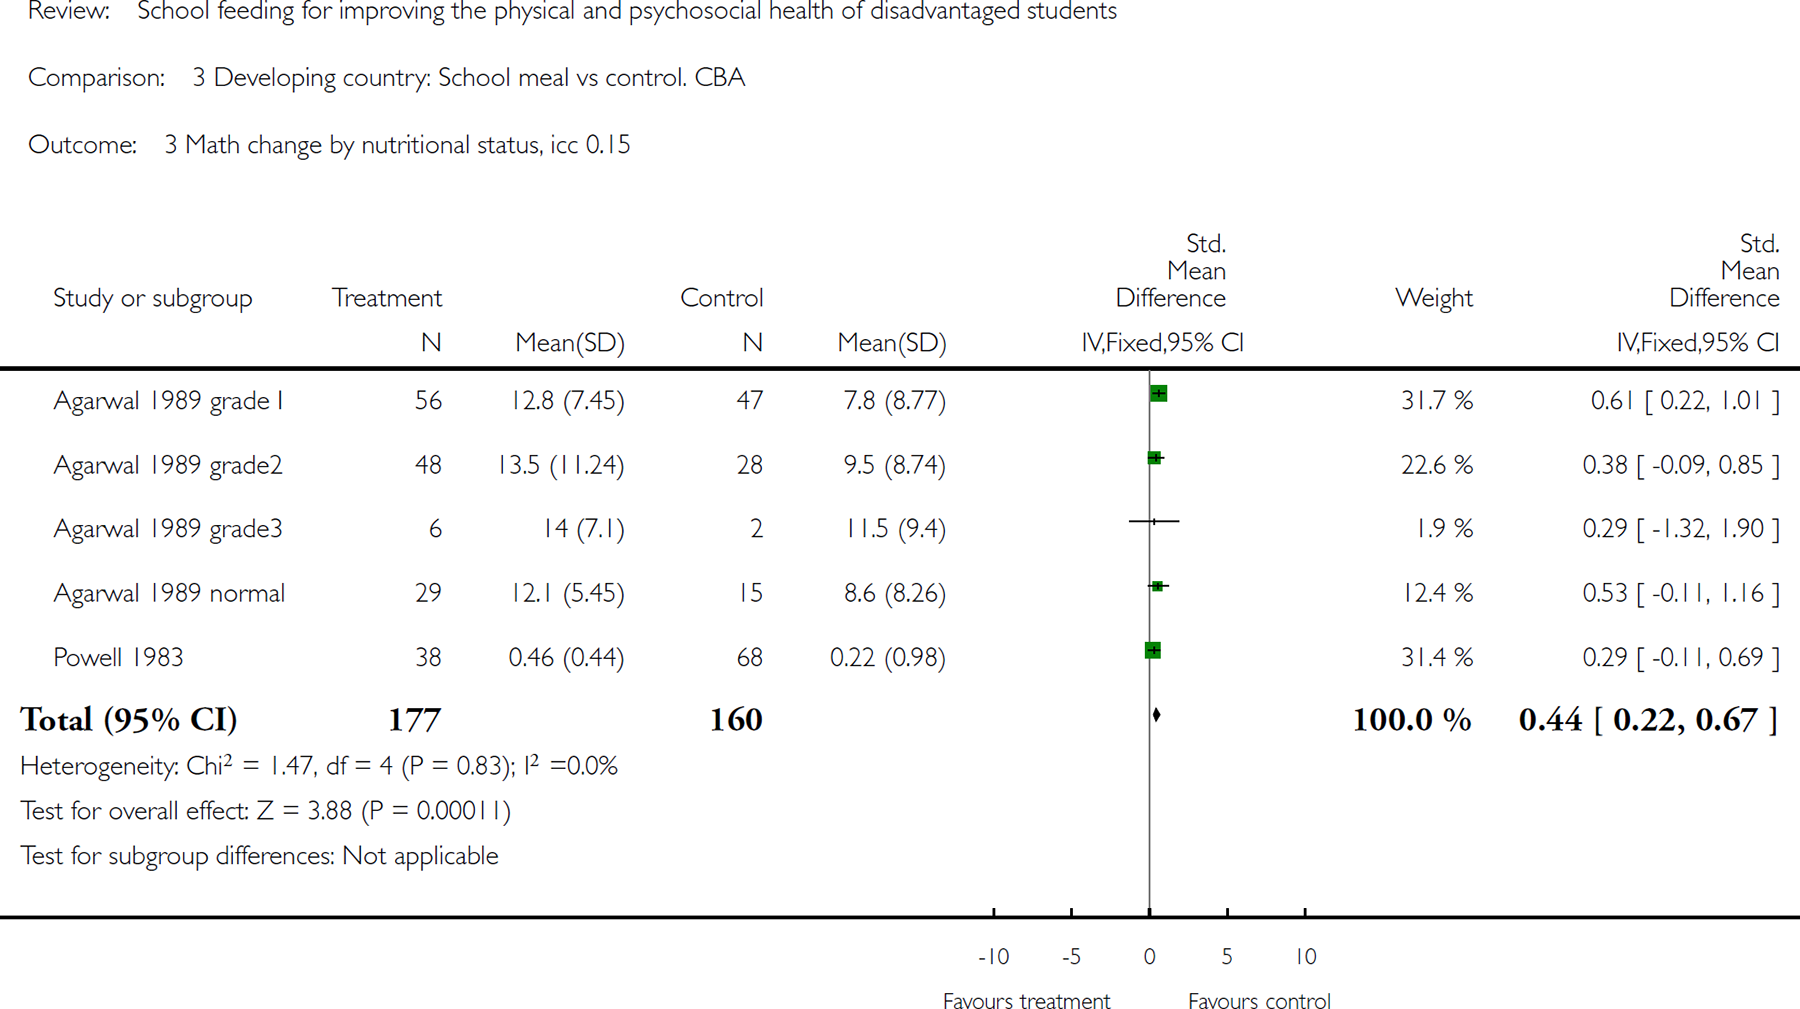
Comparison 3 Developing country: School meal vs control. CBA, Outcome 3 Math change by nutritional status, icc 0.15.
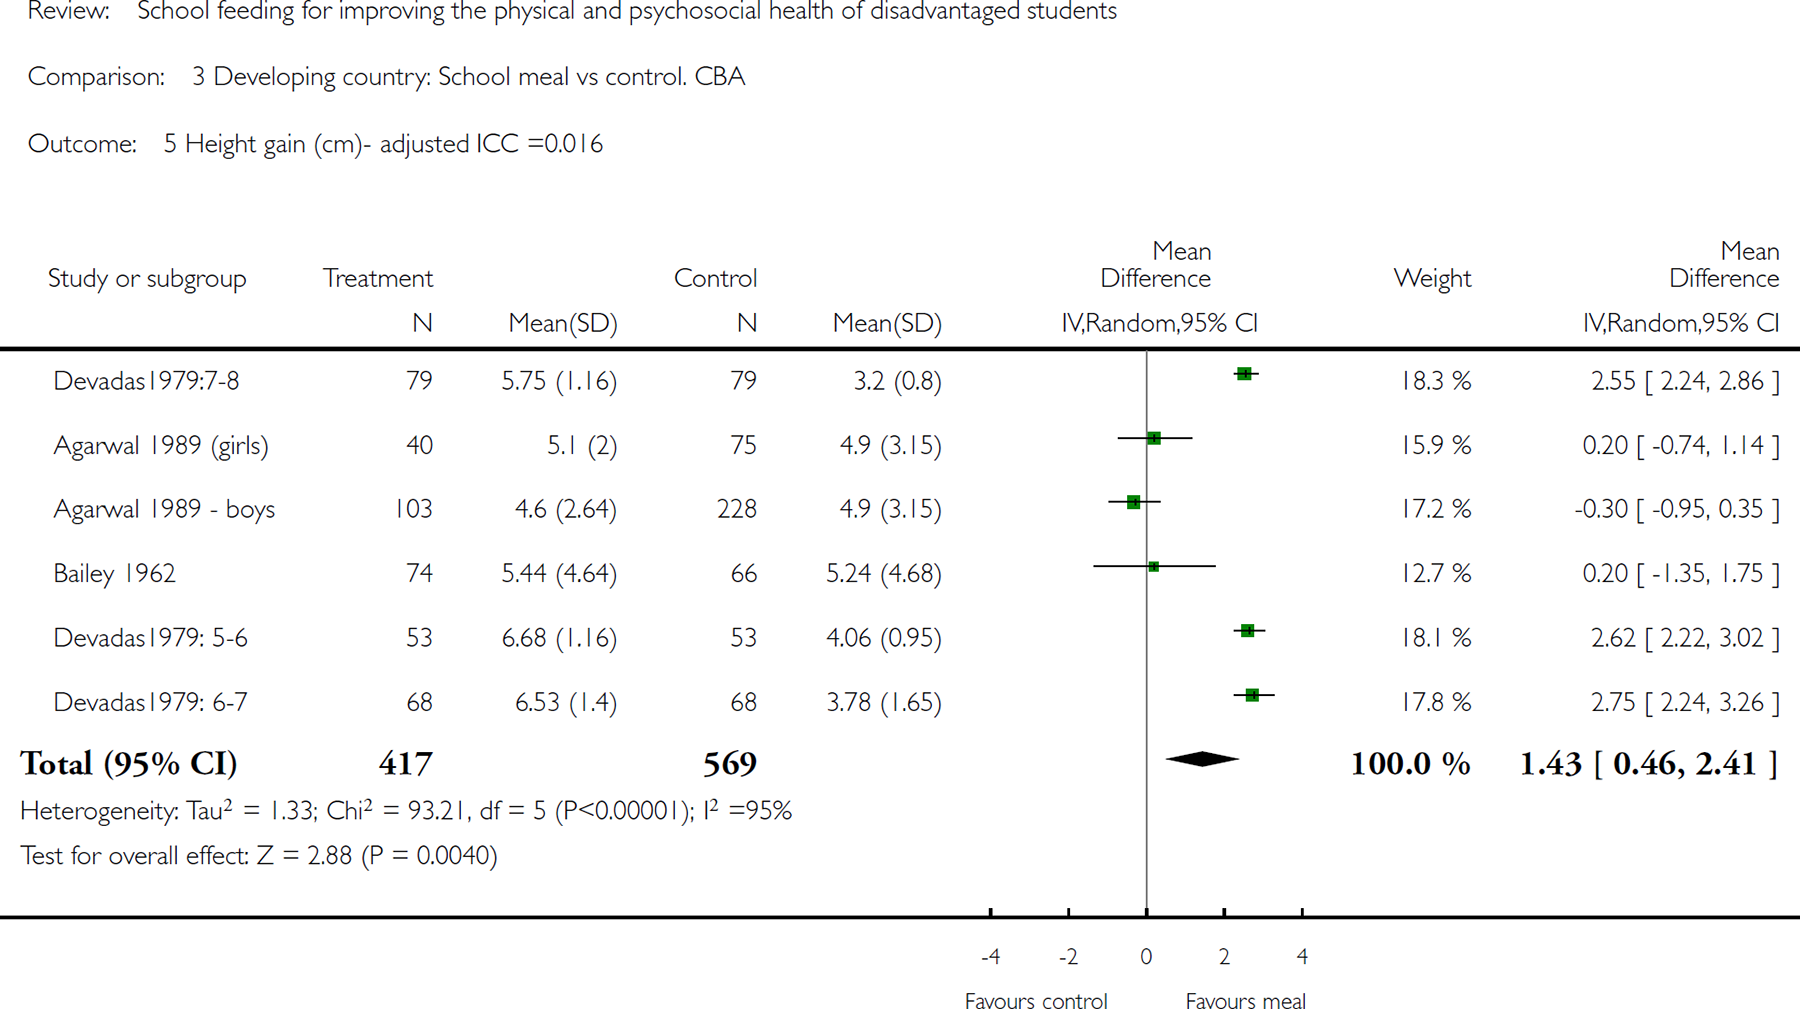
Comparison 3 Developing country: School meal vs control. CBA, Outcome 5 Height gain (cm)- adjusted ICC =0.016.
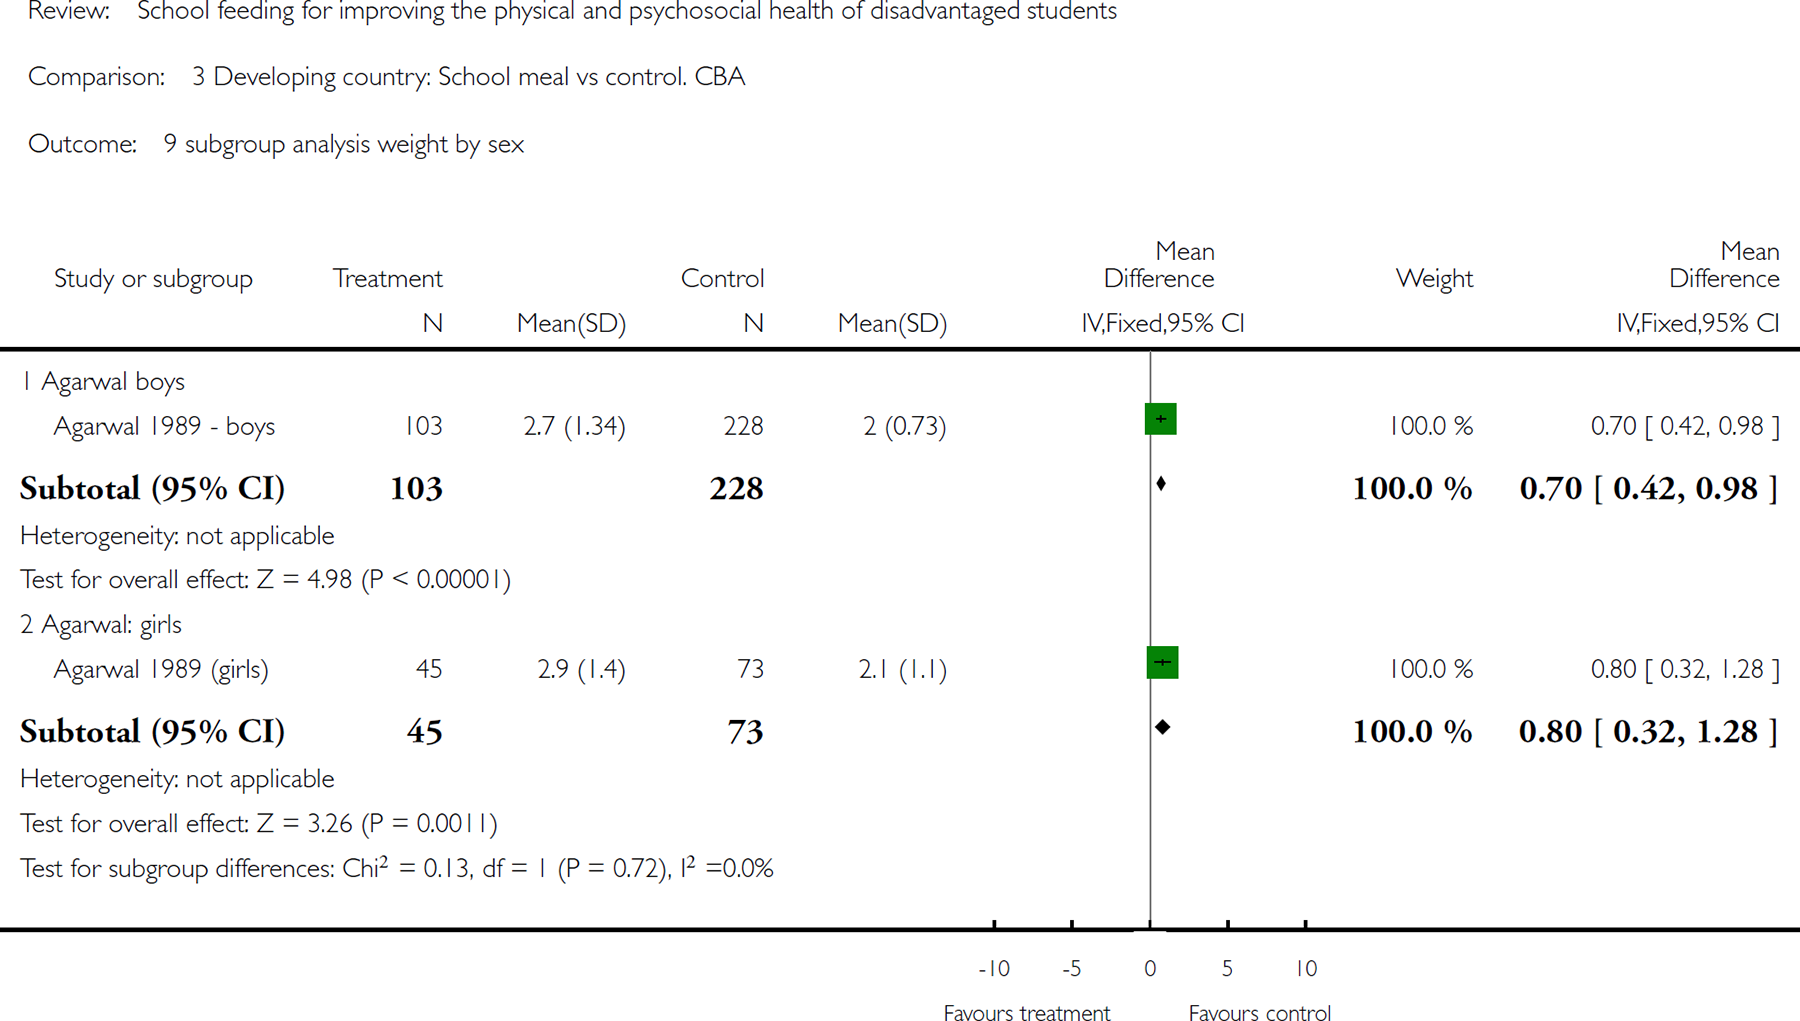
Comparison 3 Developing country: School meal vs control. CBA, Outcome 9 subgroup analysis weight by sex.
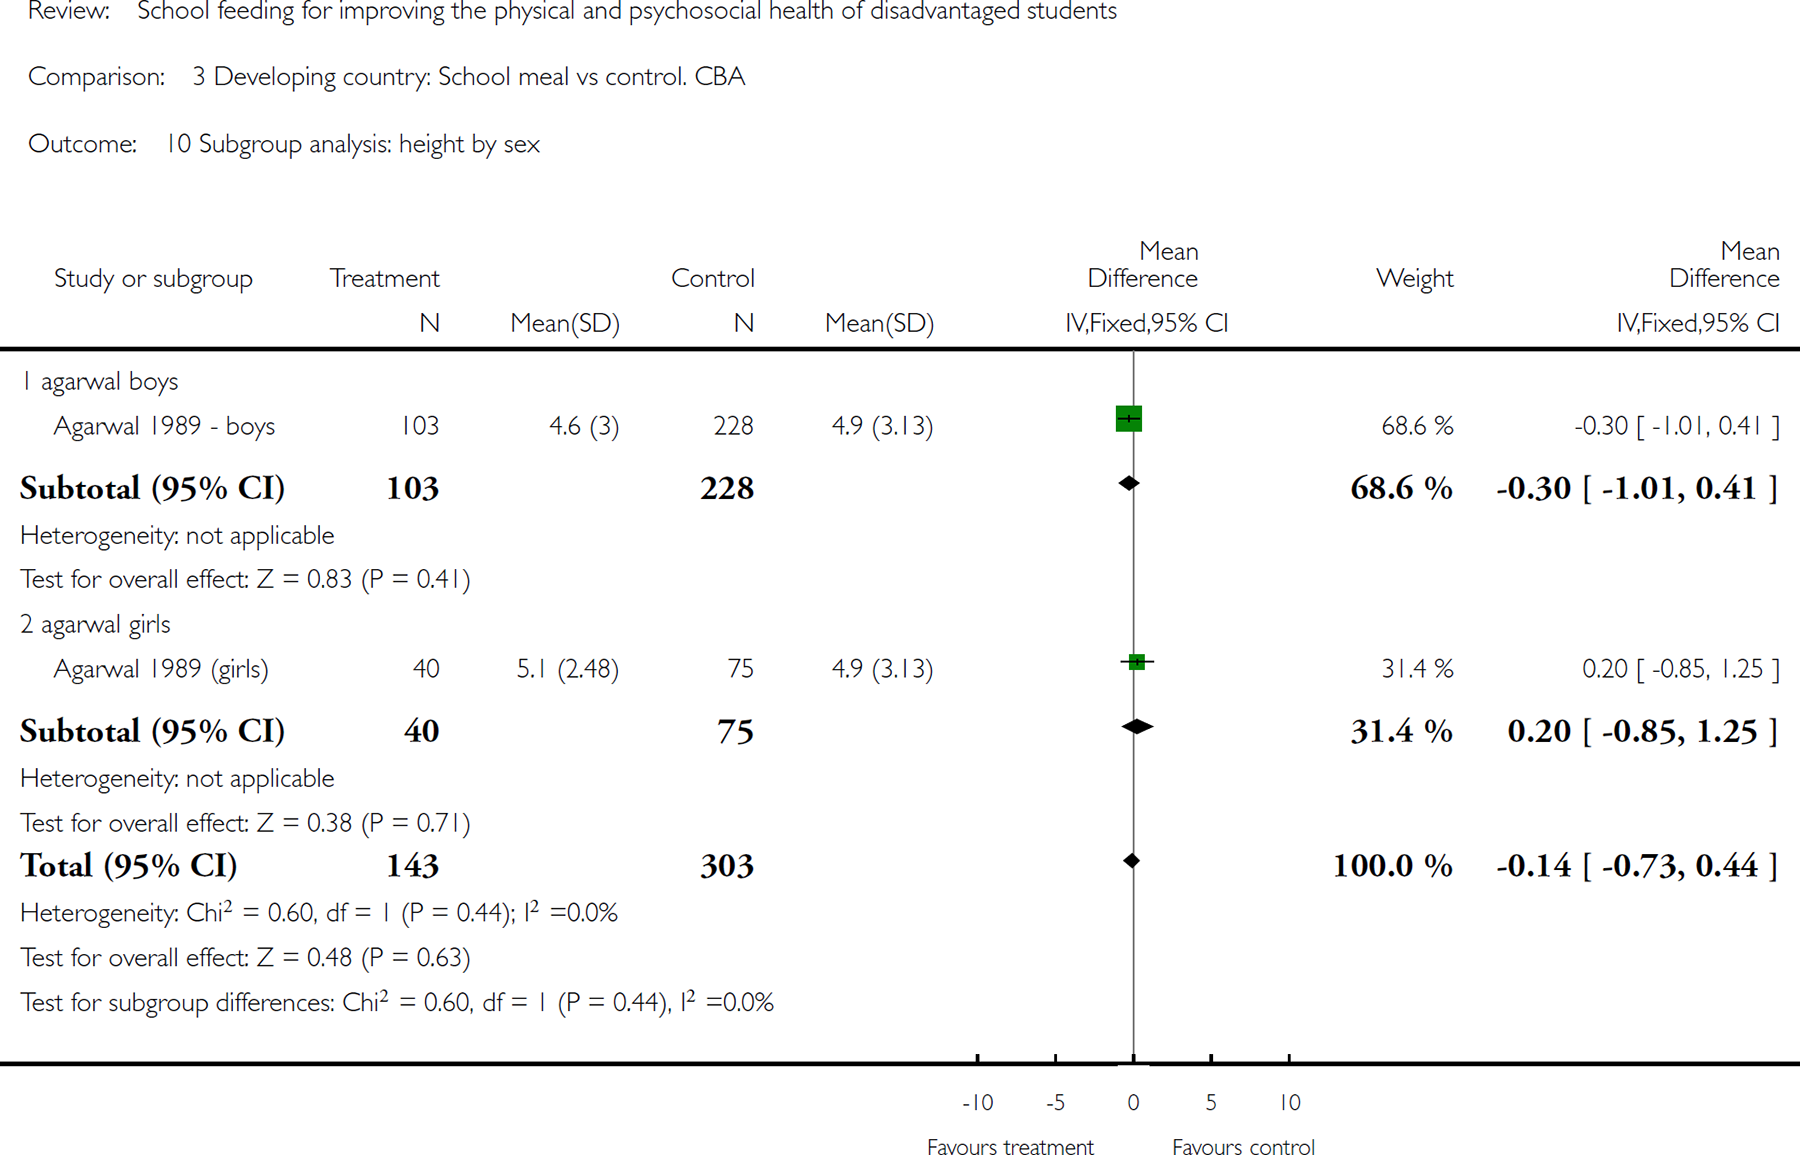
Comparison 3 Developing country: School meal vs control. CBA, Outcome 10 Subgroup analysis: height by sex.
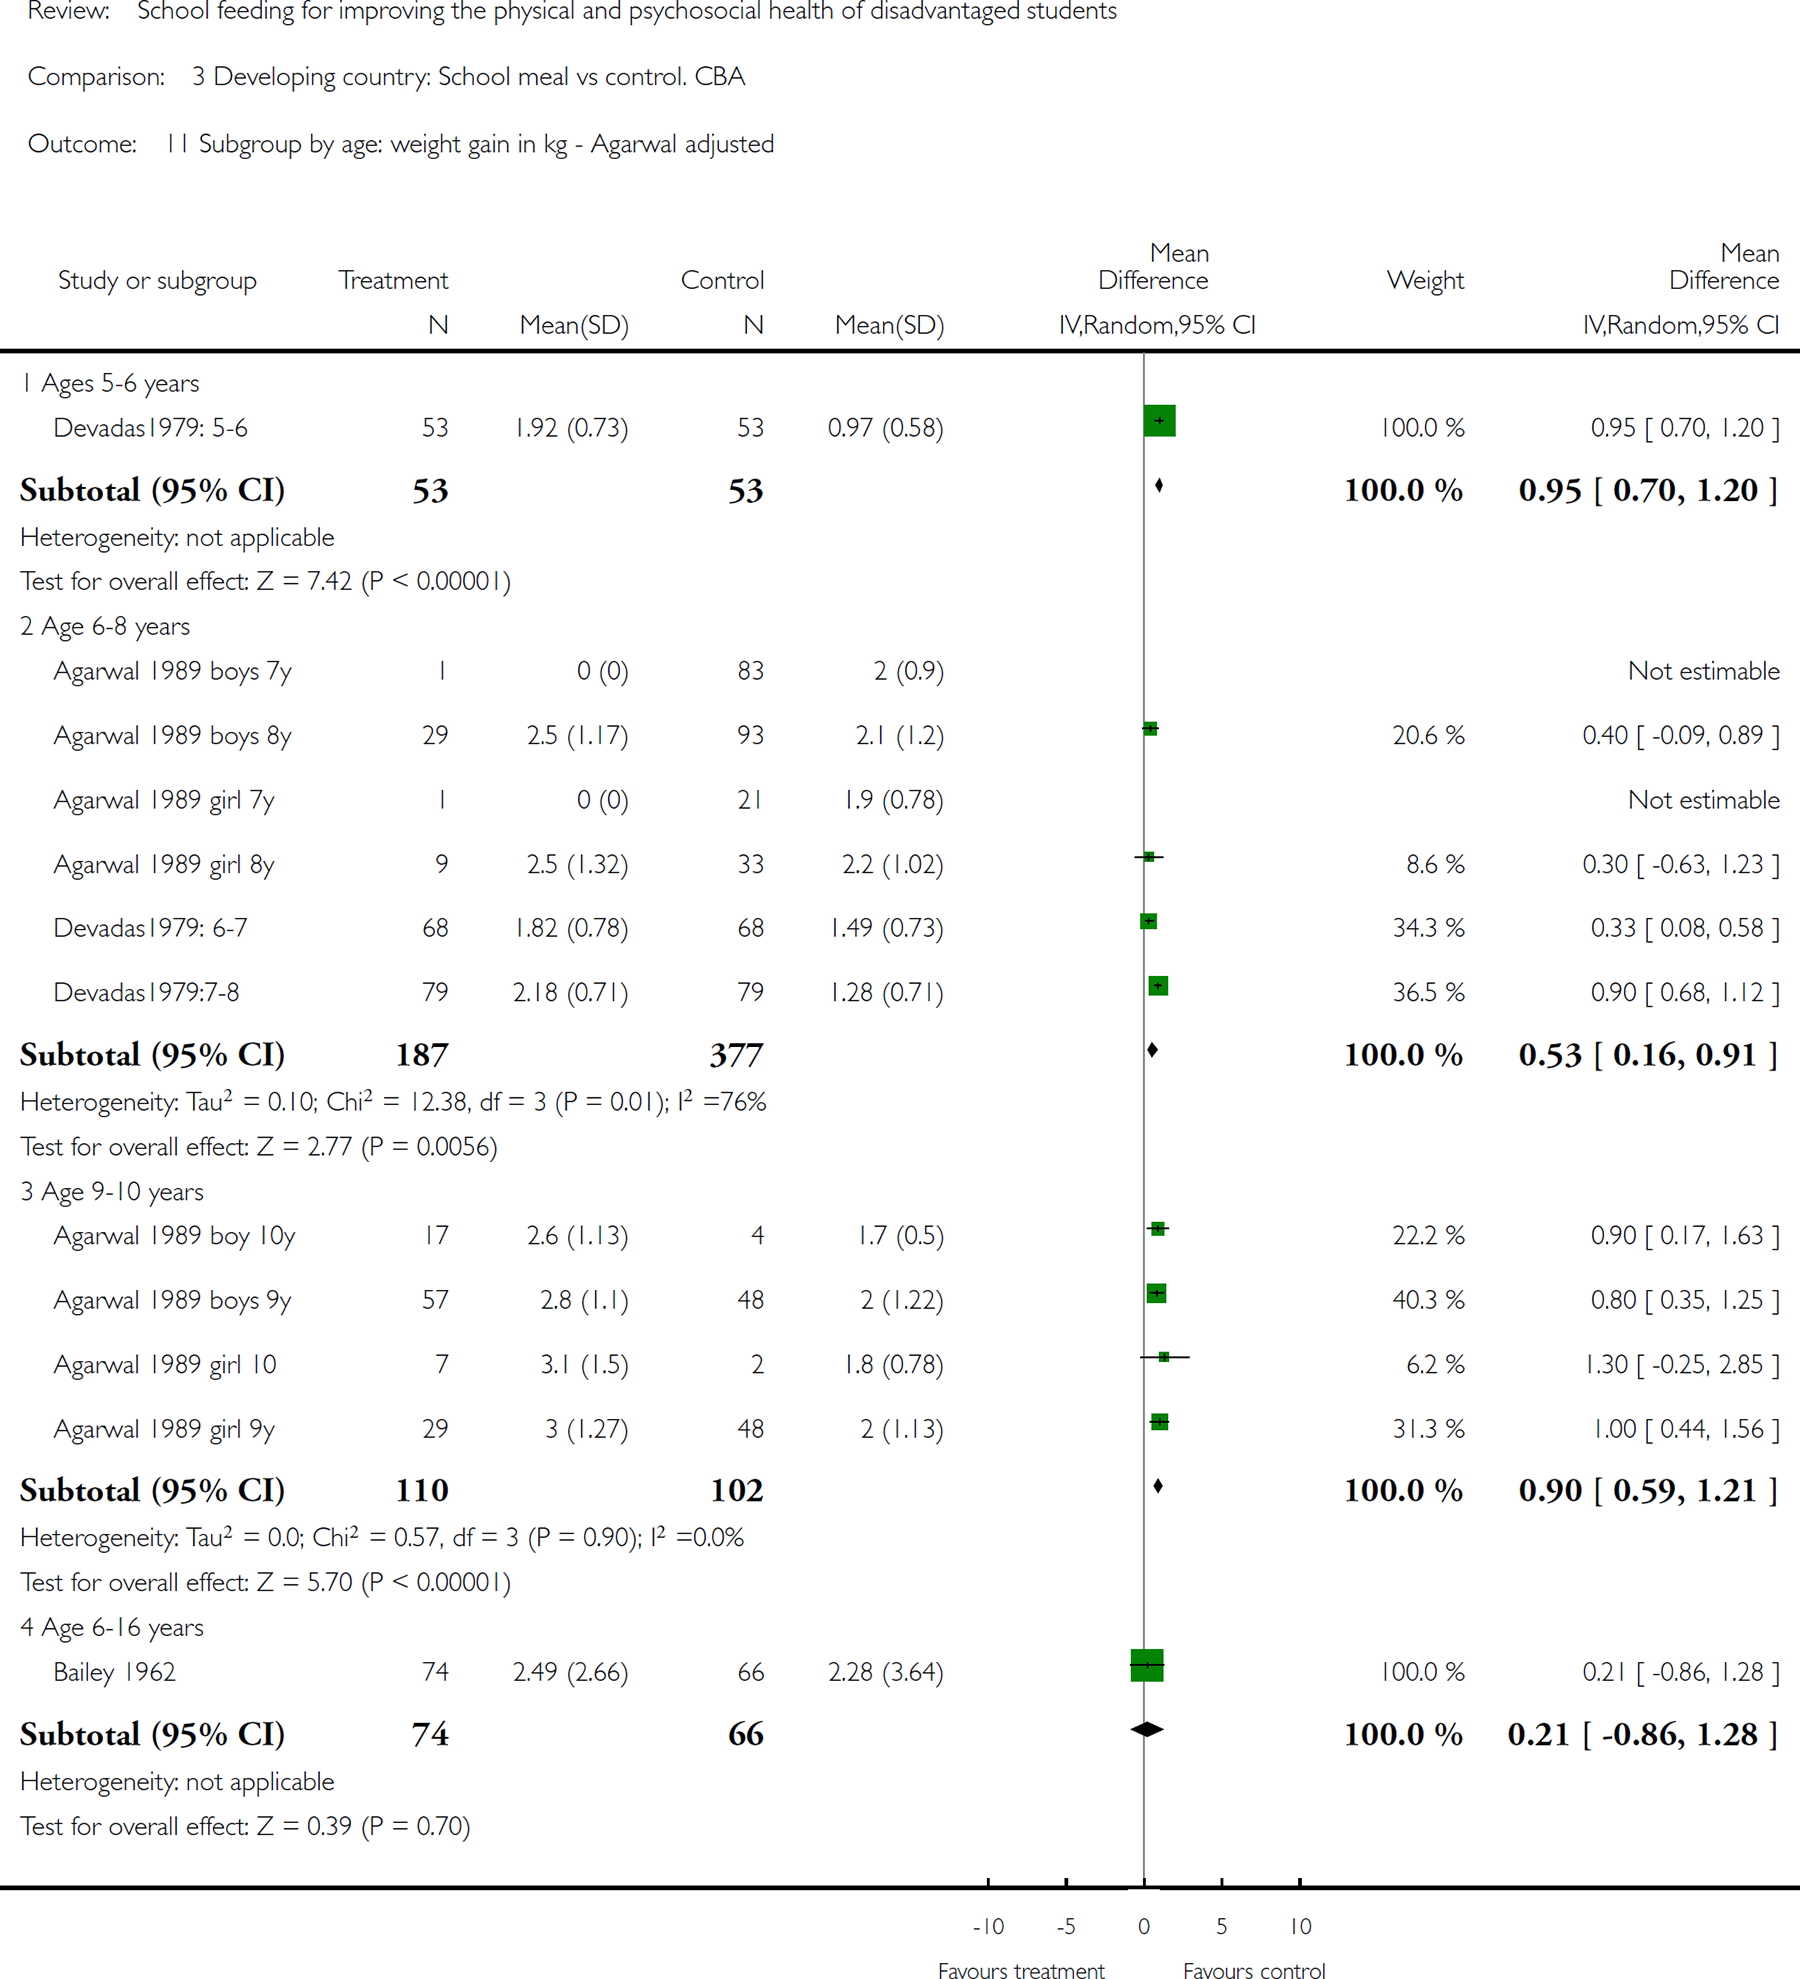
Comparison 3 Developing country: School meal vs control. CBA, Outcome 11 Subgroup by age: weight gain in kg - Agarwal adjusted.
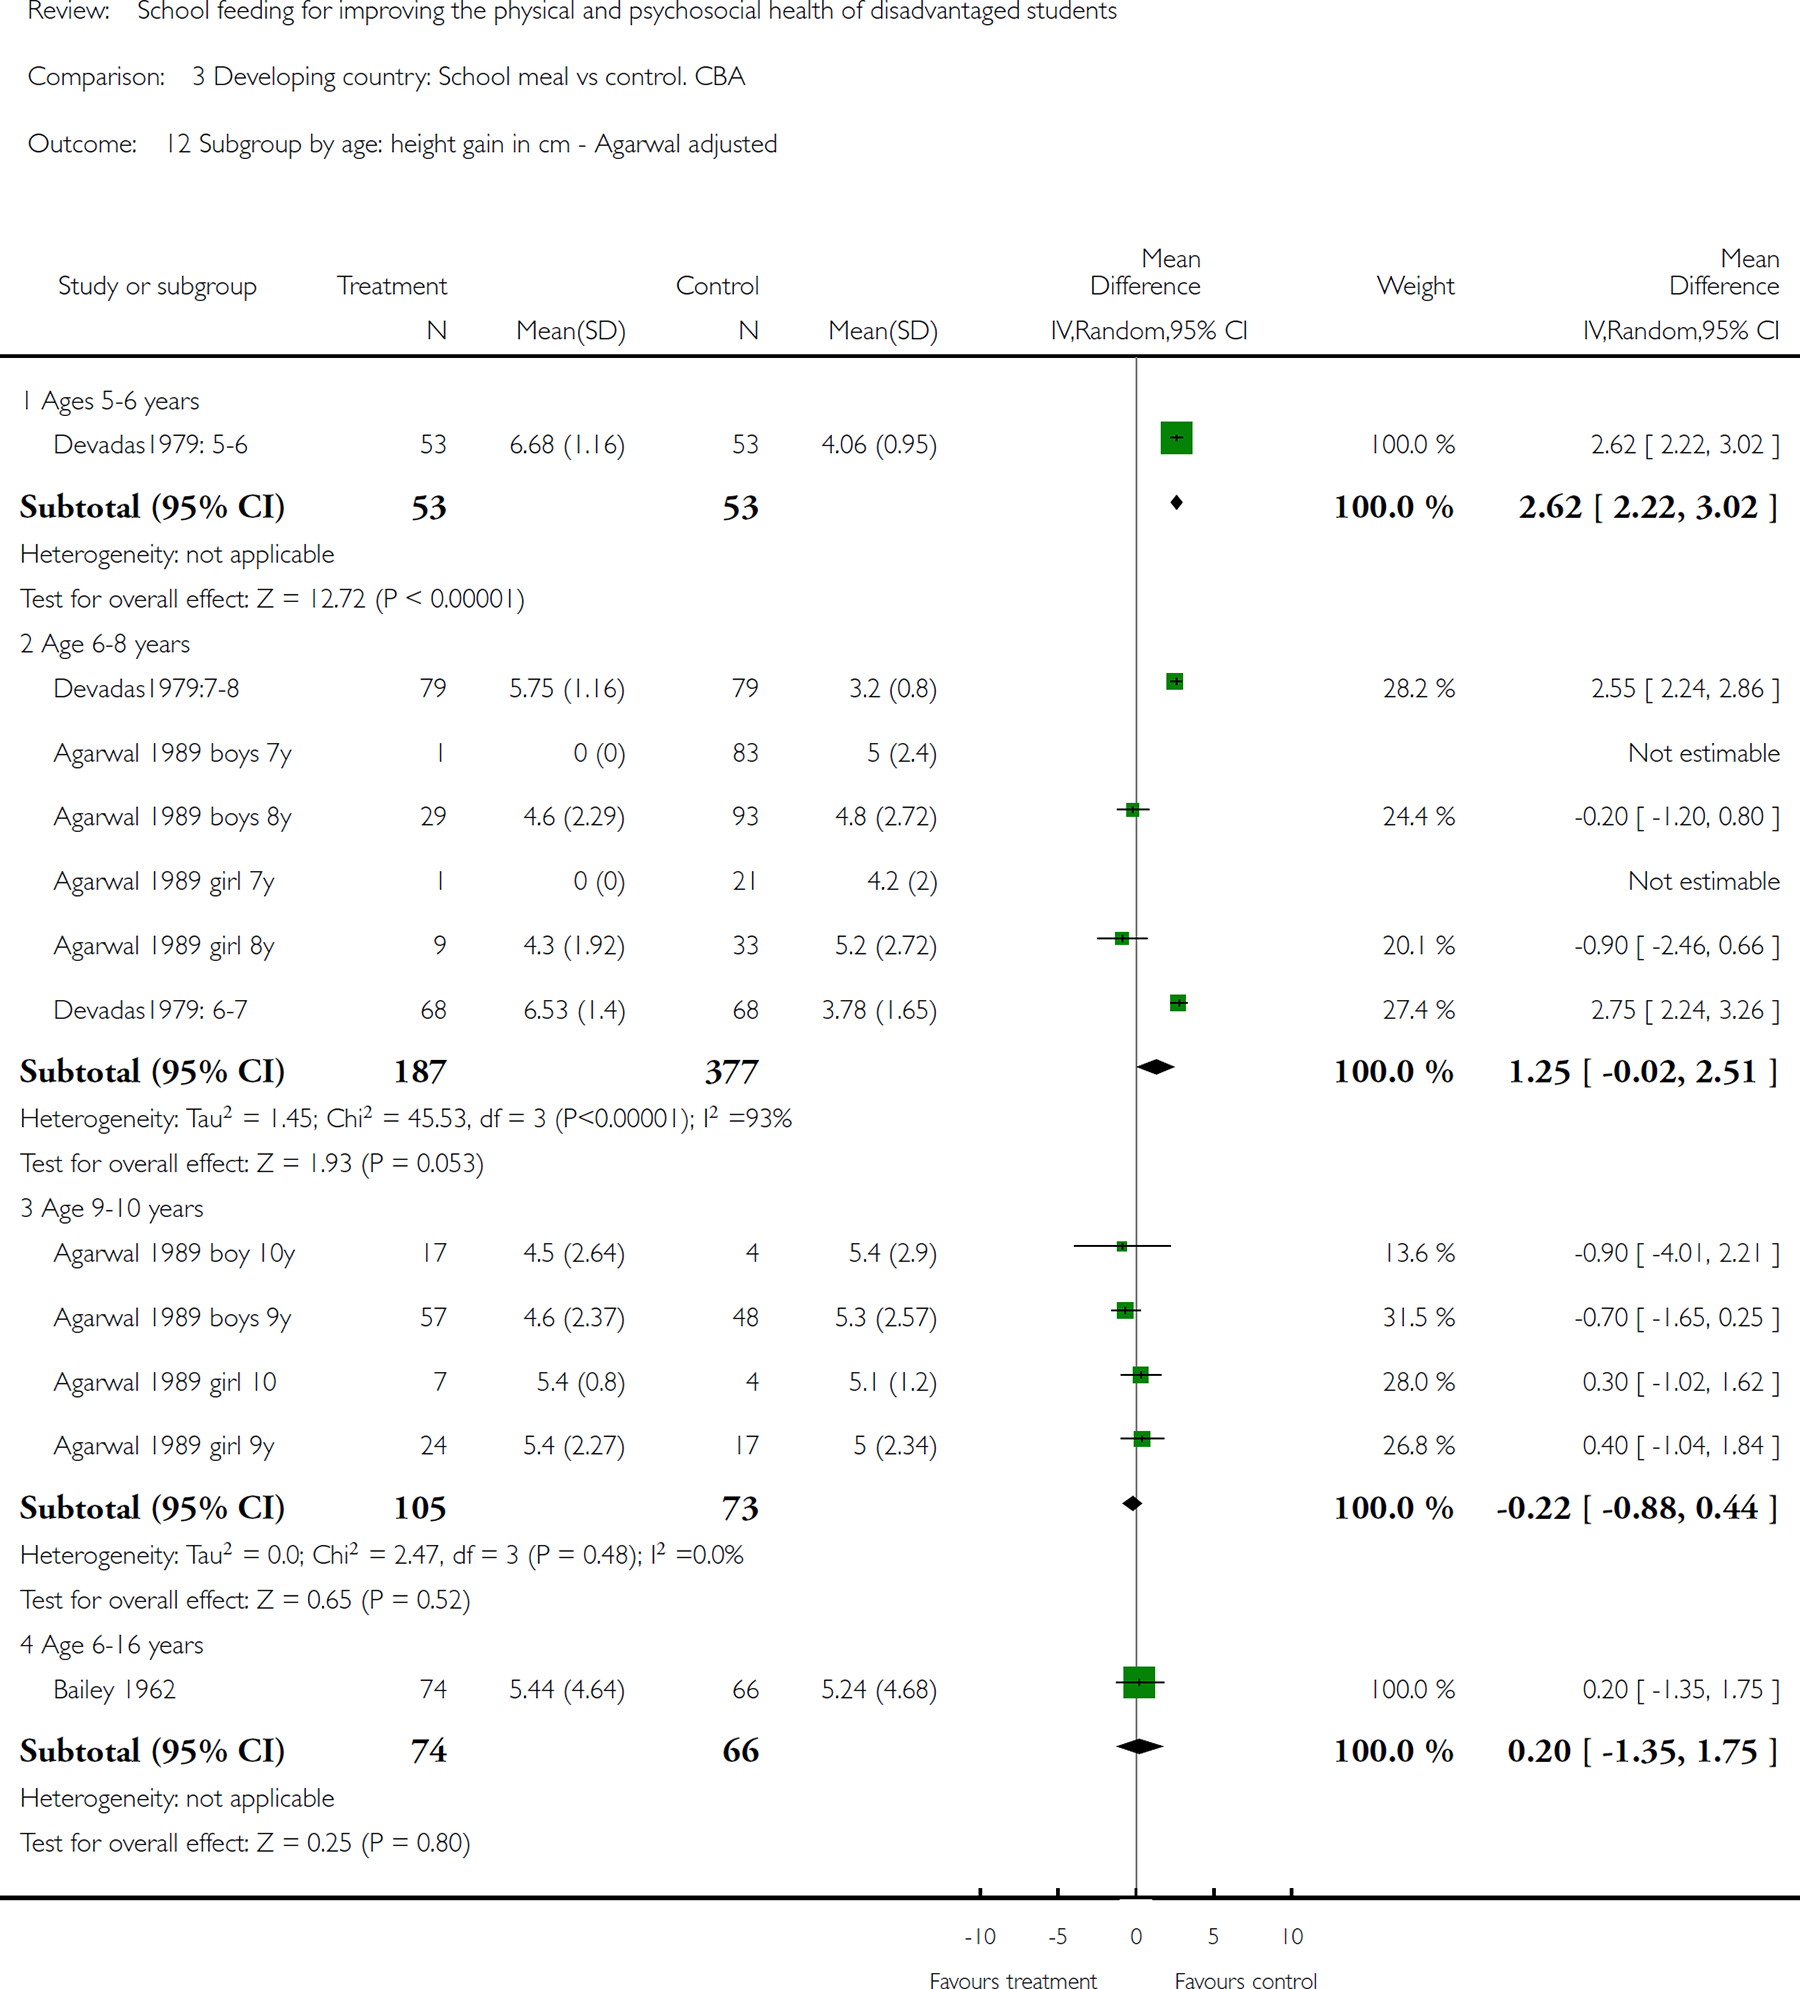
Comparison 3 Developing country: School meal vs control. CBA, Outcome 12 Subgroup by age: height gain in cm - Agarwal adjusted.
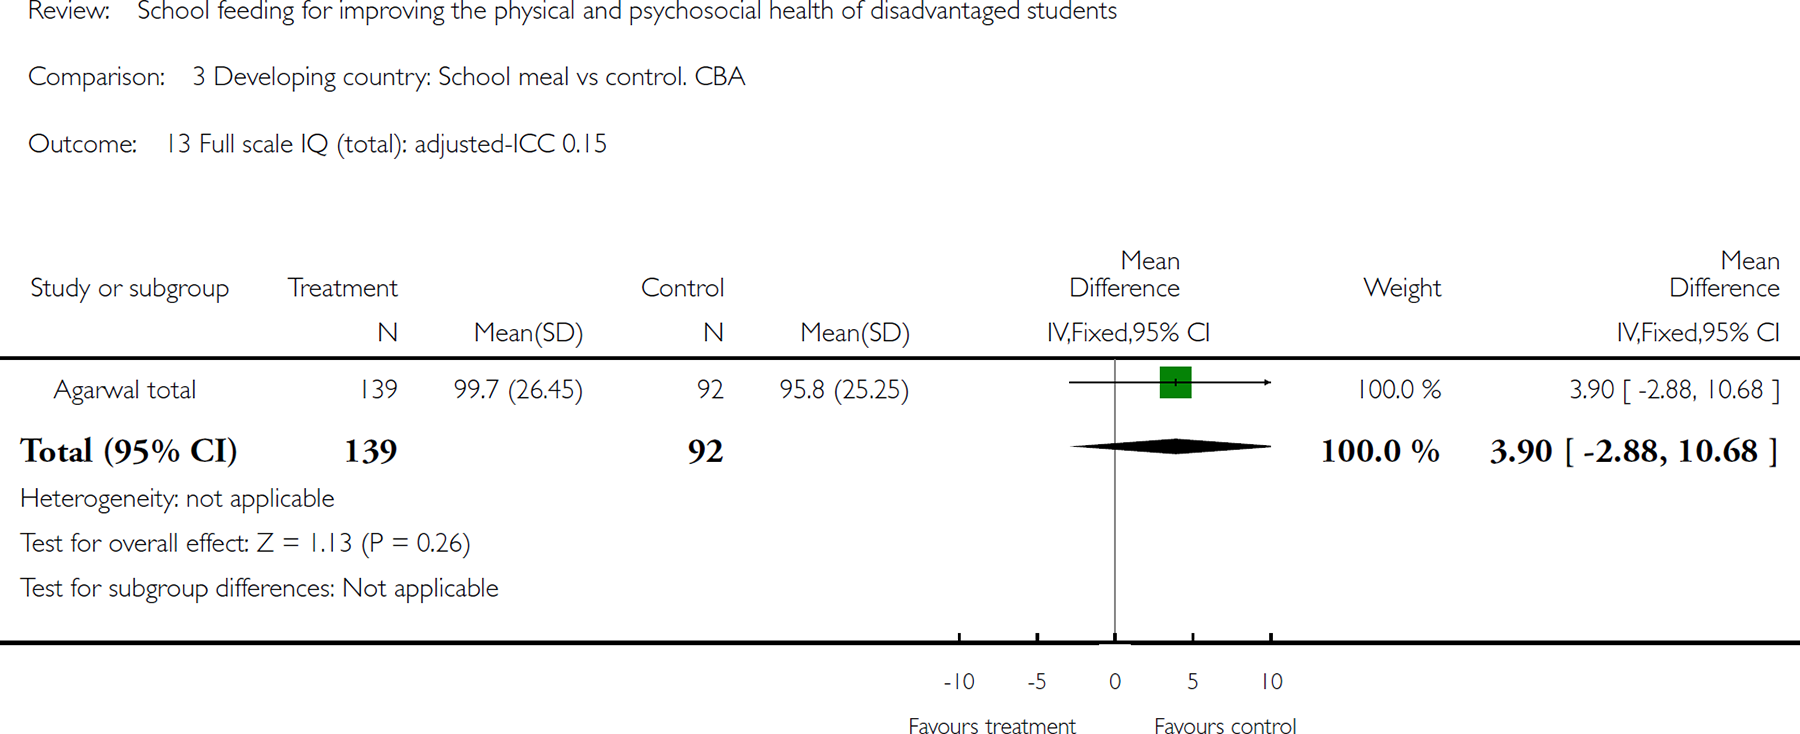
Comparison 3 Developing country: School meal vs control. CBA, Outcome 13 Full scale IQ (total): adjusted-ICC 0.15.
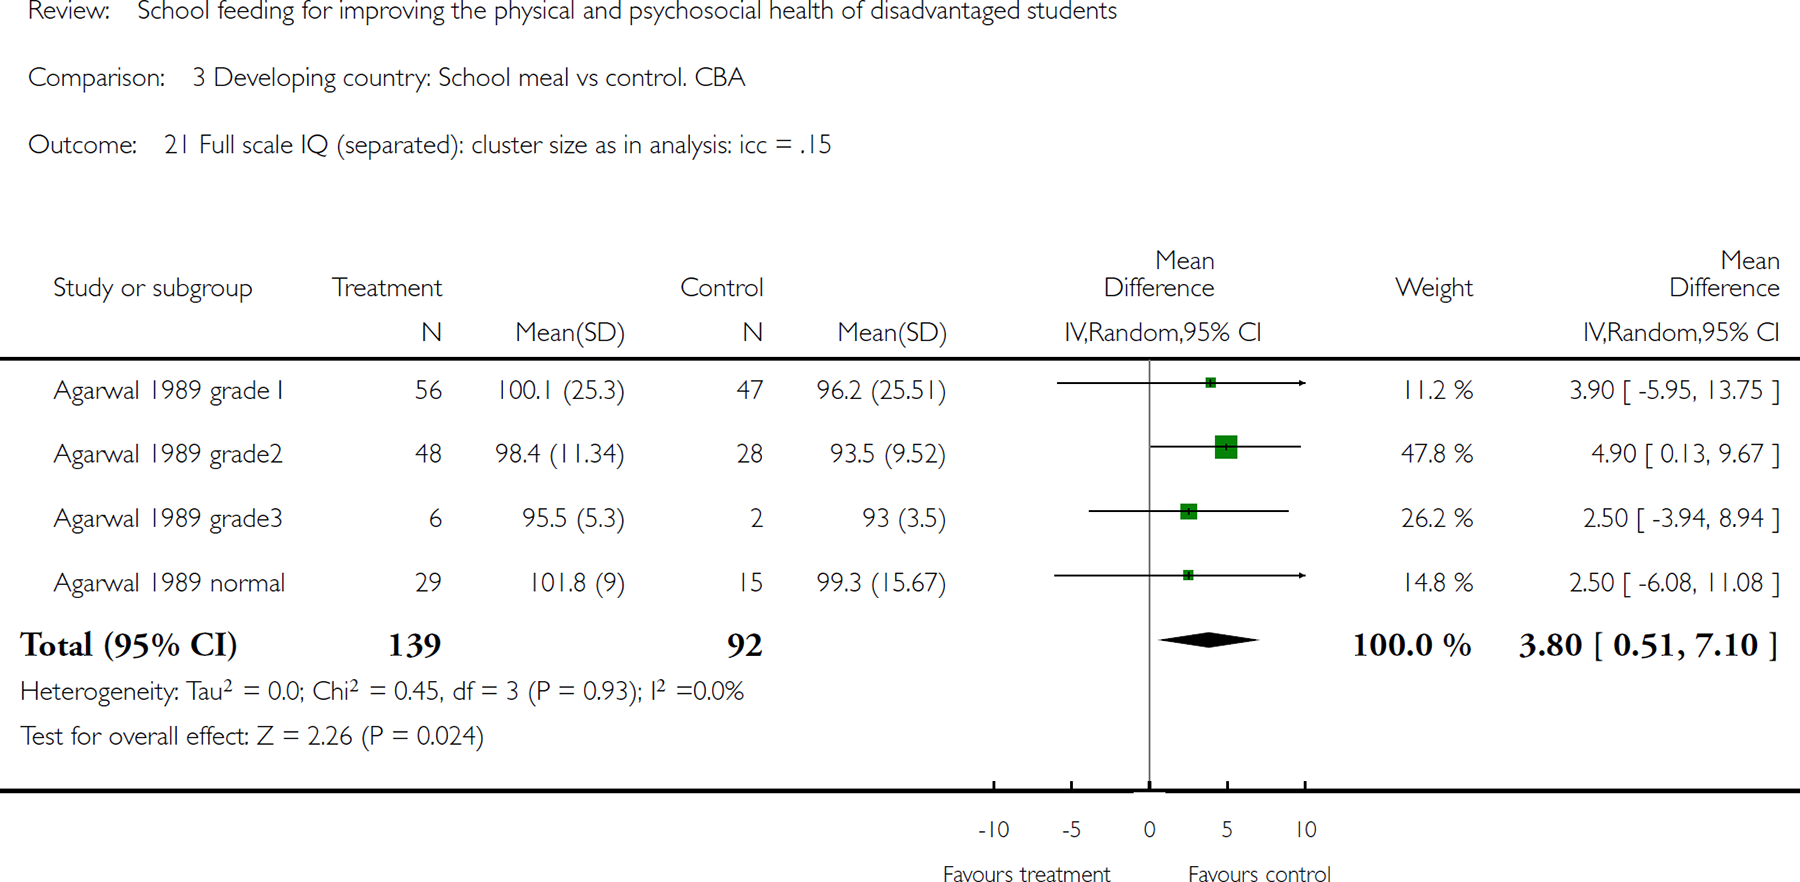
Comparison 3 Developing country: School meal vs control. CBA, Outcome 21 Full scale IQ (separated): cluster size as in analysis: icc = .15.
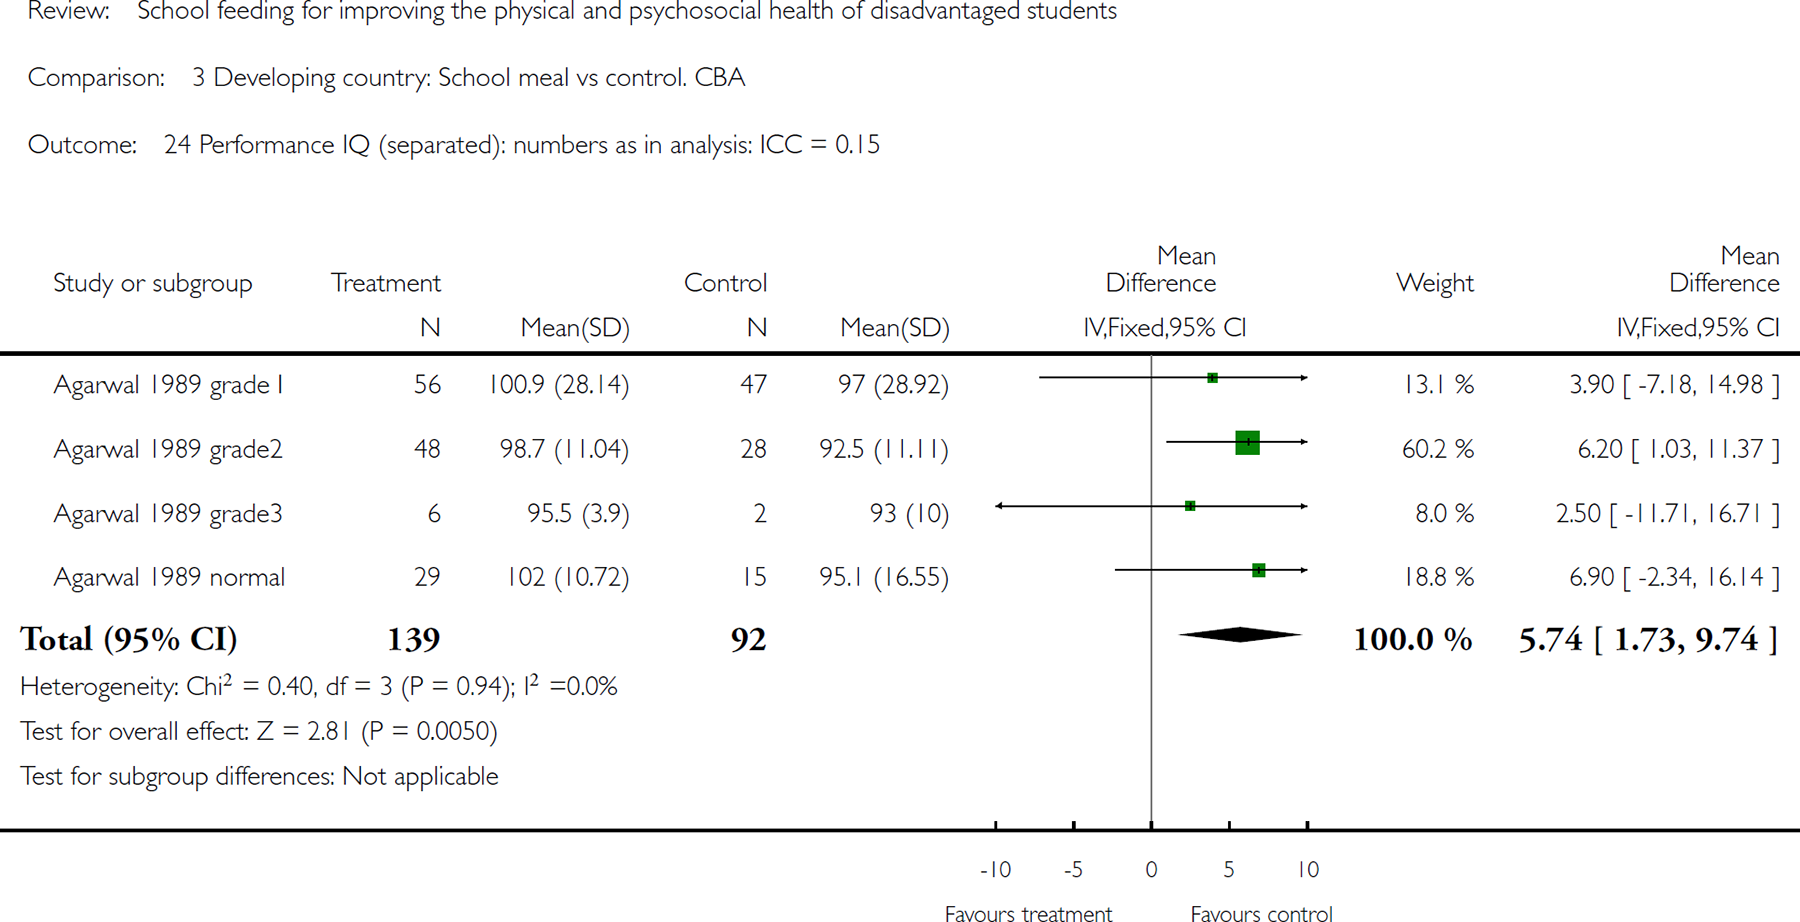
Comparison 3 Developing country: School meal vs control. CBA, Outcome 24 Performance IQ (separated): numbers as in analysis: ICC = 0.15.
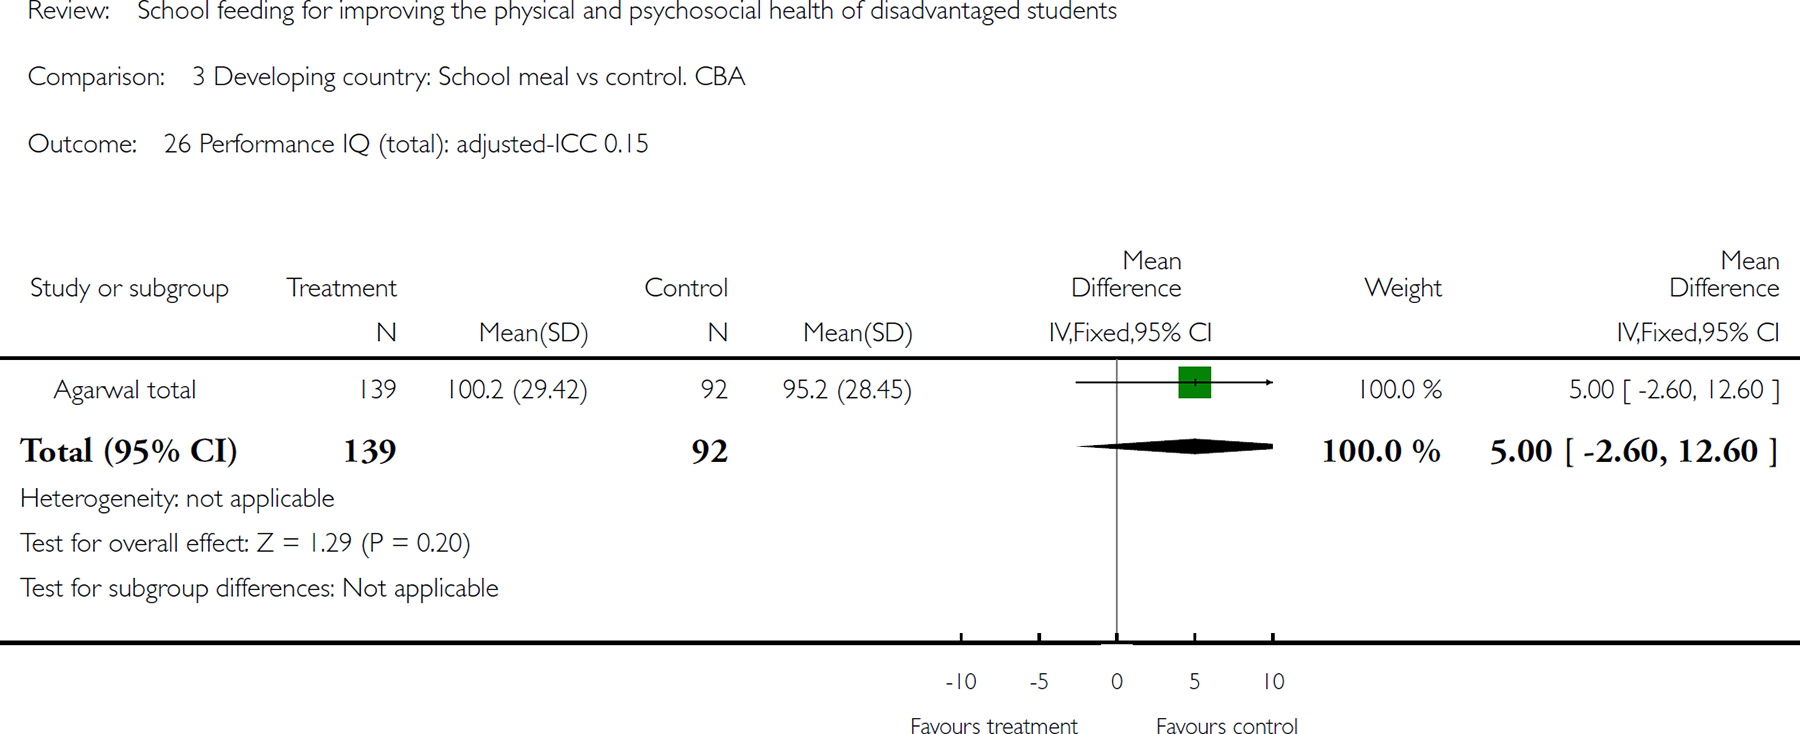
Comparison 3 Developing country: School meal vs control. CBA, Outcome 26 Performance IQ (total): adjusted-ICC 0.15.
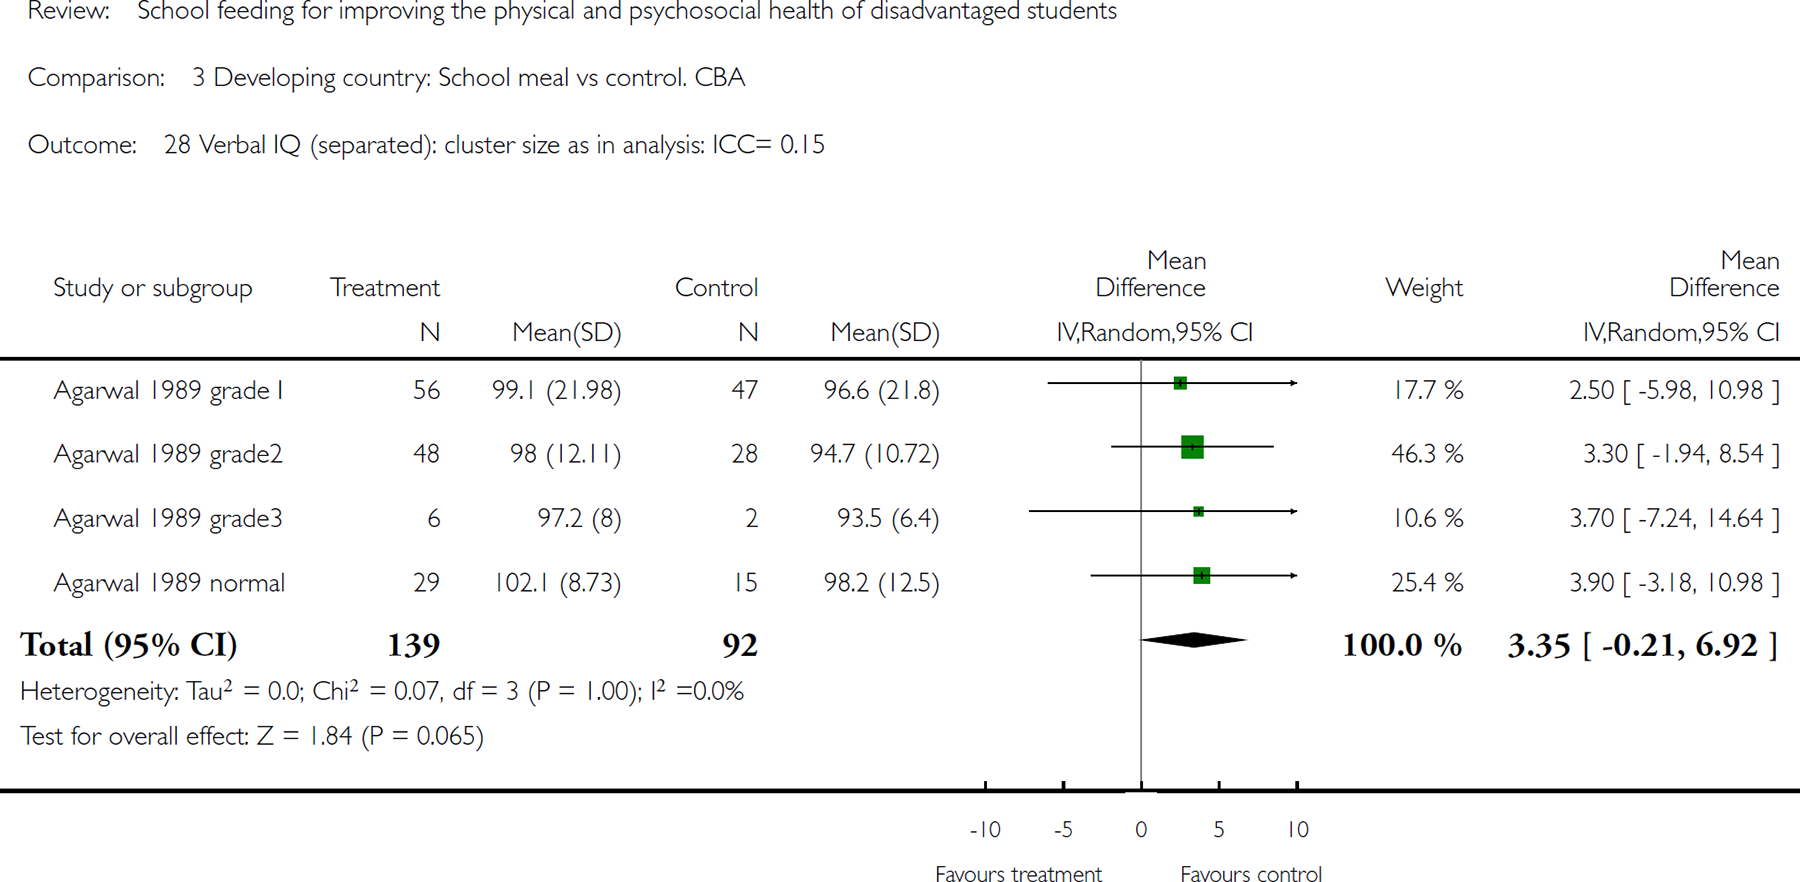
Comparison 3 Developing country: School meal vs control. CBA, Outcome 28 Verbal IQ (separated): cluster size as in analysis: ICC= 0.15.
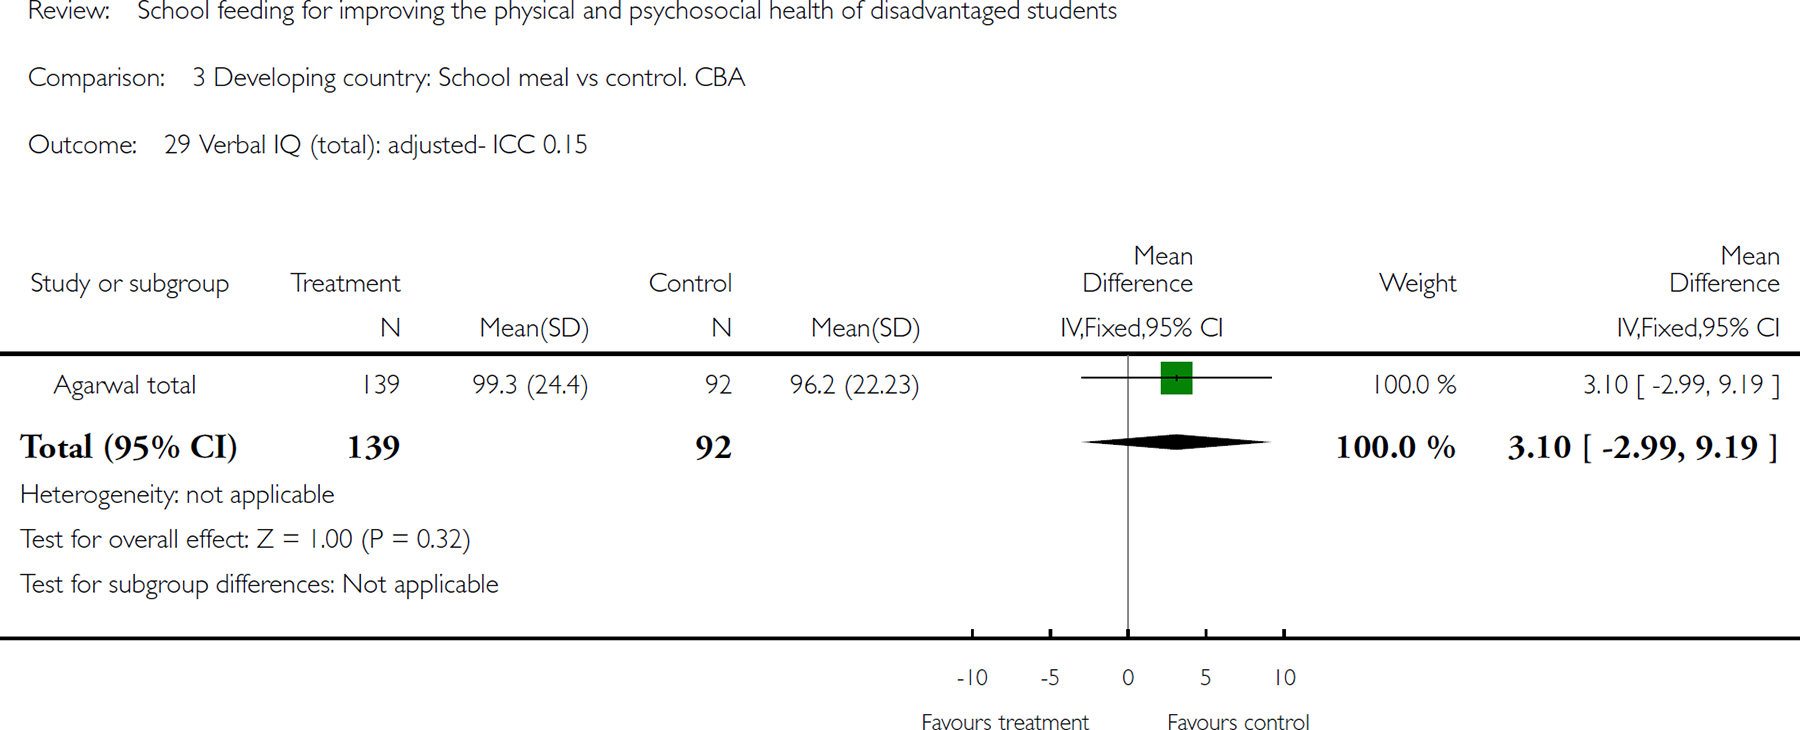
Comparison 3 Developing country: School meal vs control. CBA, Outcome 29 Verbal IQ (total): adjusted- ICC 0.15.
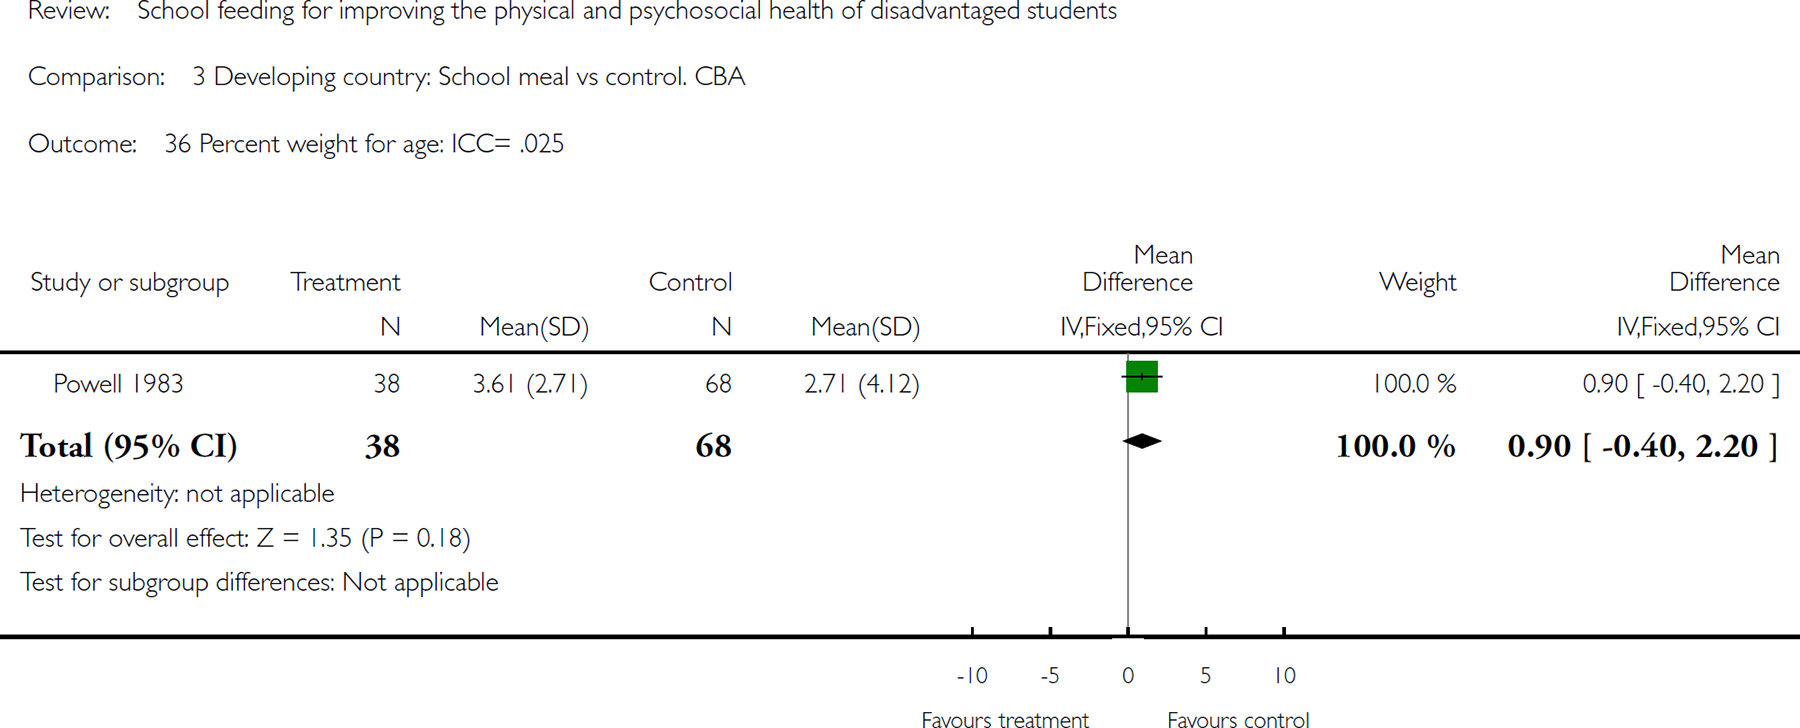
Comparison 3 Developing country: School meal vs control. CBA, Outcome 36 Percent weight for age: ICC= .025.
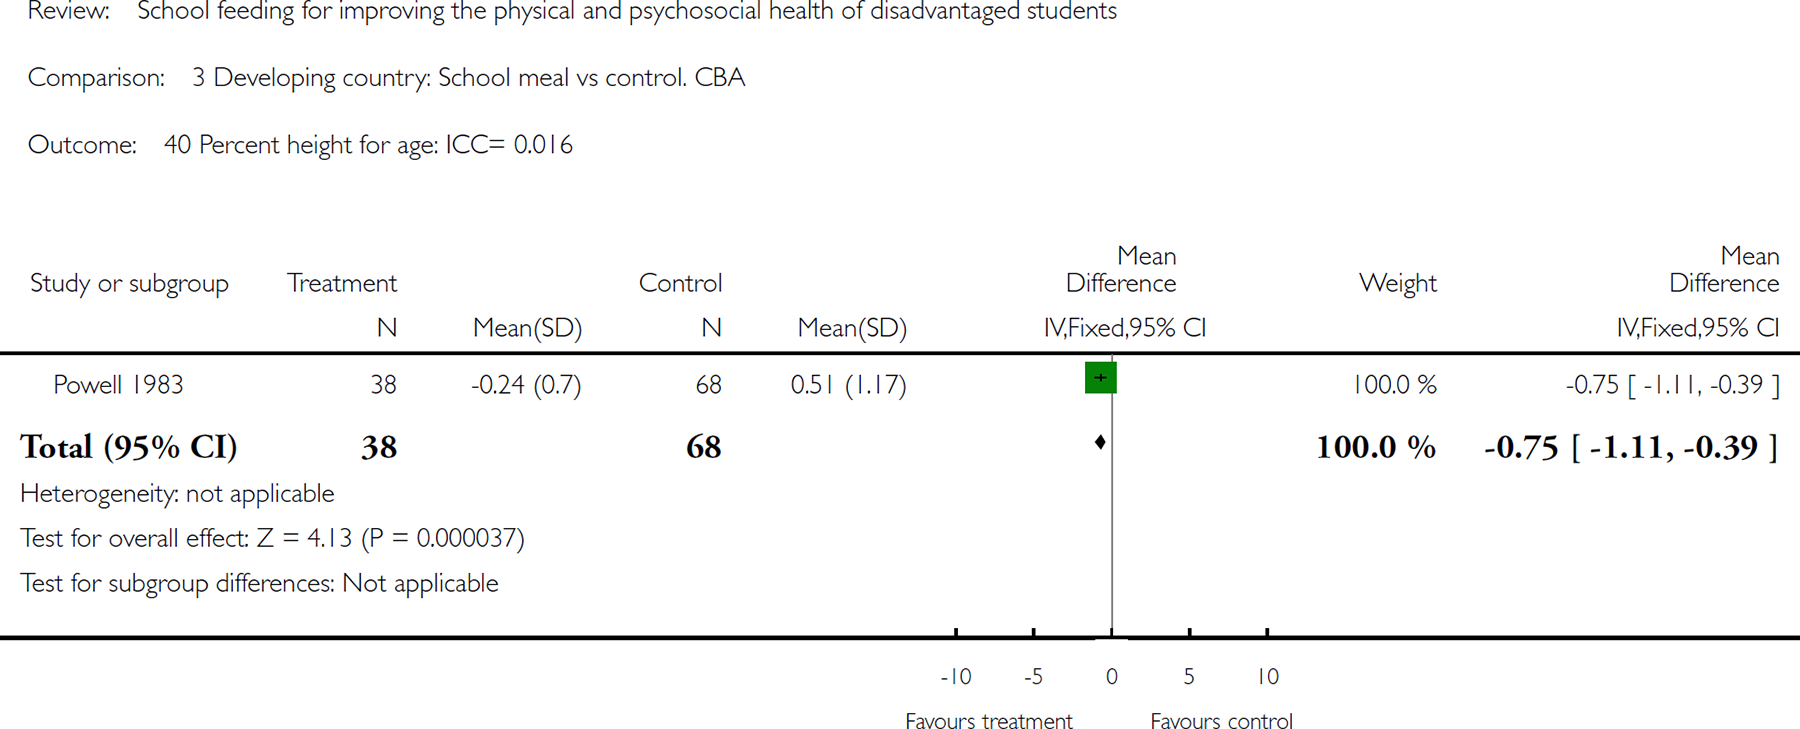
Comparison 3 Developing country: School meal vs control. CBA, Outcome 40 Percent height for age: ICC= 0.016.
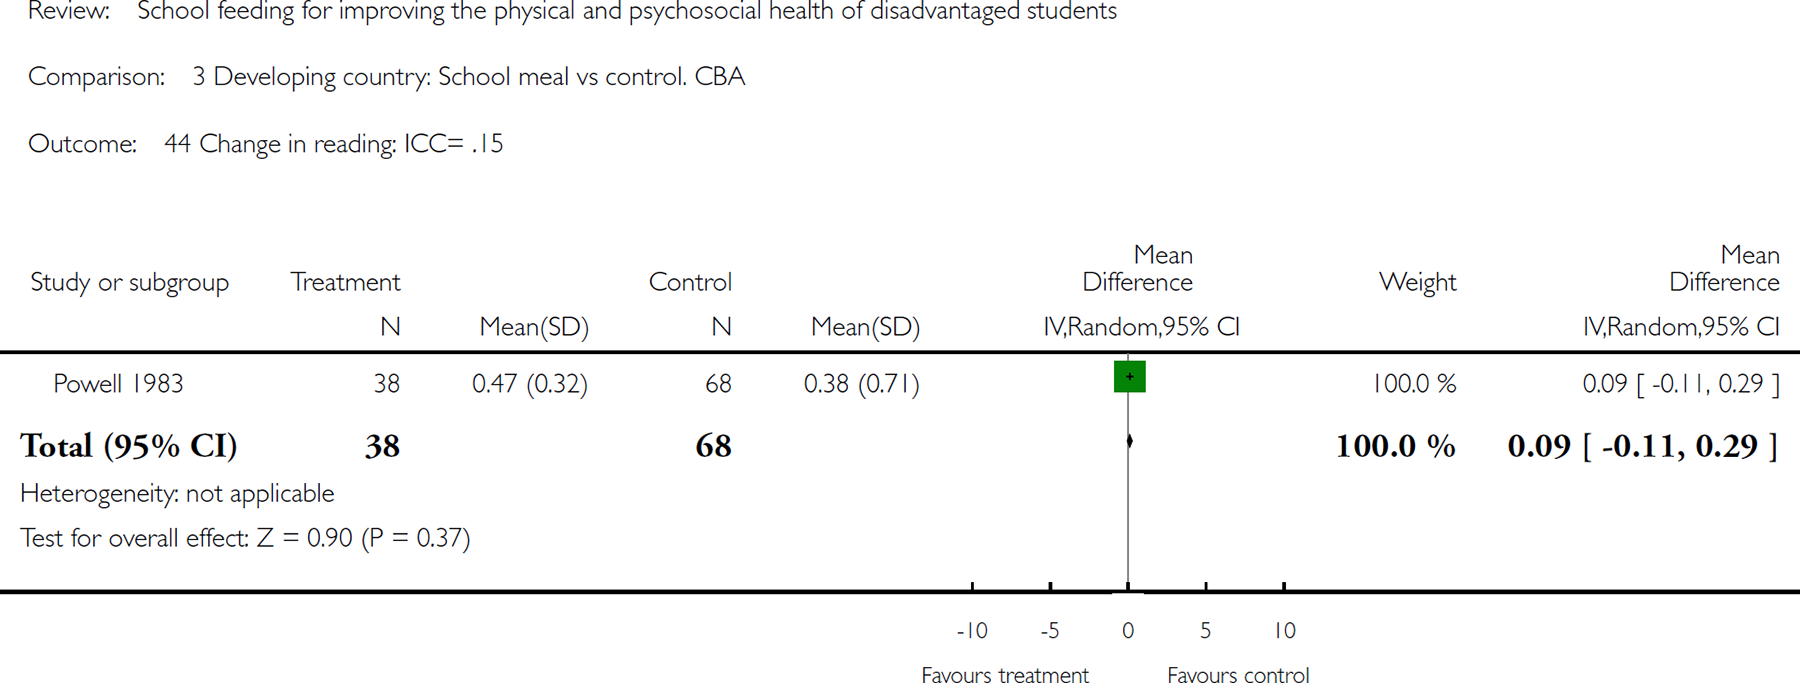
Comparison 3 Developing country: School meal vs control. CBA, Outcome 44 Change in reading: ICC= .15.
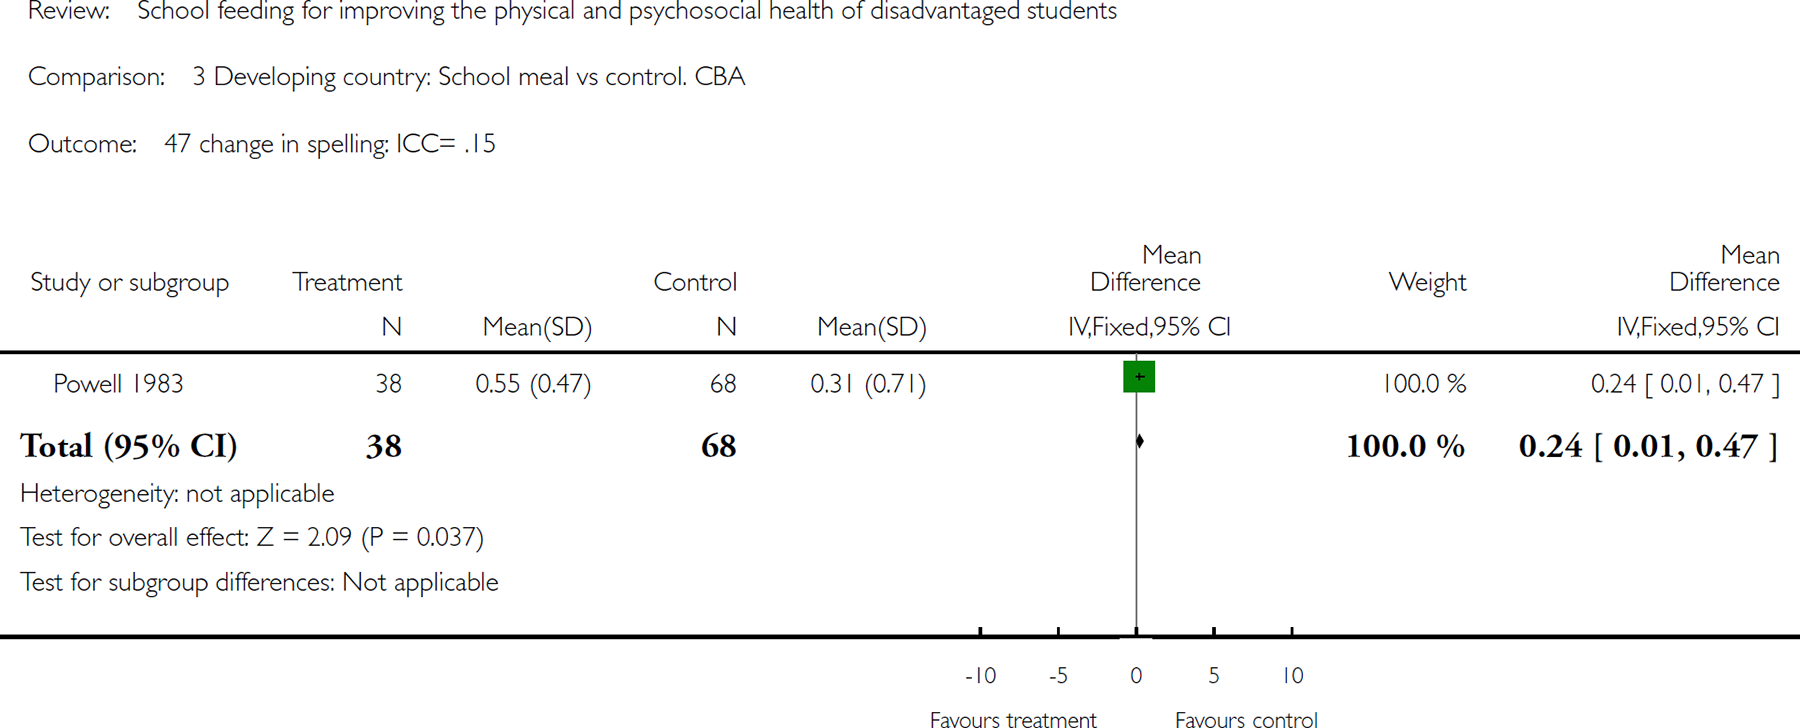
Comparison 3 Developing country: School meal vs control. CBA, Outcome 47 change in spelling: ICC= .15.
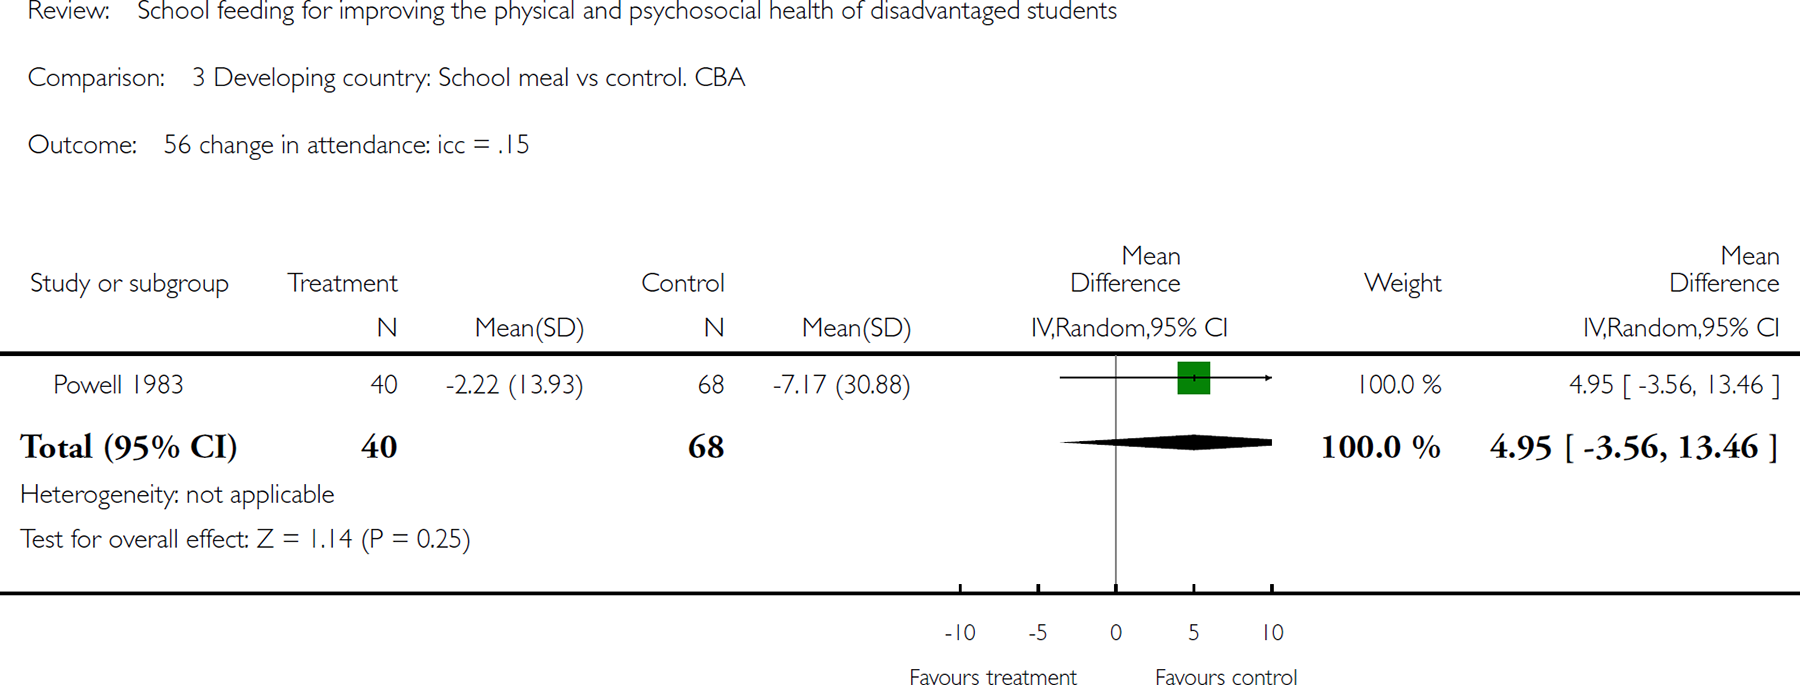
Comparison 3 Developing country: School meal vs control. CBA, Outcome 56 change in attendance: icc = .15.

Comparison 3 Developing country: School meal vs control. CBA, Outcome 57 End of study: attendance: icc = .15.
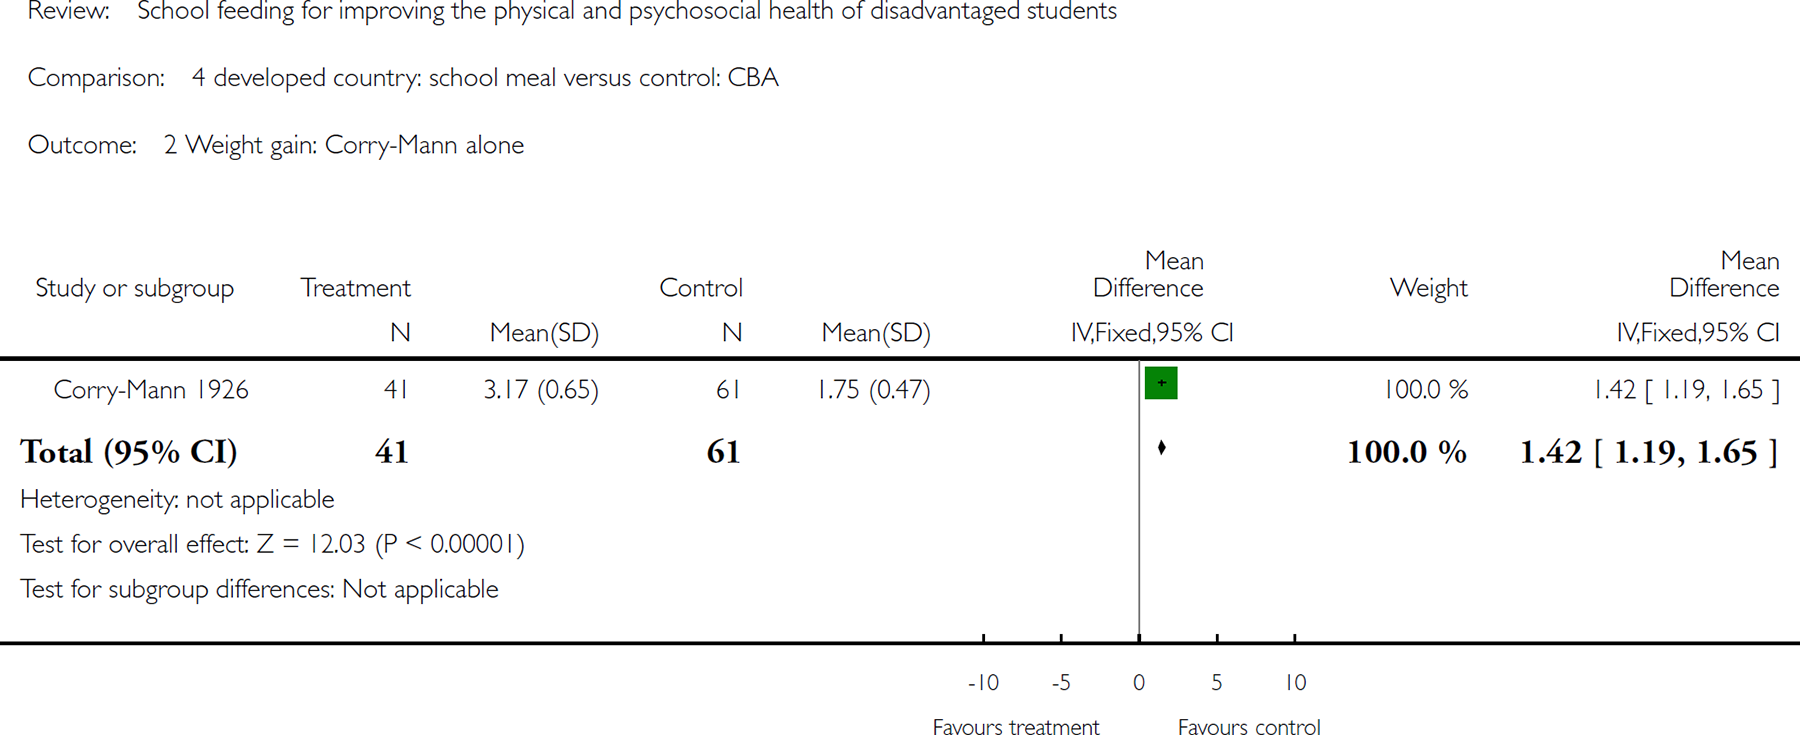
Comparison 4 developed country: school meal versus control: CBA, Outcome 2Weight gain: Corry-Mann alone.
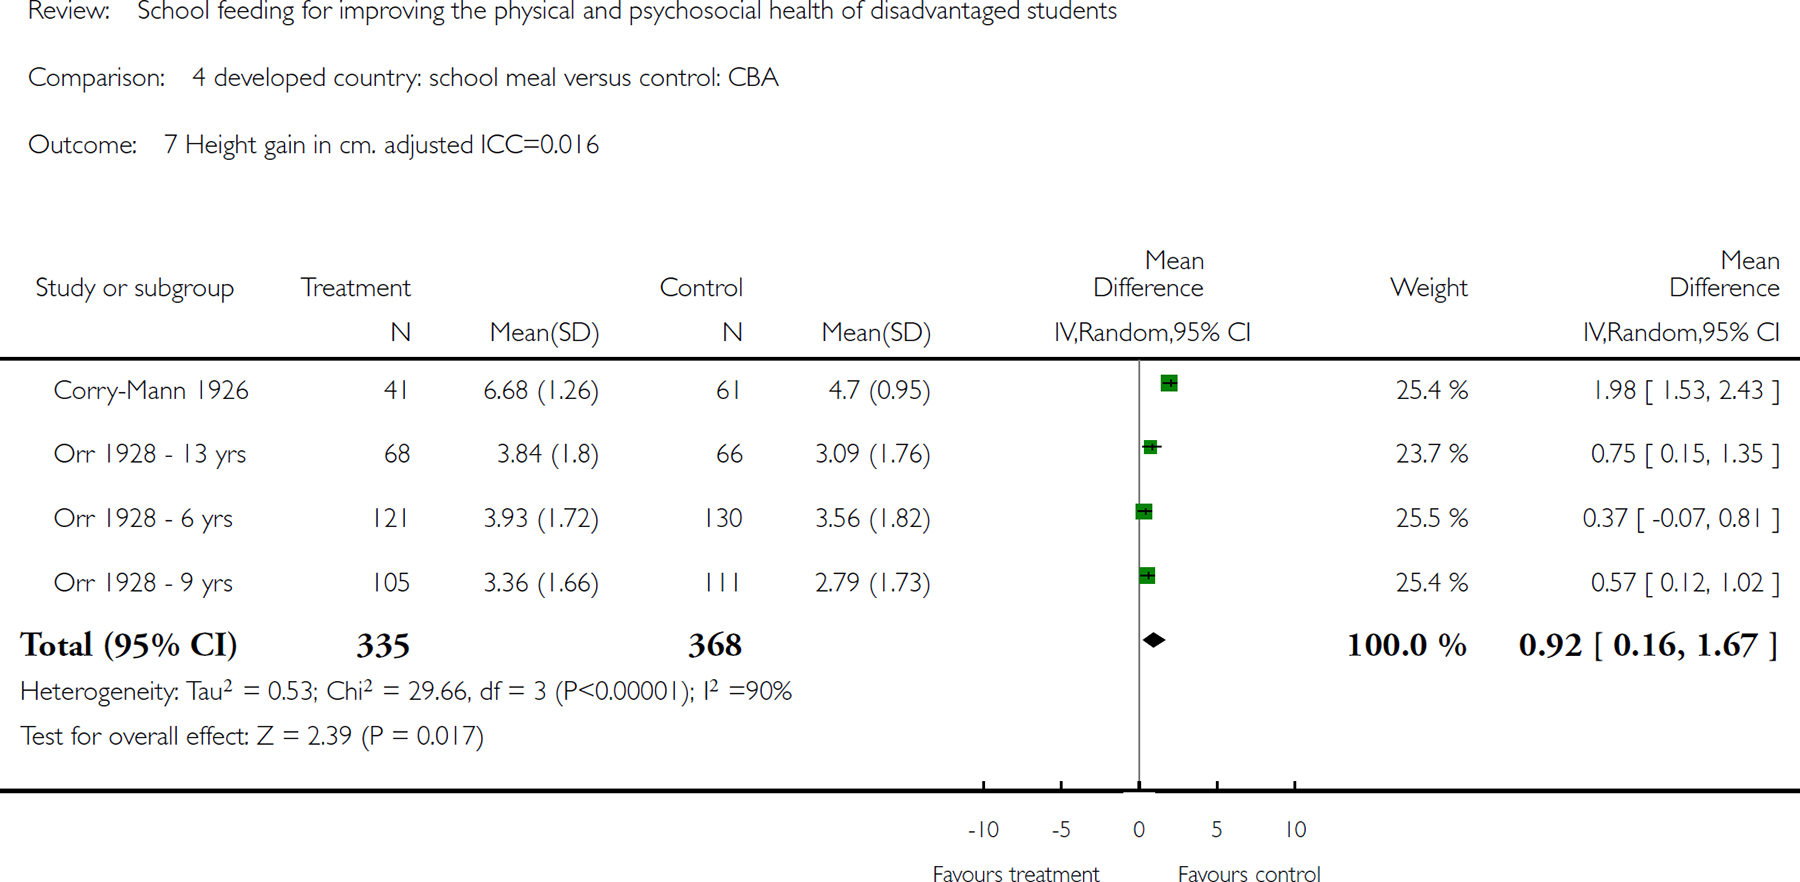
Comparison 4 developed country: school meal versus control: CBA, Outcome 7 Height gain in cm. adjusted ICC=0.016.
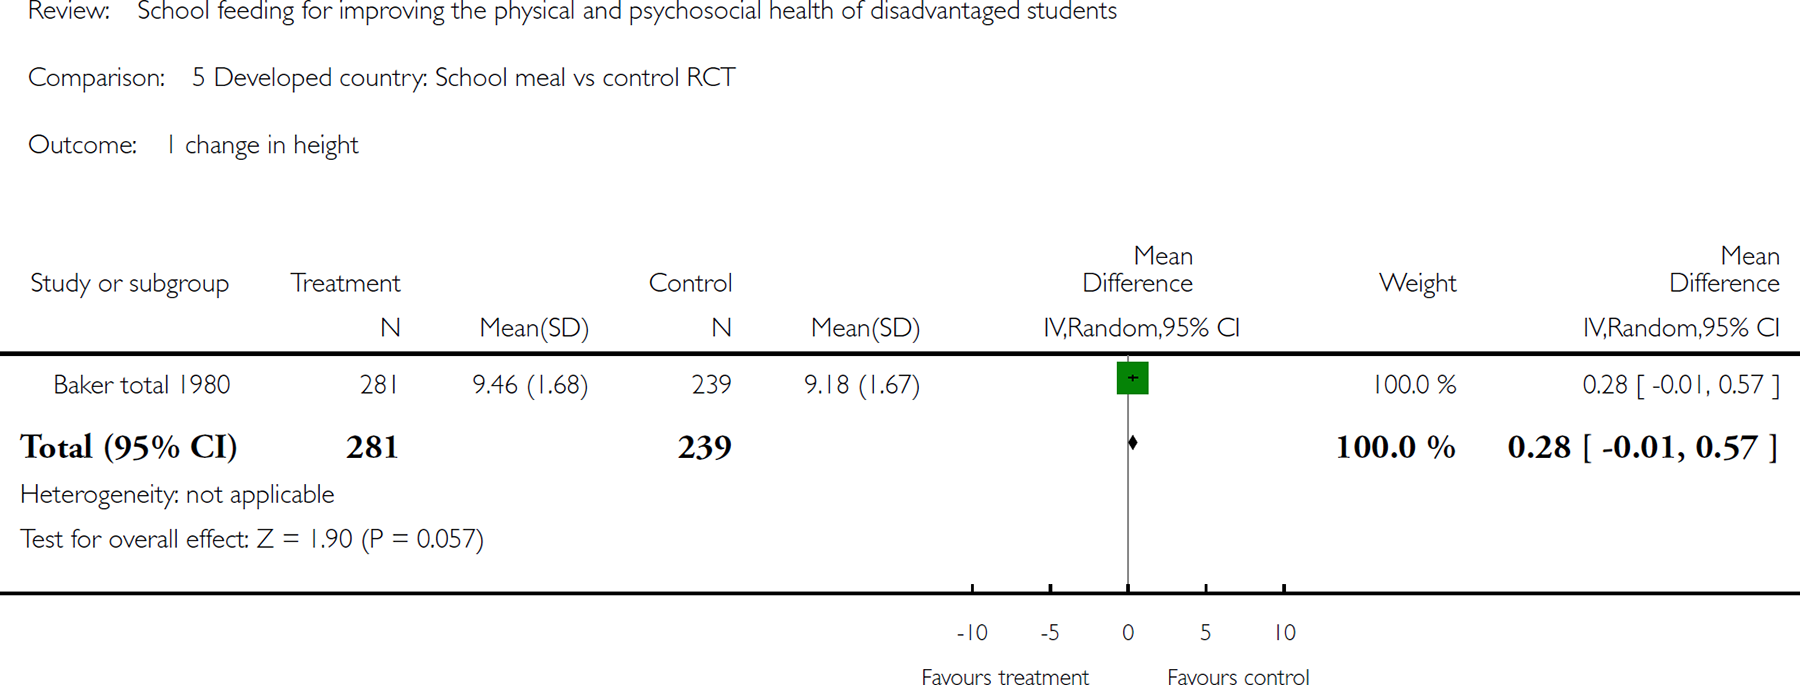
Comparison 5 Developed country: School meal vs control RCT, Outcome 1 change in height.
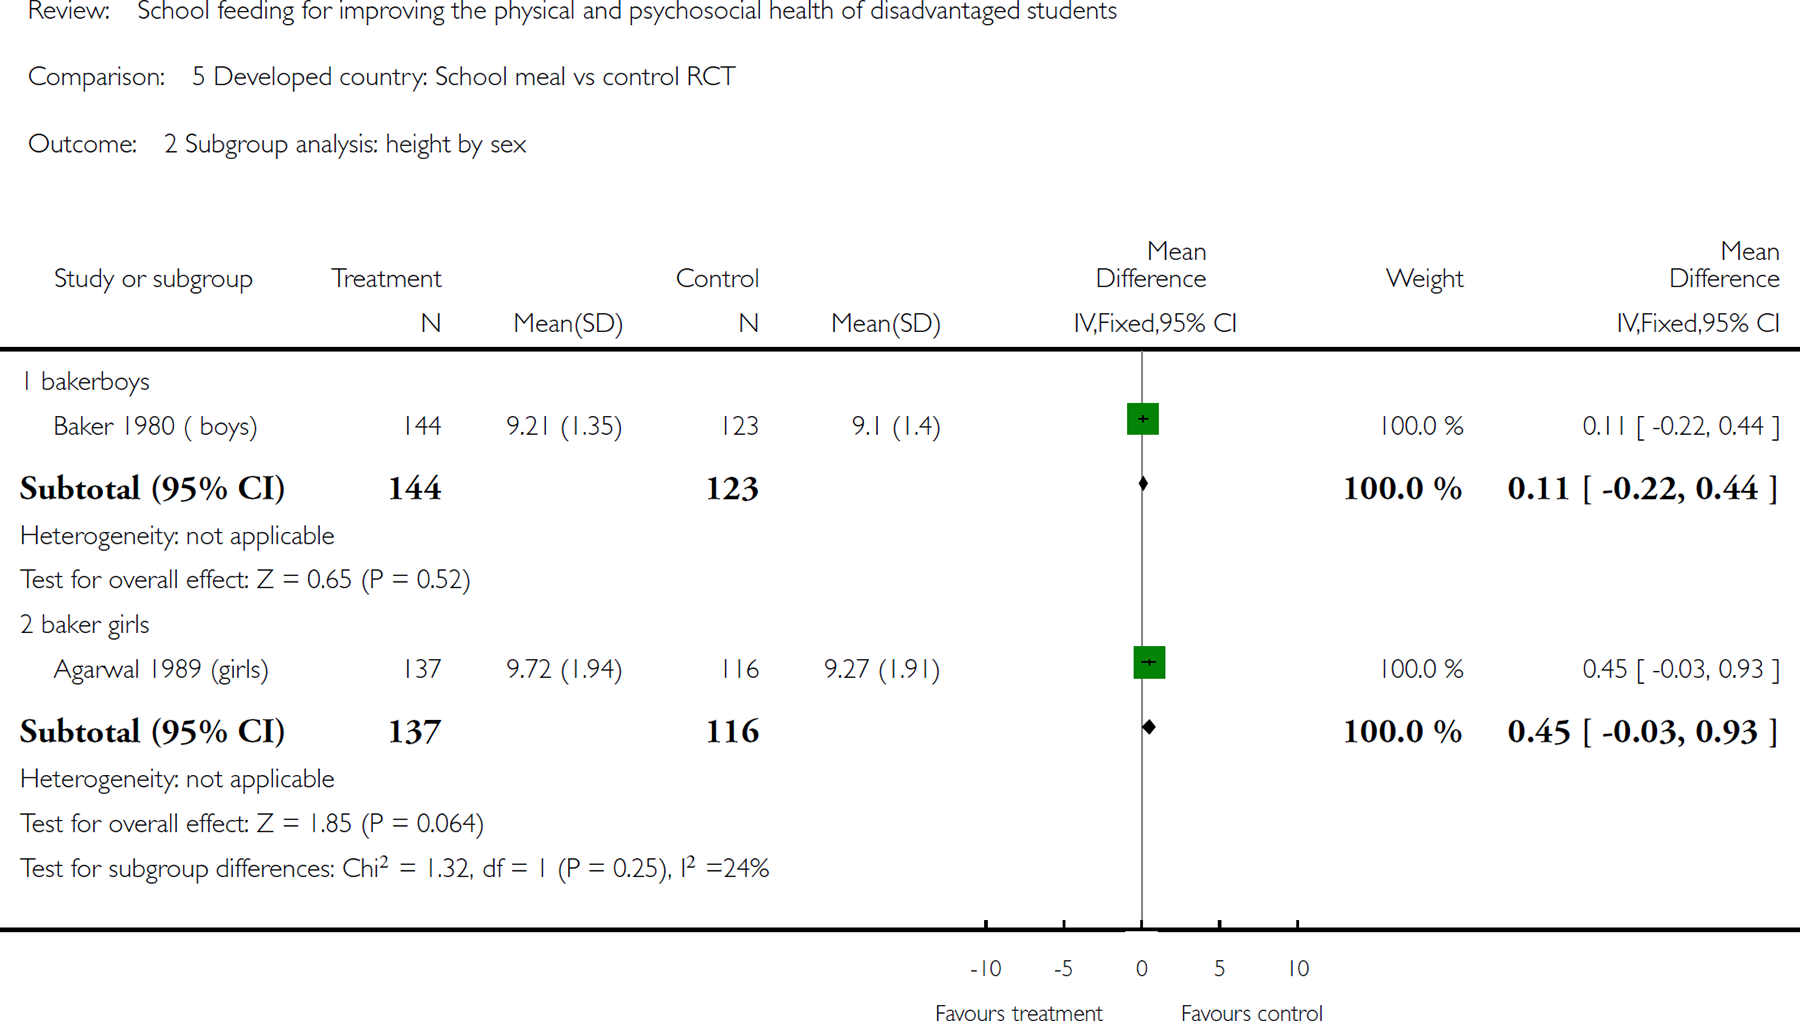
Comparison 5 Developed country: School meal vs control RCT, Outcome 2 Subgroup analysis: height by sex.
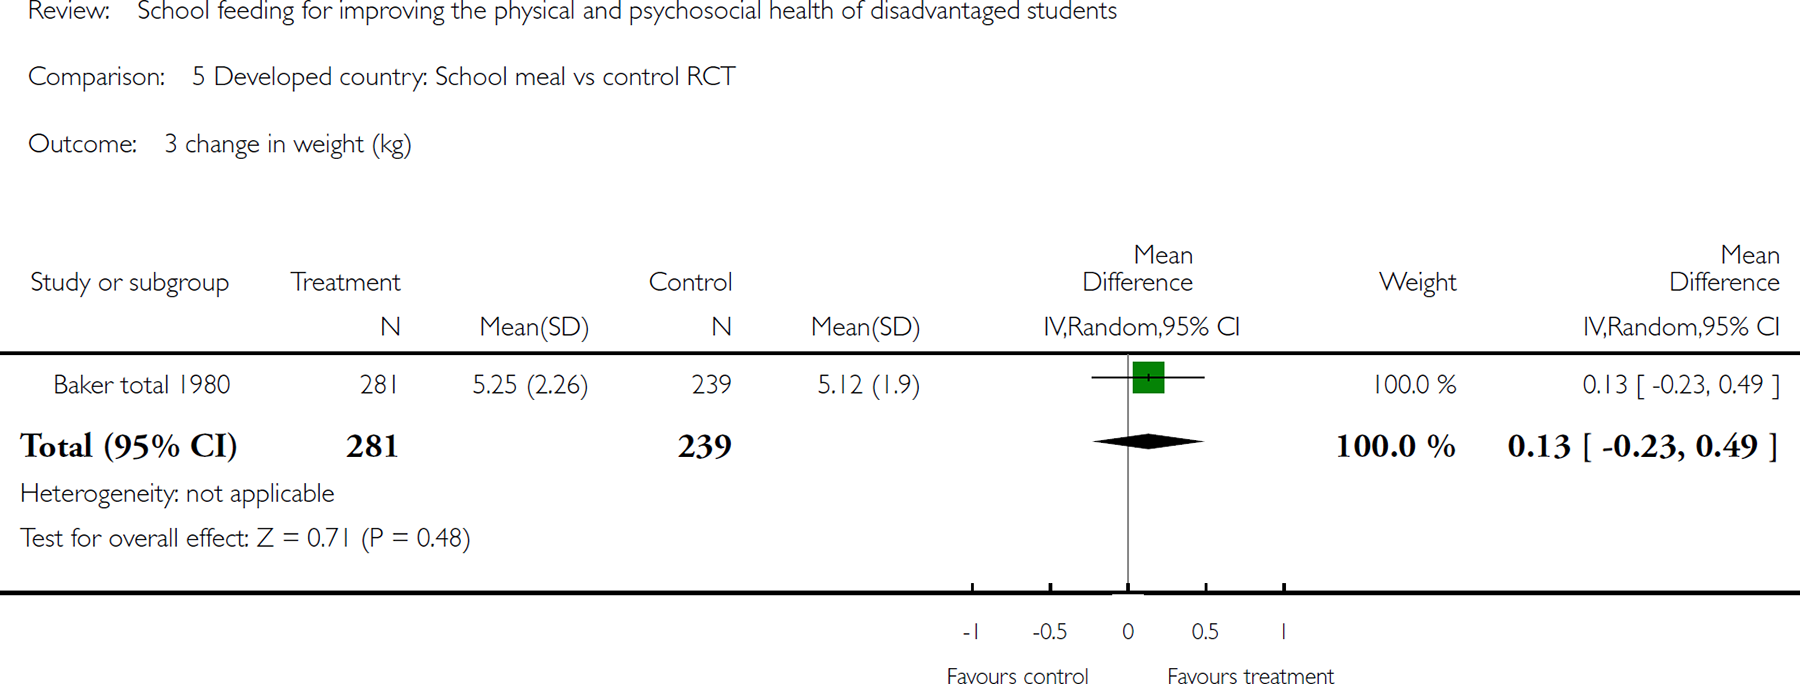
Comparison 5 Developed country: School meal vs control RCT, Outcome 3 change in weight (kg).
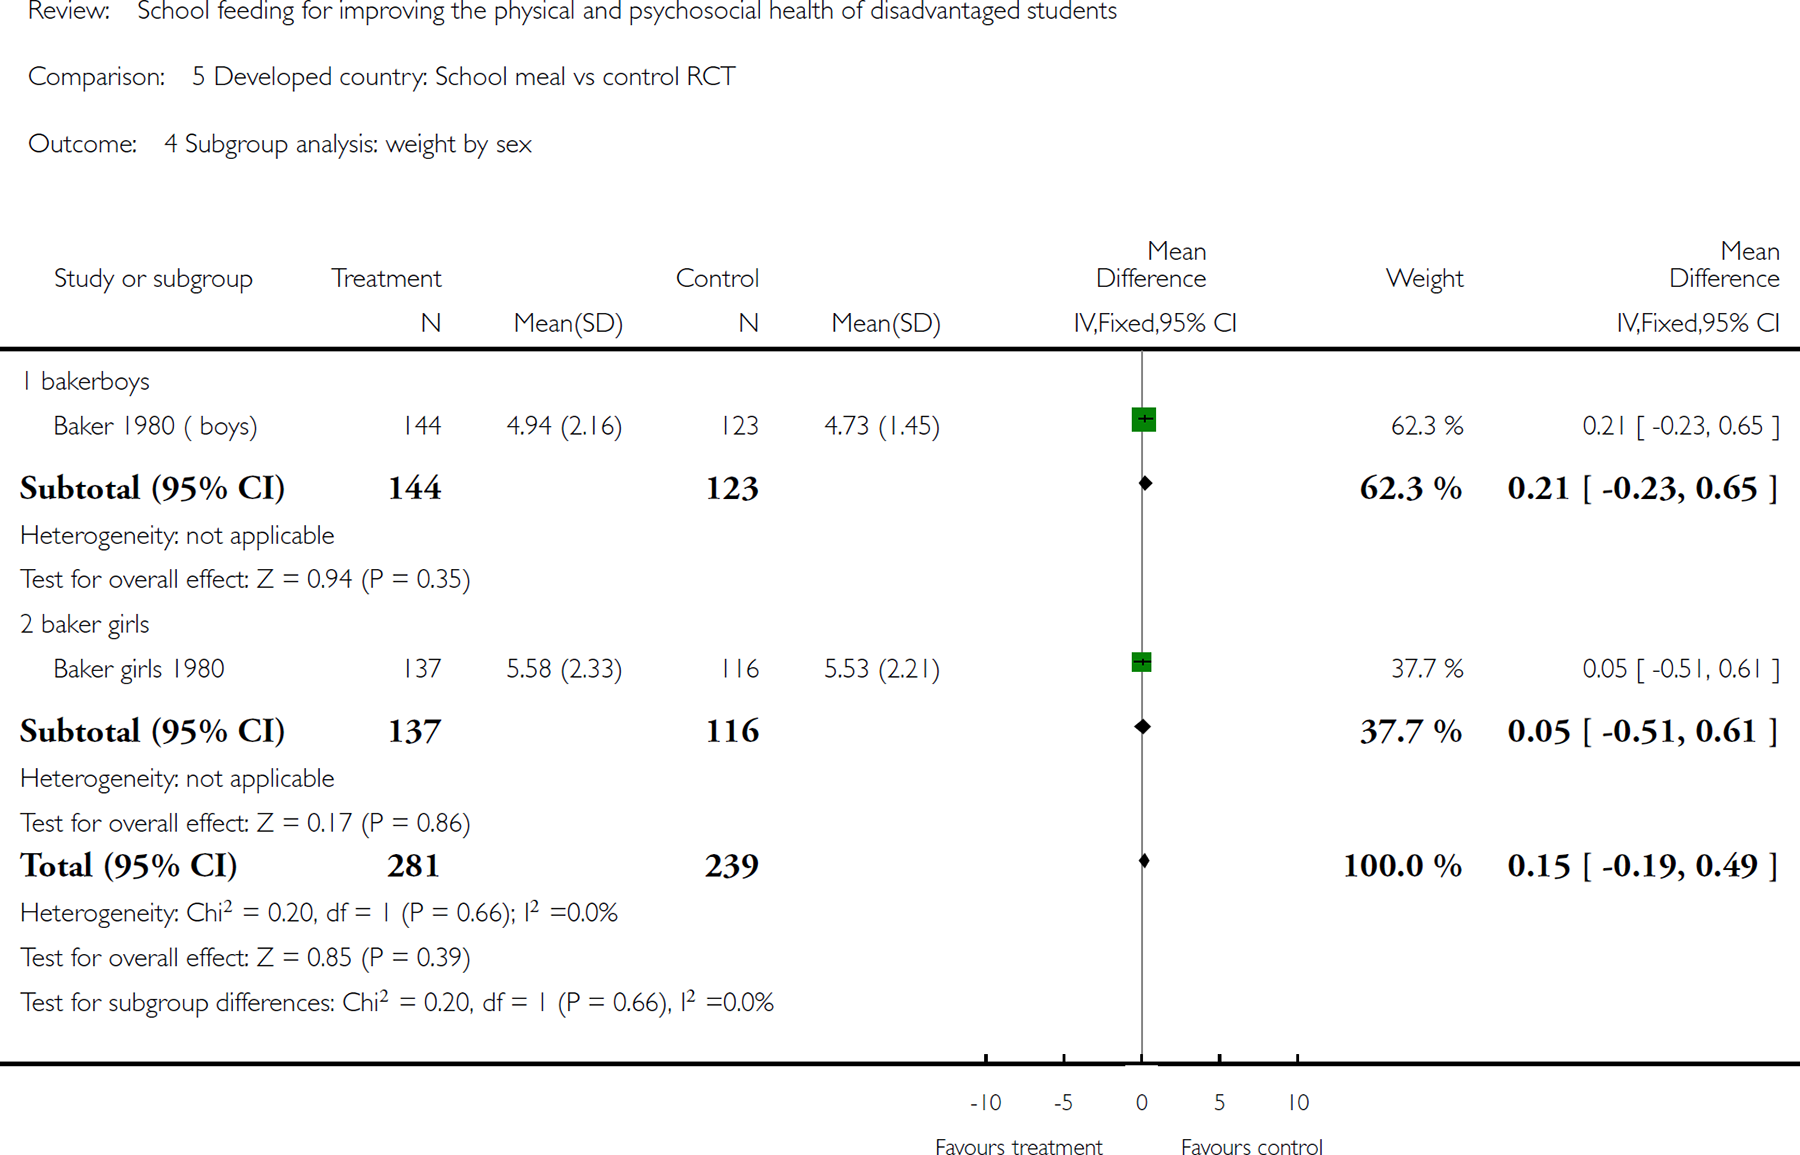
Comparison 5 Developed country: School meal vs control RCT, Outcome 4 Subgroup analysis: weight by sex.
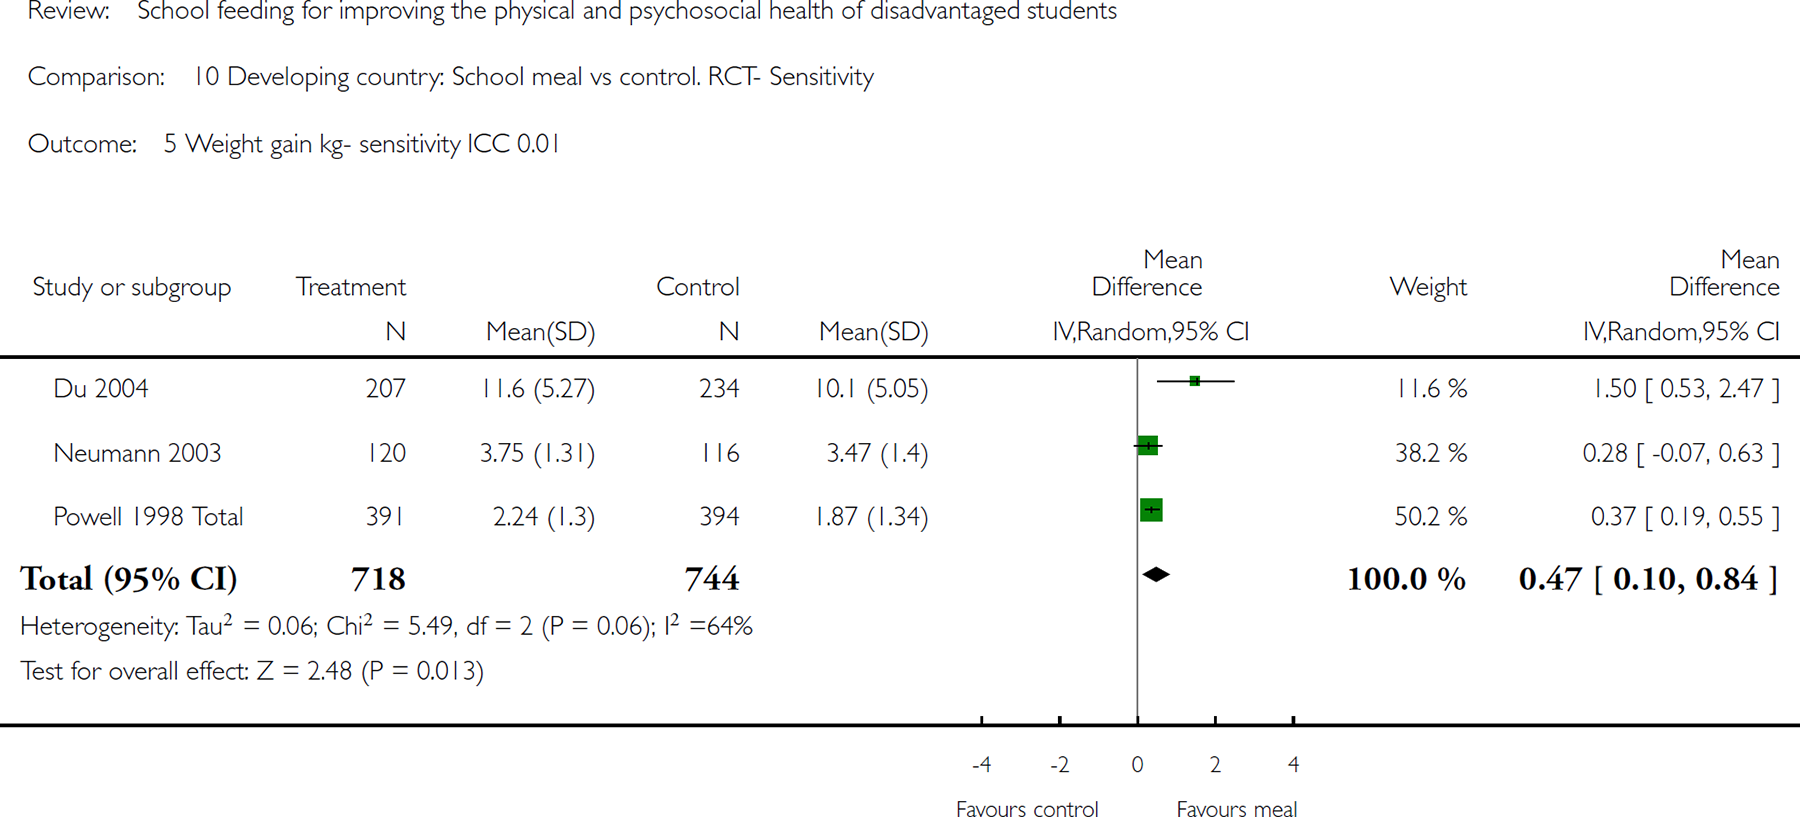
Comparison 10 Developing country: School meal vs control. RCT- Sensitivity, Outcome 5 Weight gain kg- sensitivity ICC 0.01
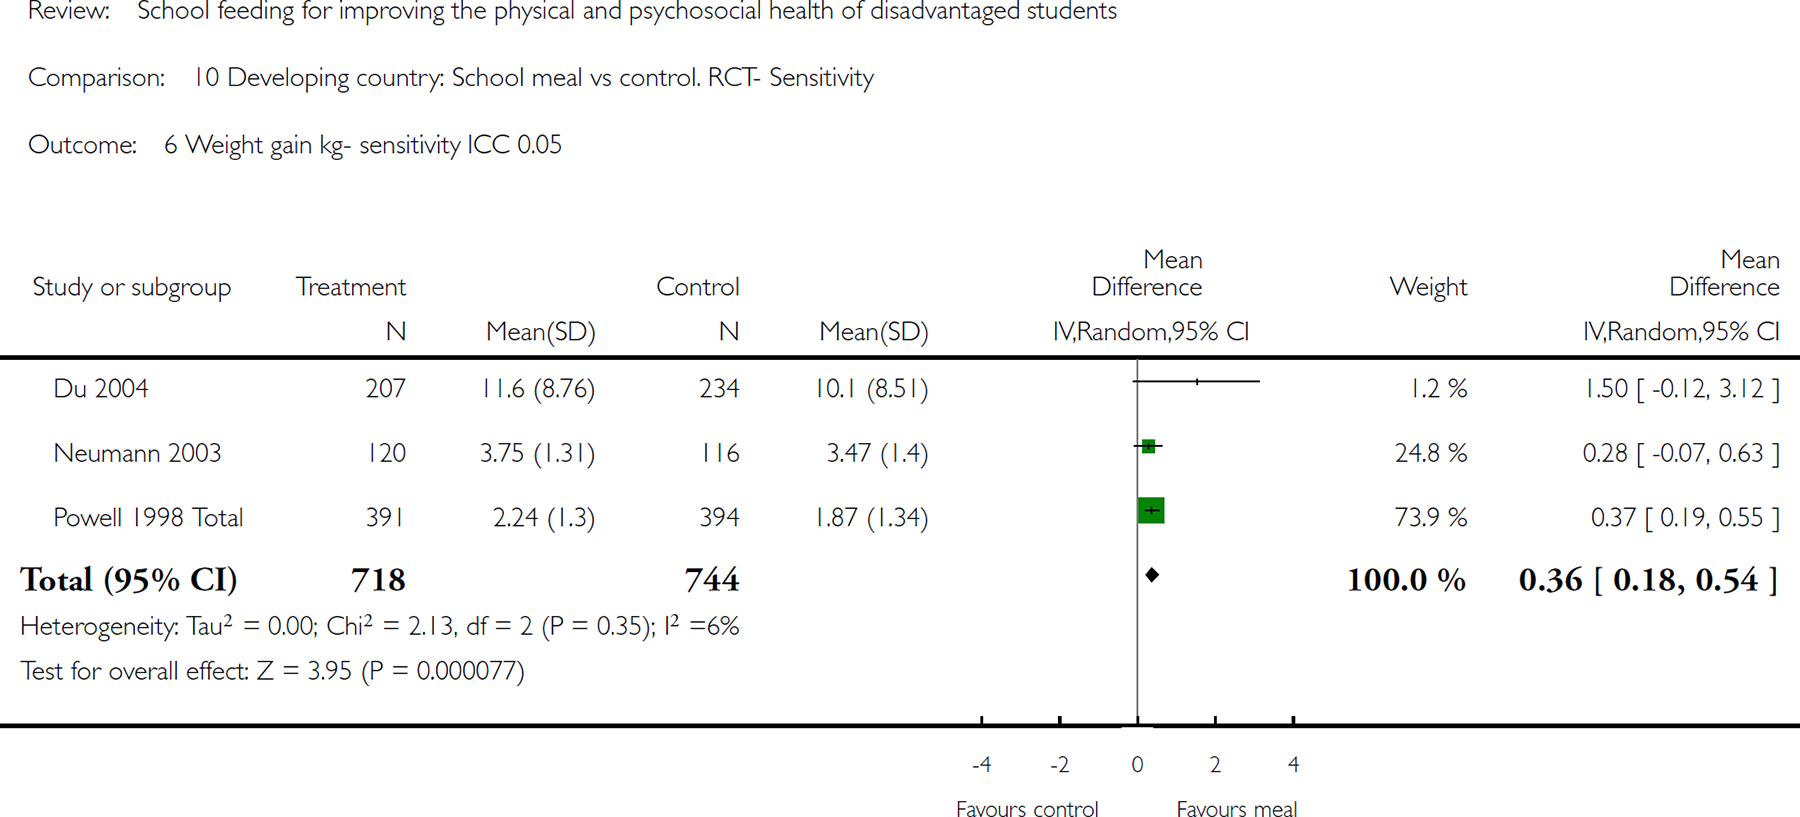
Comparison 10 Developing country: School meal vs control. RCT- Sensitivity, Outcome 6 Weight gain kg- sensitivity ICC 0.05.

Comparison 10 Developing country: School meal vs control. RCT- Sensitivity, Outcome 7 Weight gain kg- sensitivity ICC 0.1.
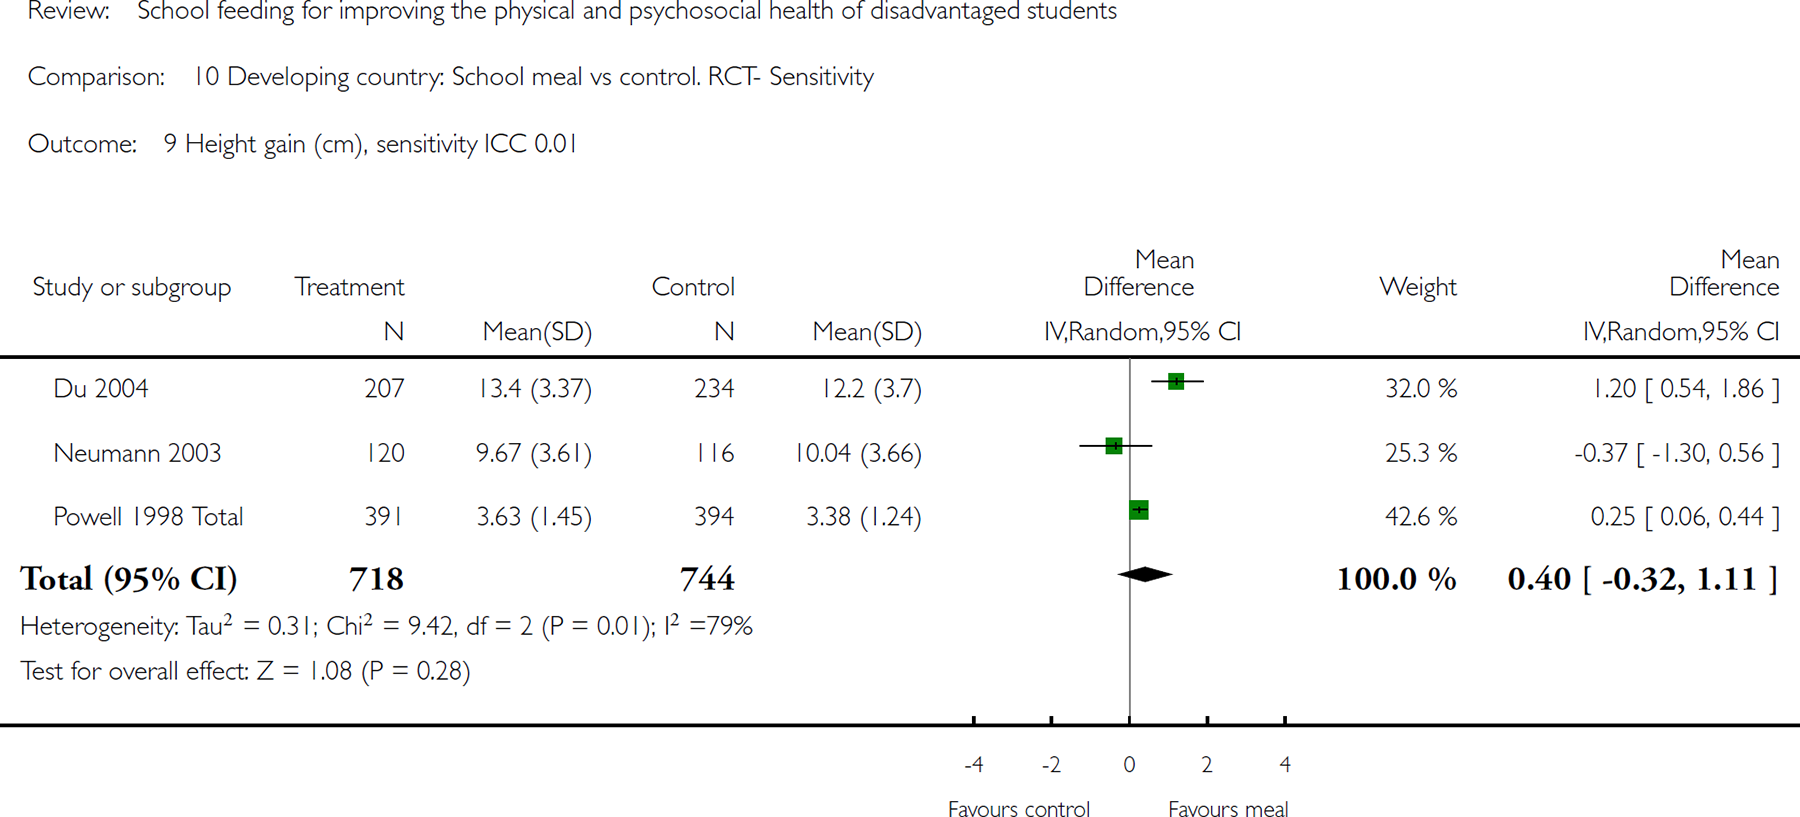
Comparison 10 Developing country: School meal vs control. RCT- Sensitivity, Outcome 9 Height gain (cm), sensitivity ICC 0.01.
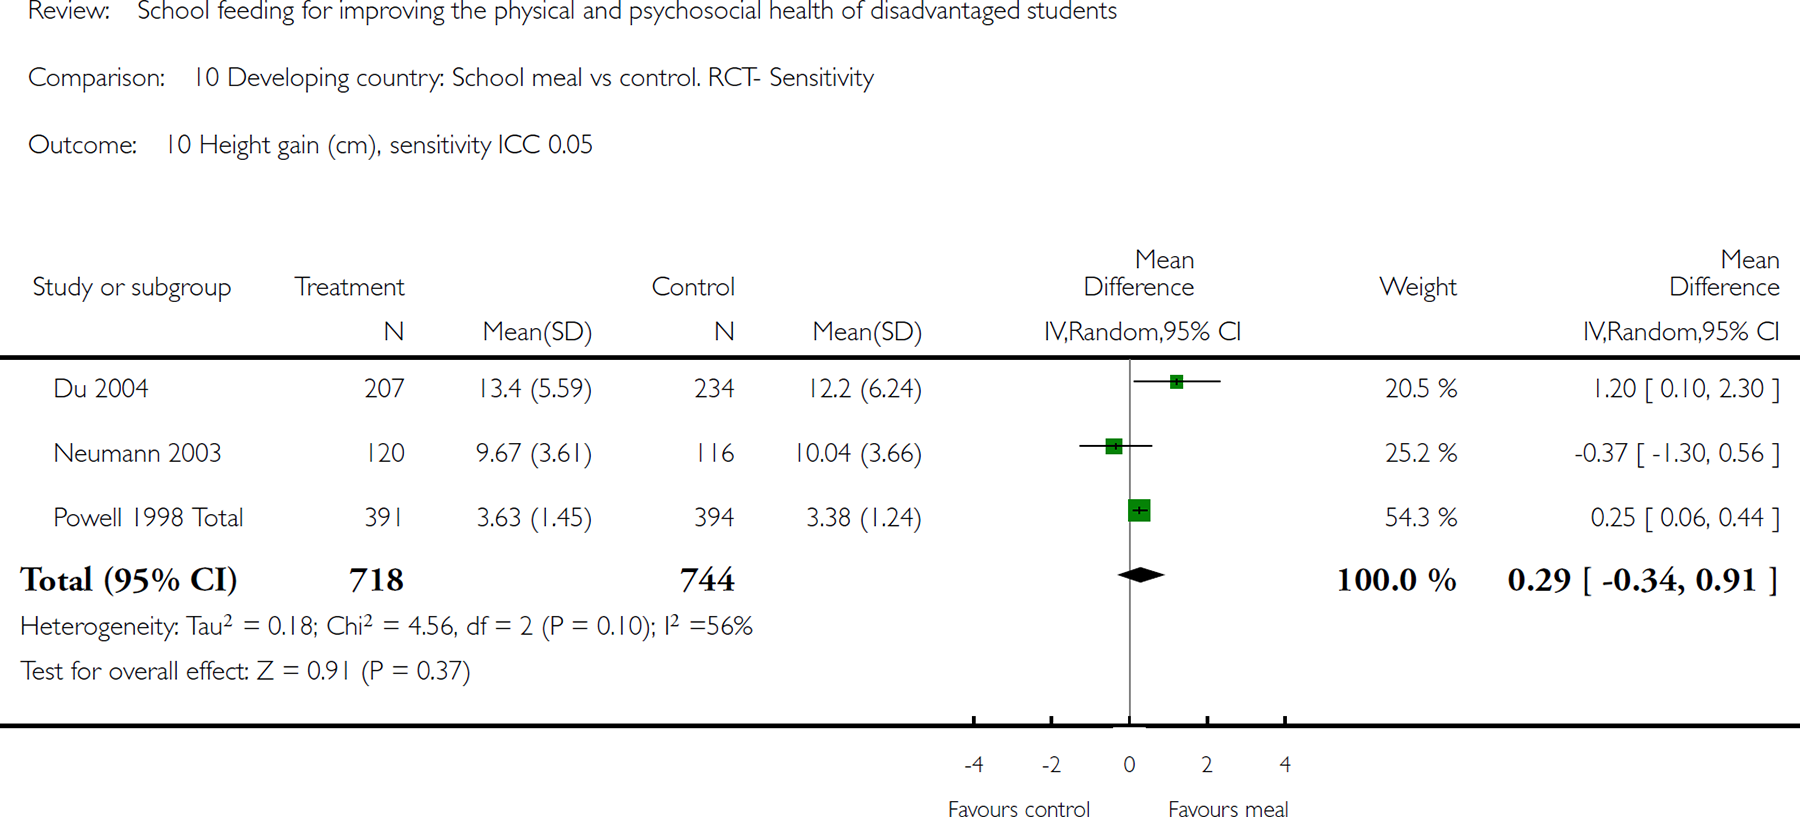
Comparison 10 Developing country: School meal vs control. RCT- Sensitivity, Outcome 10 Height gain (cm), sensitivity ICC 0.05.
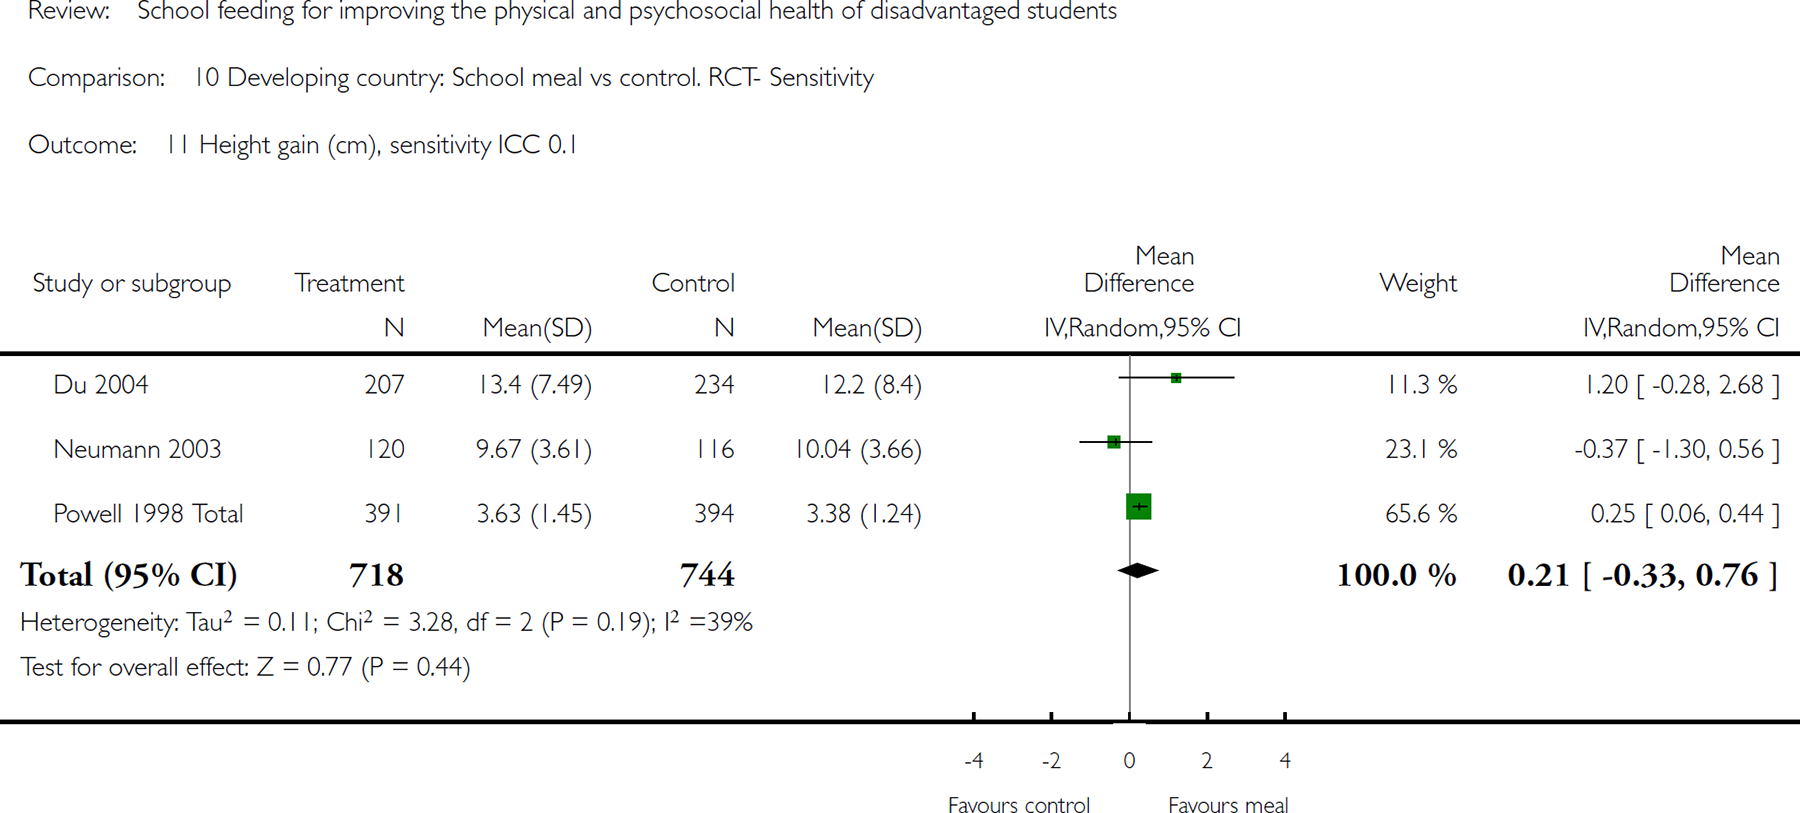
Comparison 10 Developing country: School meal vs control. RCT- Sensitivity, Outcome 11 Height gain (cm), sensitivity ICC 0.1.

Comparison 11 Developing country: School meal vs control. CBA - Sensitivity, Outcome 1 Math change overall icc .1.
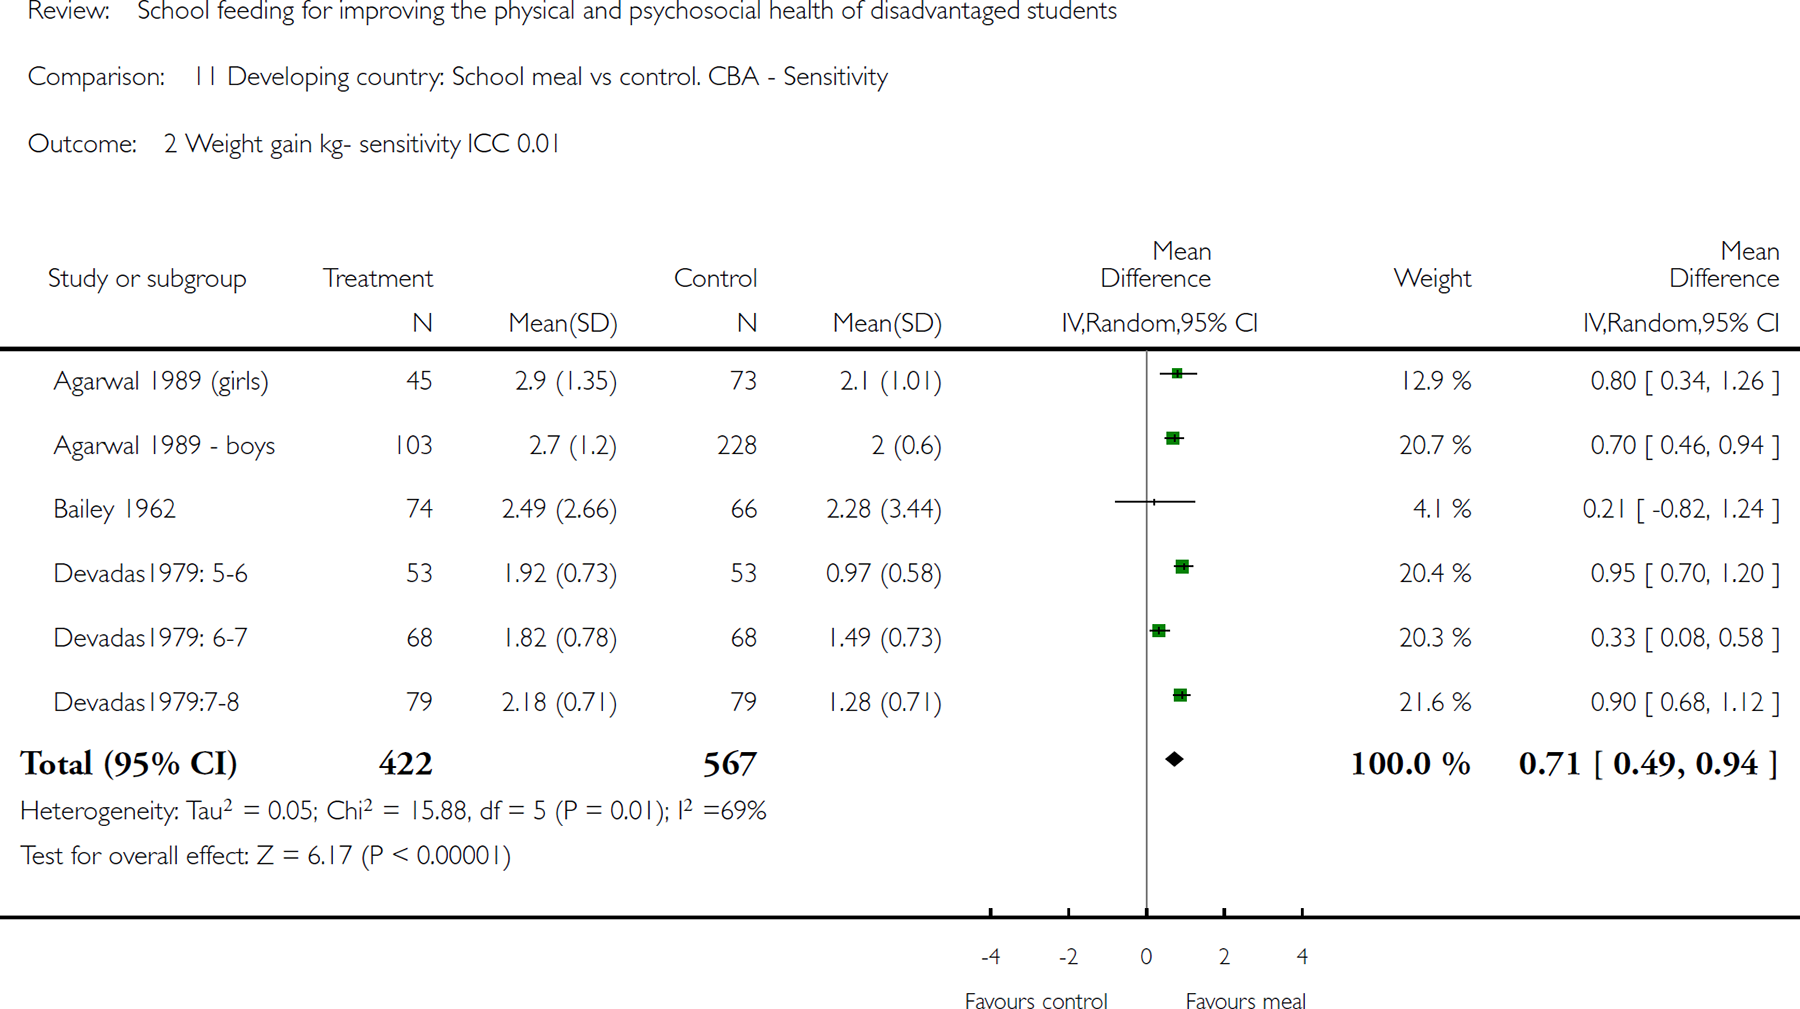
Comparison 11 Developing country: School meal vs control. CBA - Sensitivity, Outcome 2 Weight gain kg- sensitivity ICC 0.01.
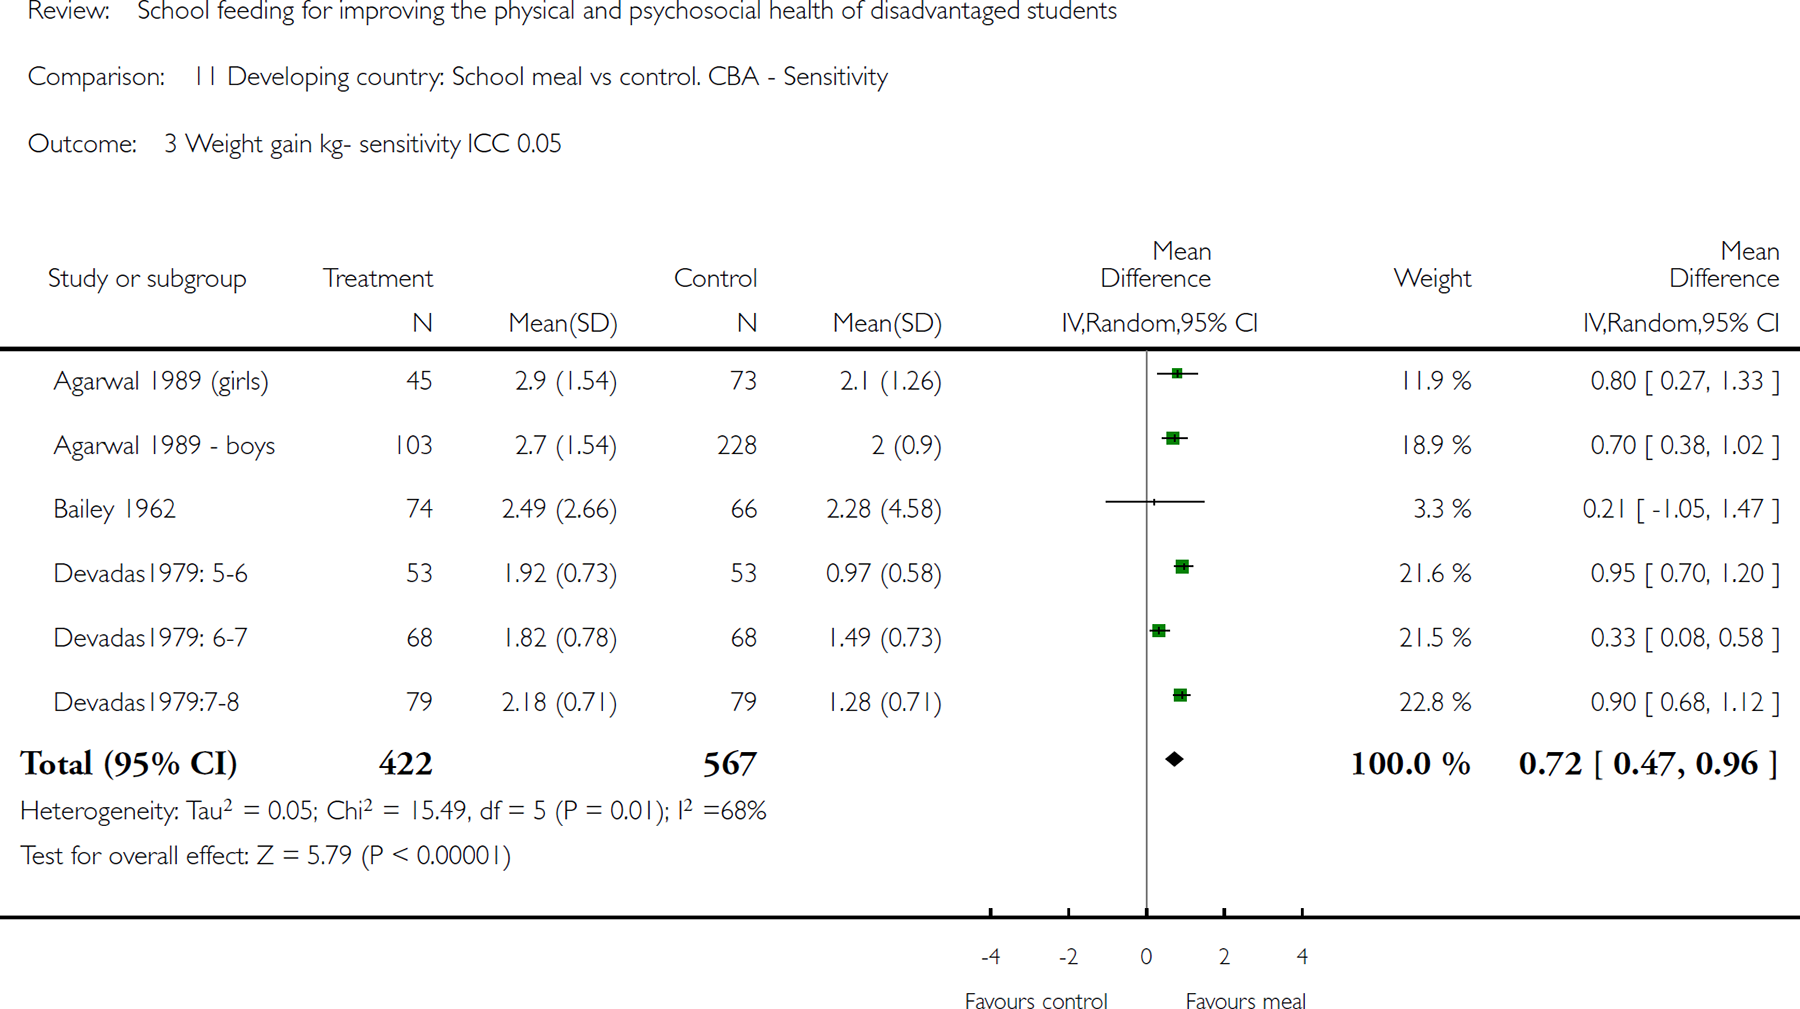
Comparison 11 Developing country: School meal vs control. CBA - Sensitivity, Outcome 3 Weight gain kg- sensitivity ICC 0.05.
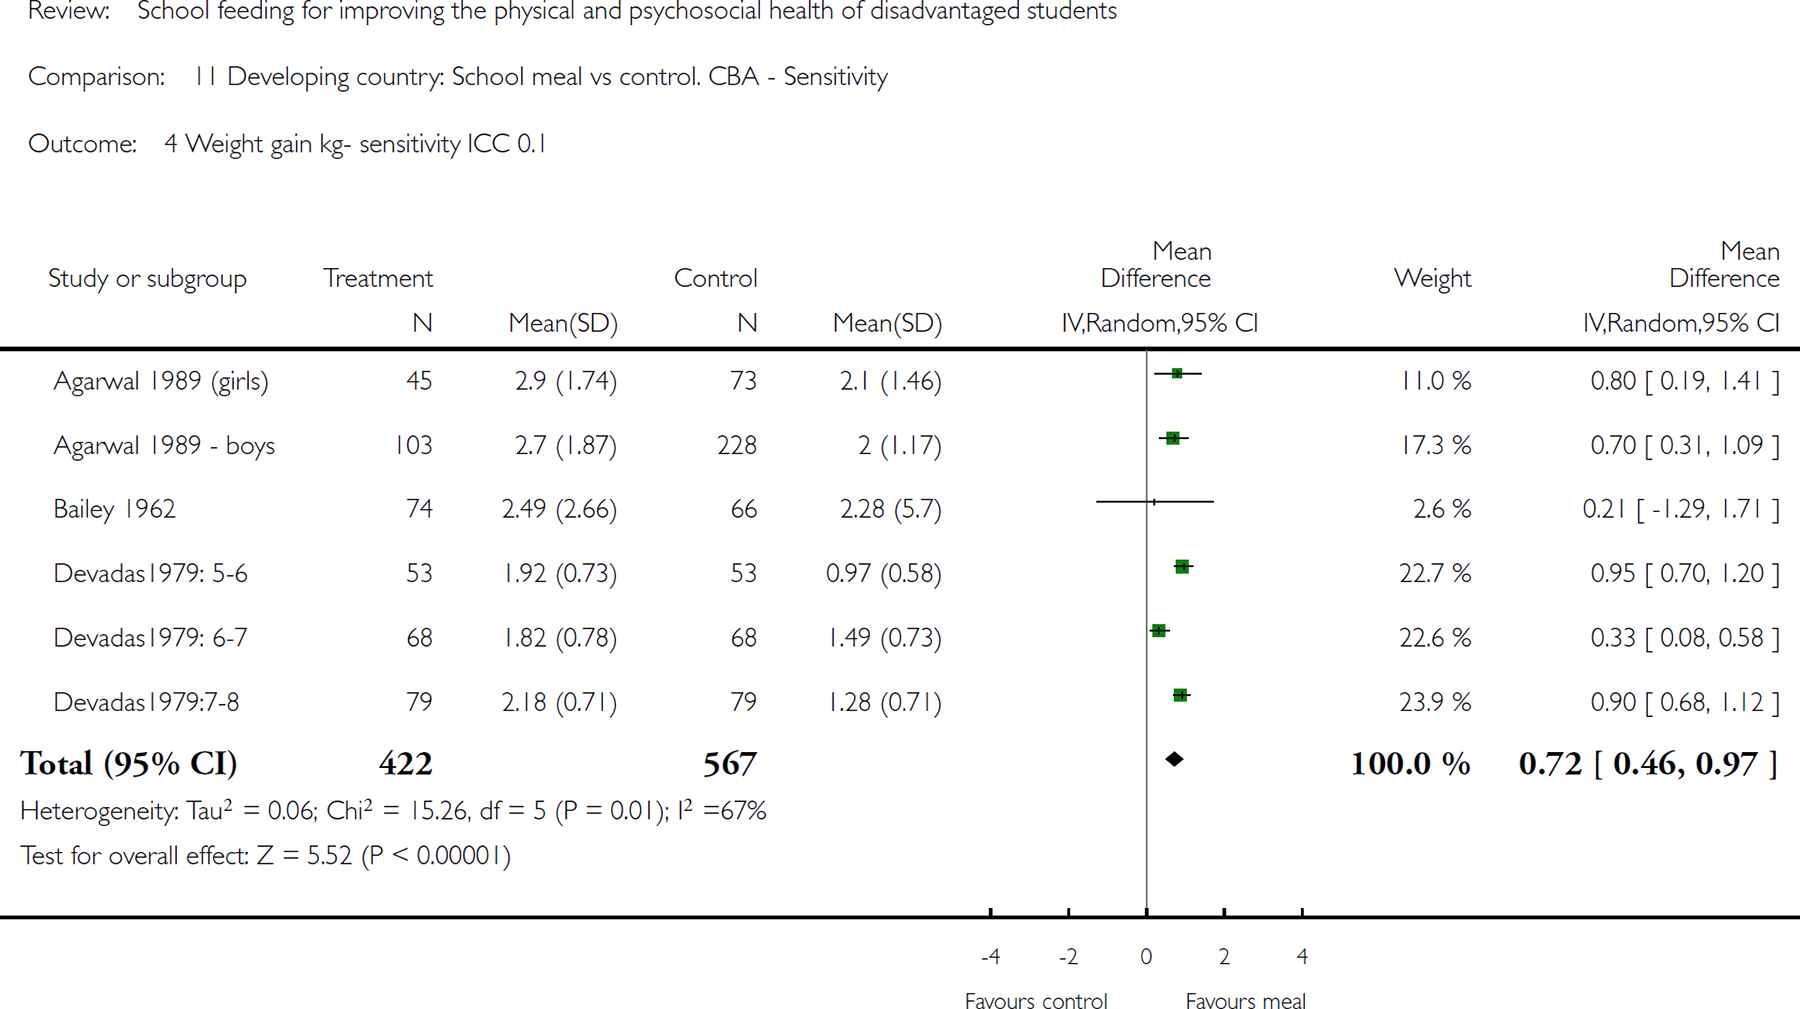
Comparison 11 Developing country: School meal vs control. CBA - Sensitivity, Outcome 4 Weight gain kg- sensitivity ICC 0.1.
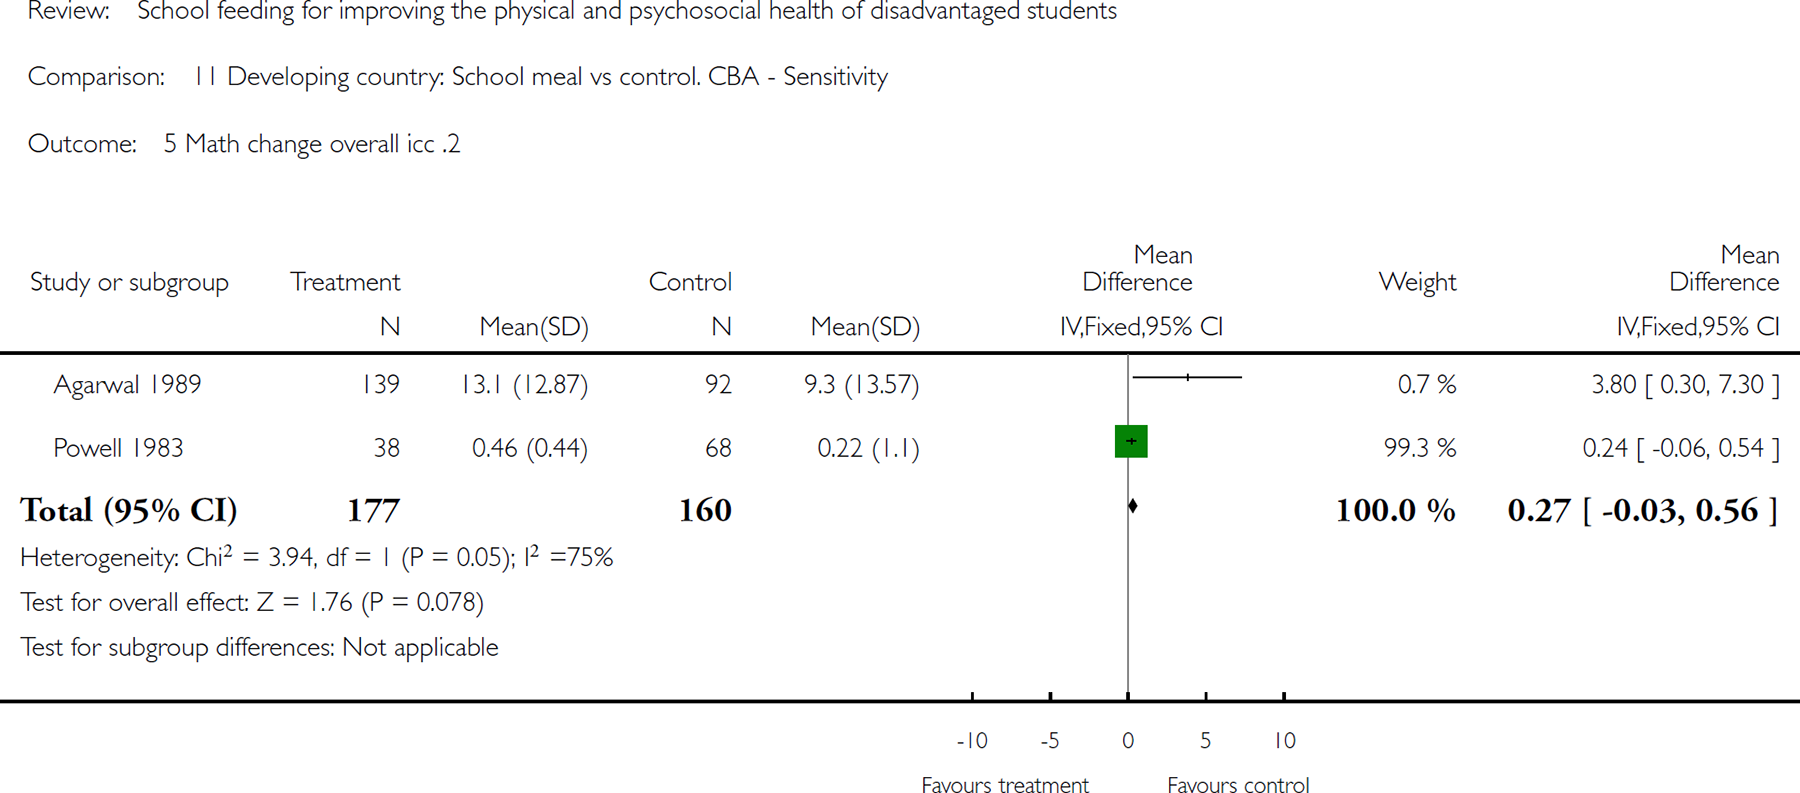
Comparison 11 Developing country: School meal vs control. CBA - Sensitivity, Outcome 5 Math change overall icc .2.
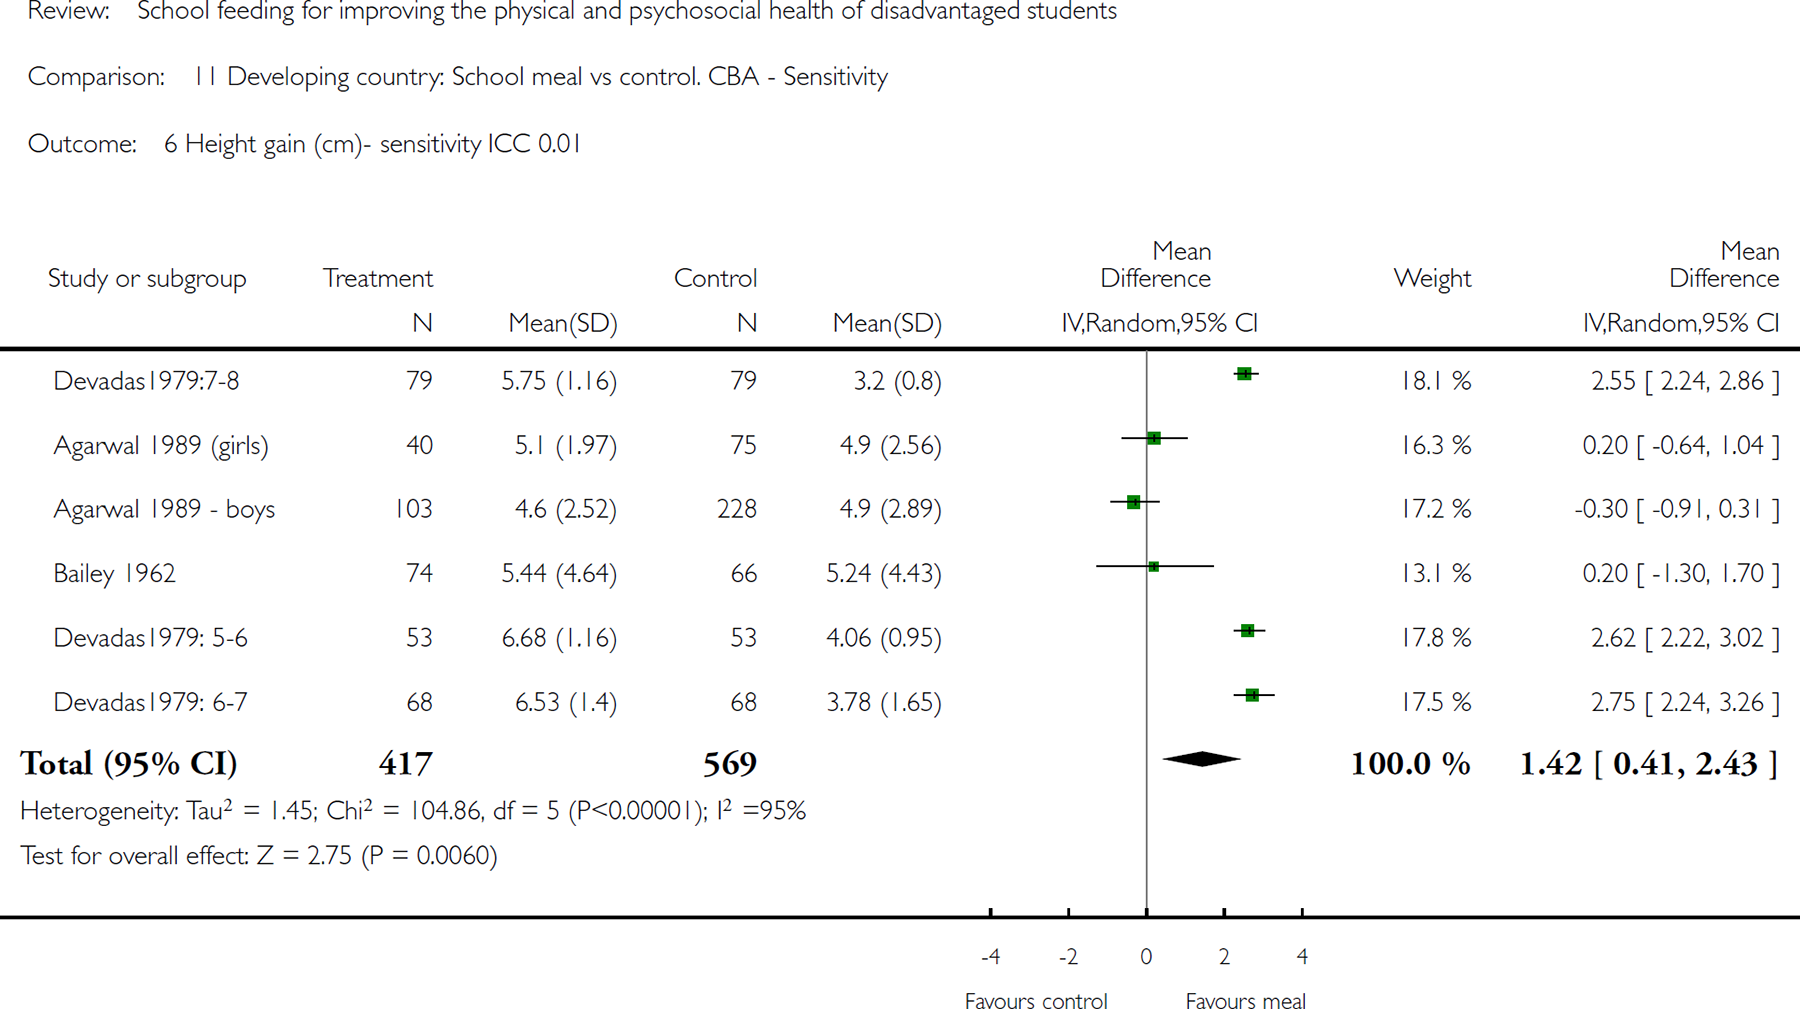
Comparison 11 Developing country: School meal vs control. CBA - Sensitivity, Outcome 6 Height gain (cm)- sensitivity ICC 0.01.
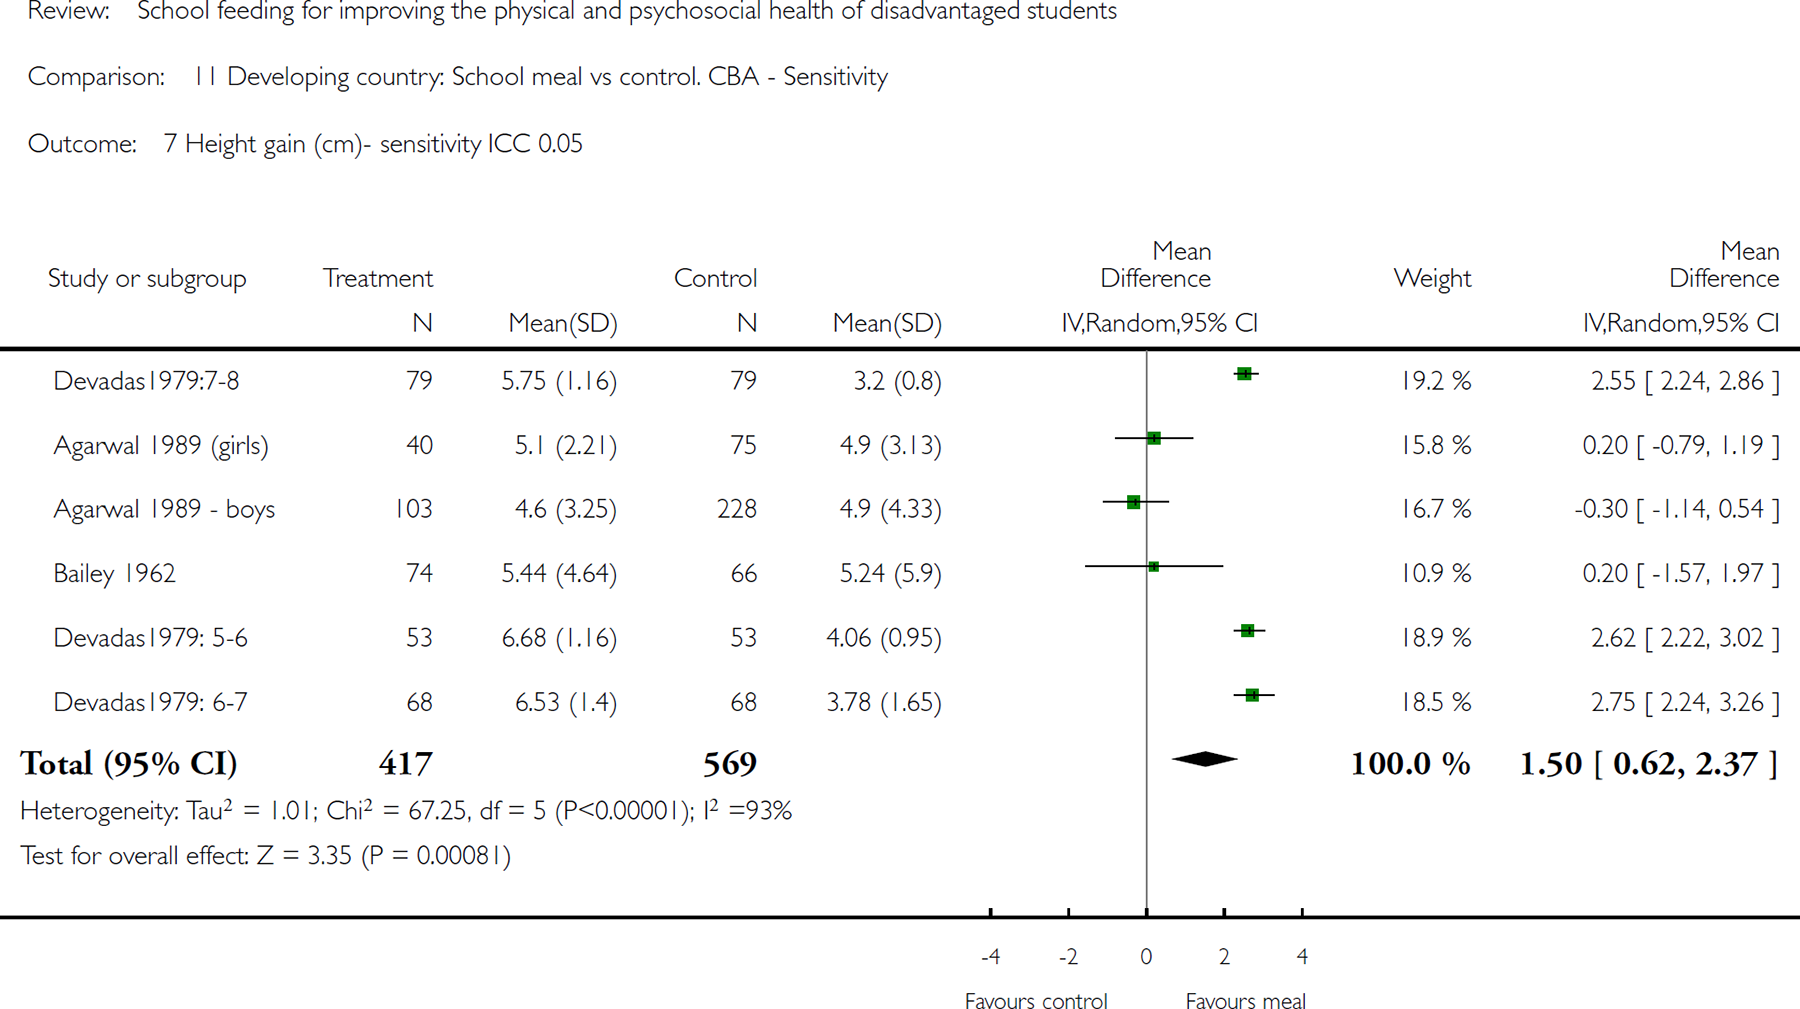
Comparison 11 Developing country: School meal vs control. CBA - Sensitivity, Outcome 7 Height gain (cm)- sensitivity ICC 0.05.
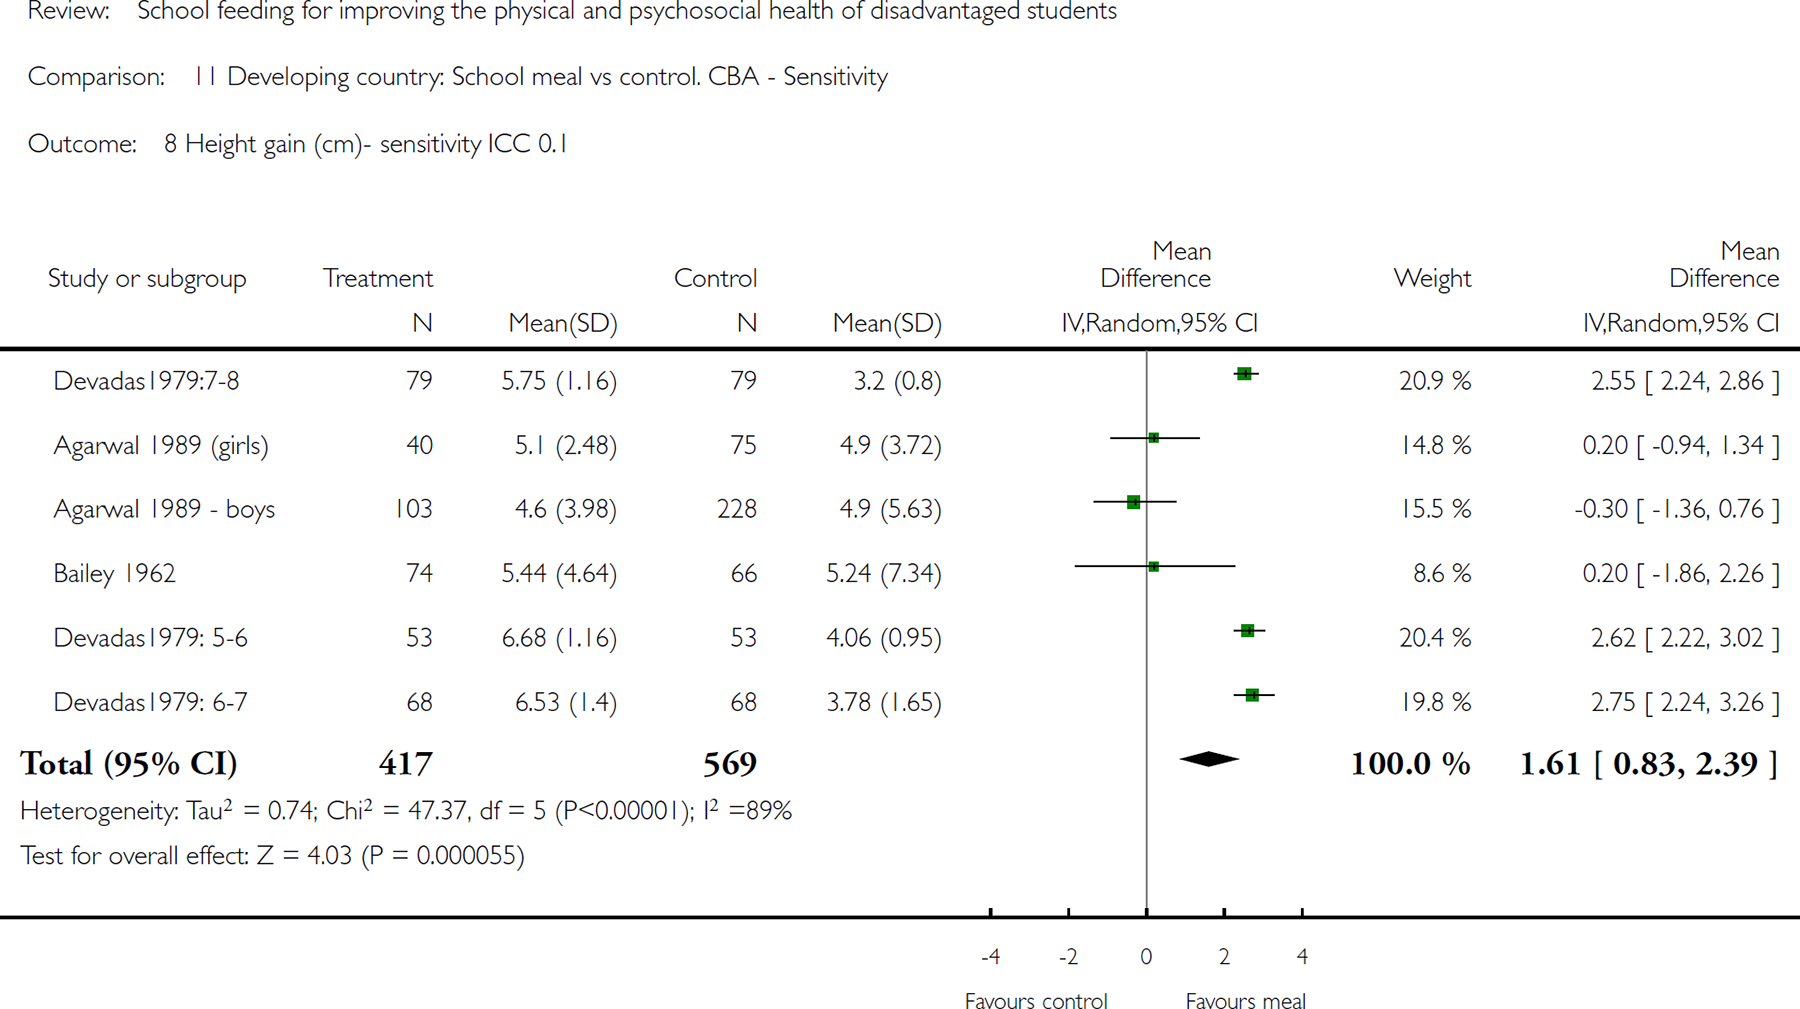
Comparison 11 Developing country: School meal vs control. CBA - Sensitivity, Outcome 8 Height gain (cm)- sensitivity ICC 0.1.
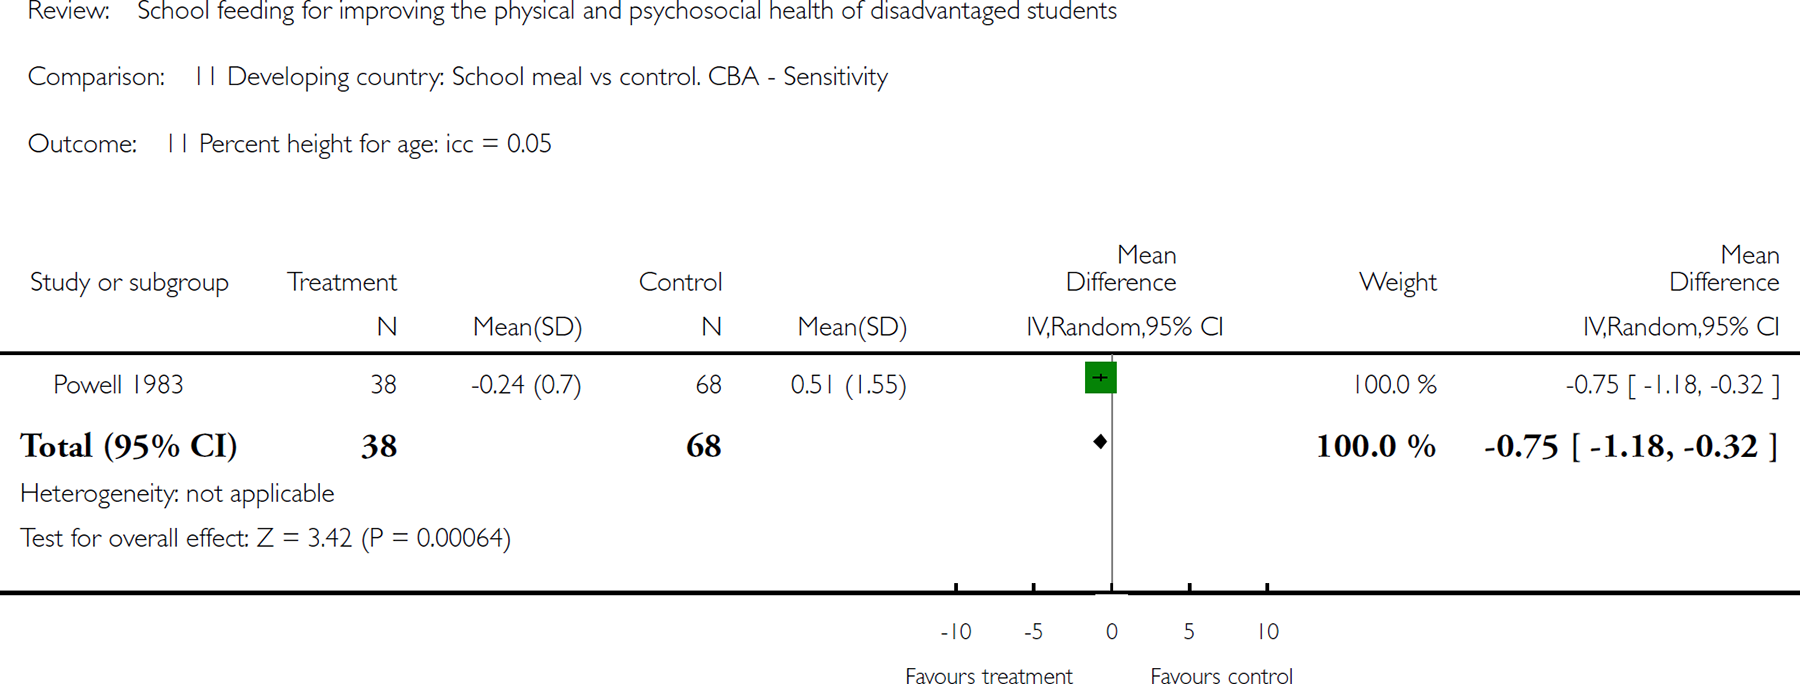
Comparison 11 Developing country: School meal vs control. CBA - Sensitivity, Outcome 11 Percent height for age: icc = 0.05.
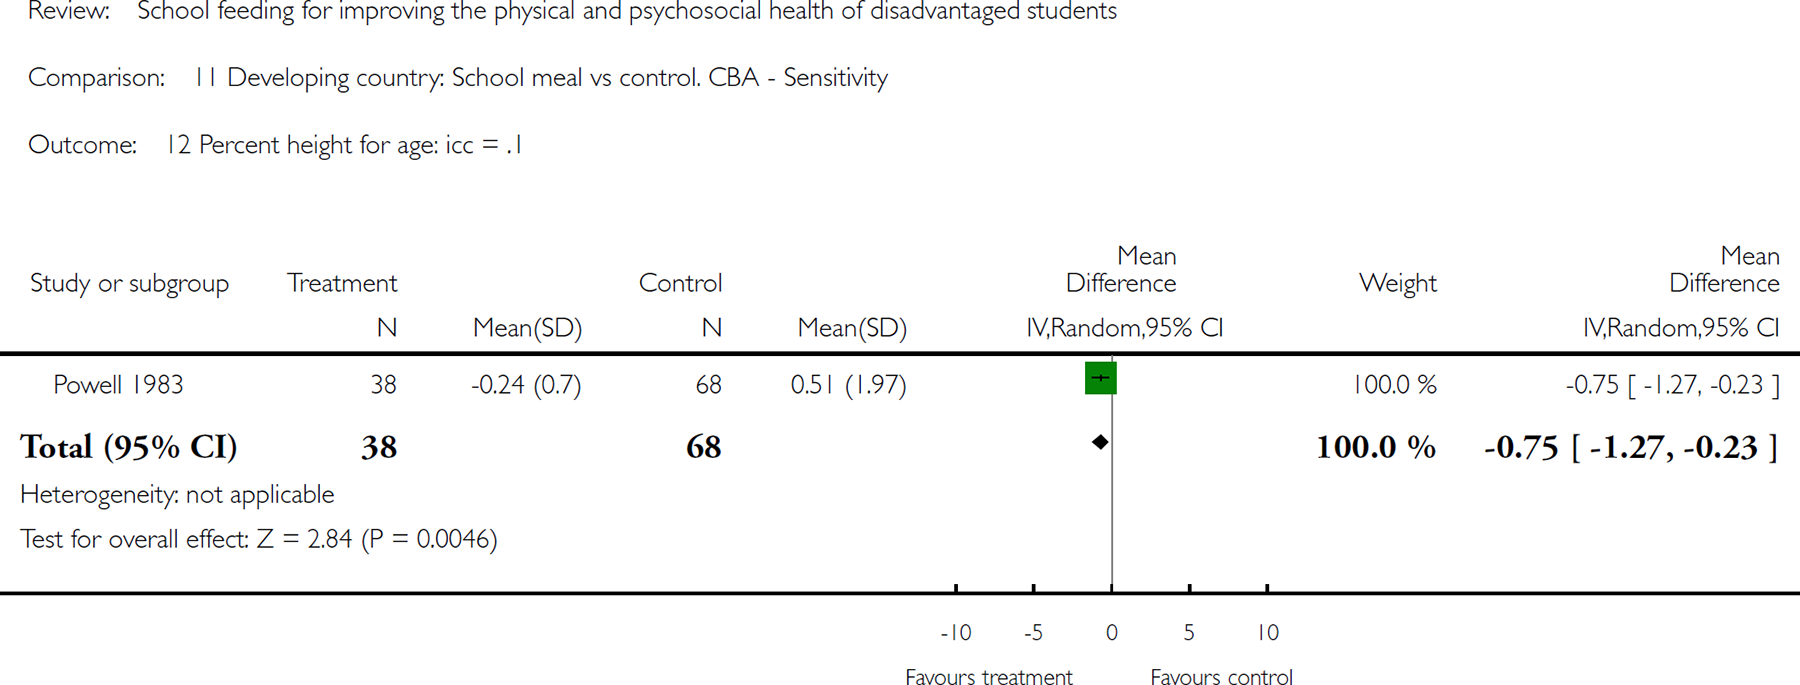
Comparison 11 Developing country: School meal vs control. CBA - Sensitivity, Outcome 12 Percent height for age: icc = .1.
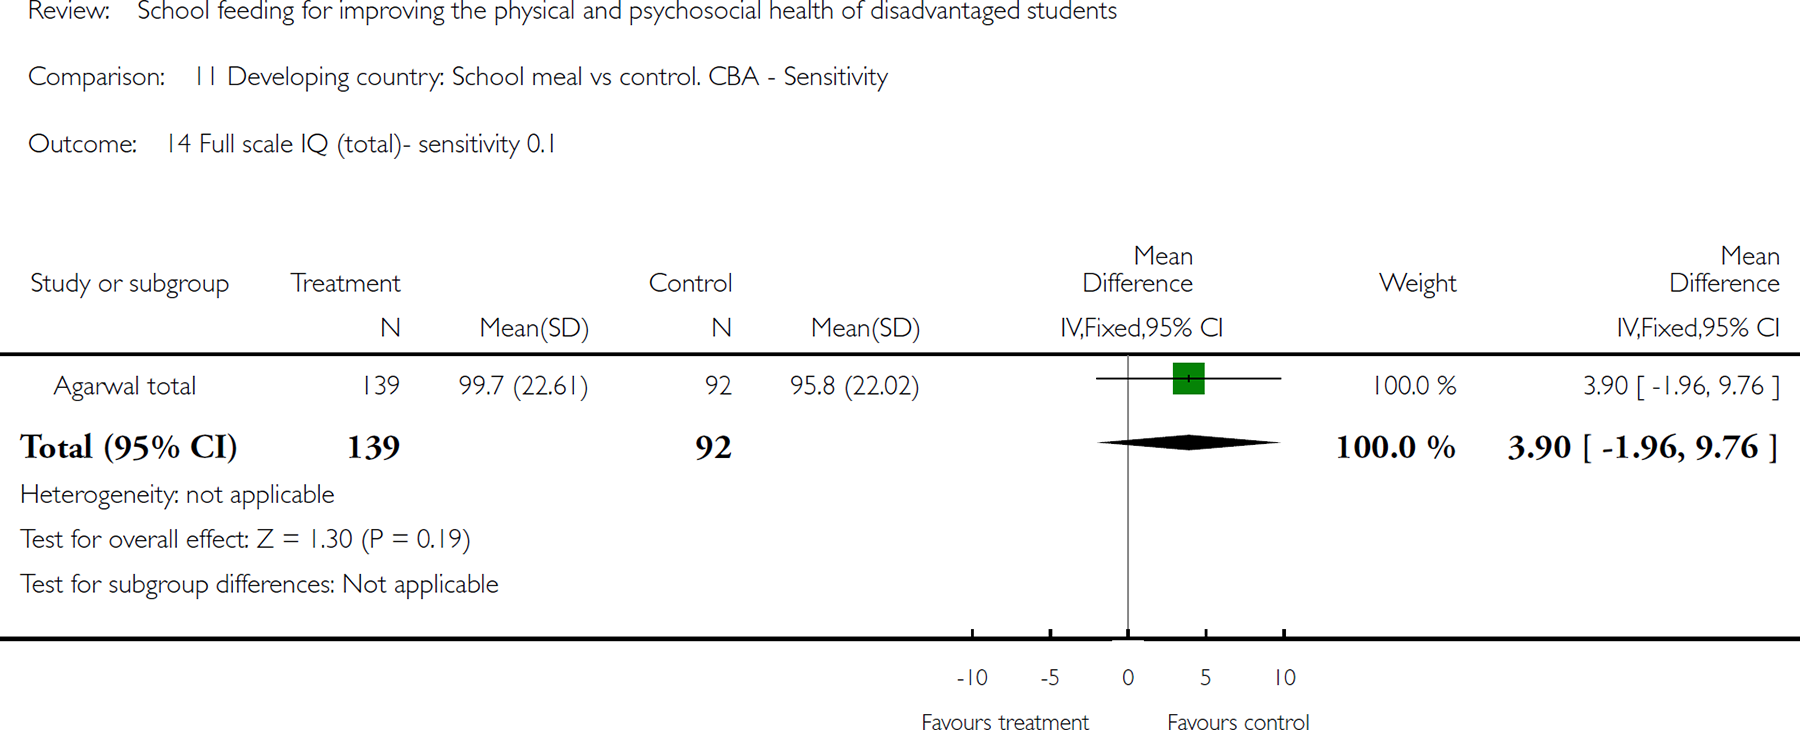
Comparison 11 Developing country: School meal vs control. CBA - Sensitivity, Outcome 14 Full scale IQ (total)- sensitivity 0.1.
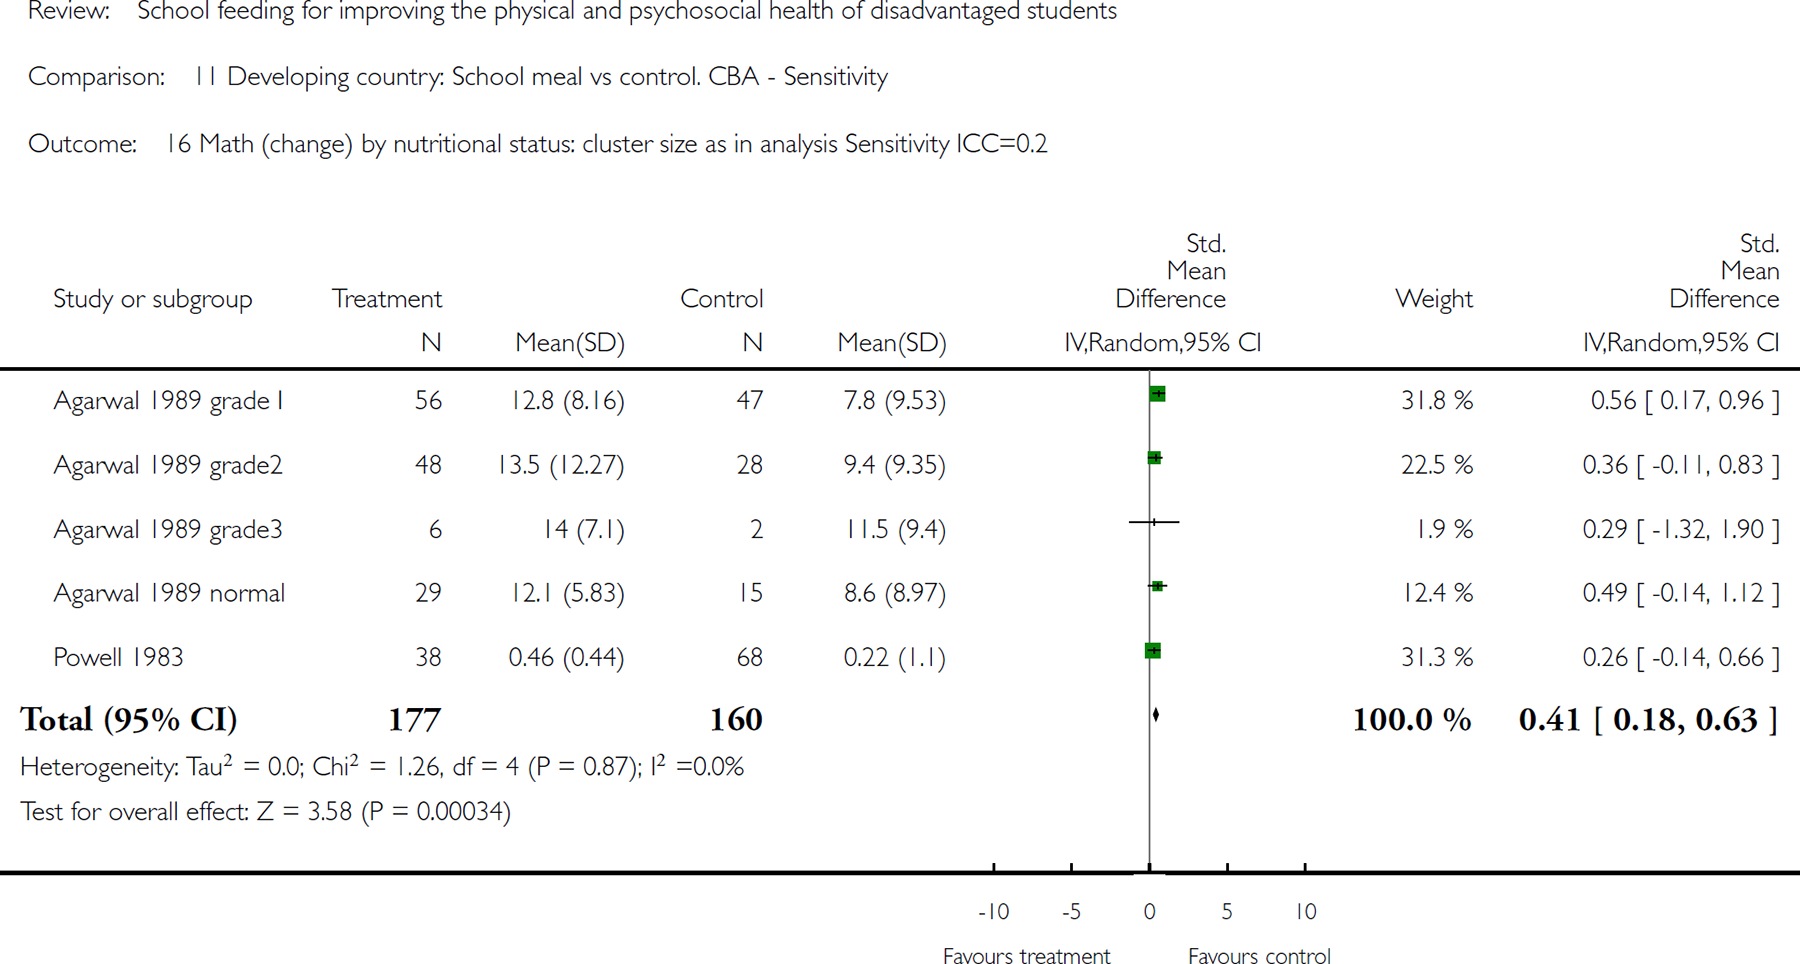
Comparison 11 Developing country: School meal vs control. CBA - Sensitivity, Outcome 16 Math (change) by nutritional status: cluster size as in analysis Sensitivity ICC=0.2.
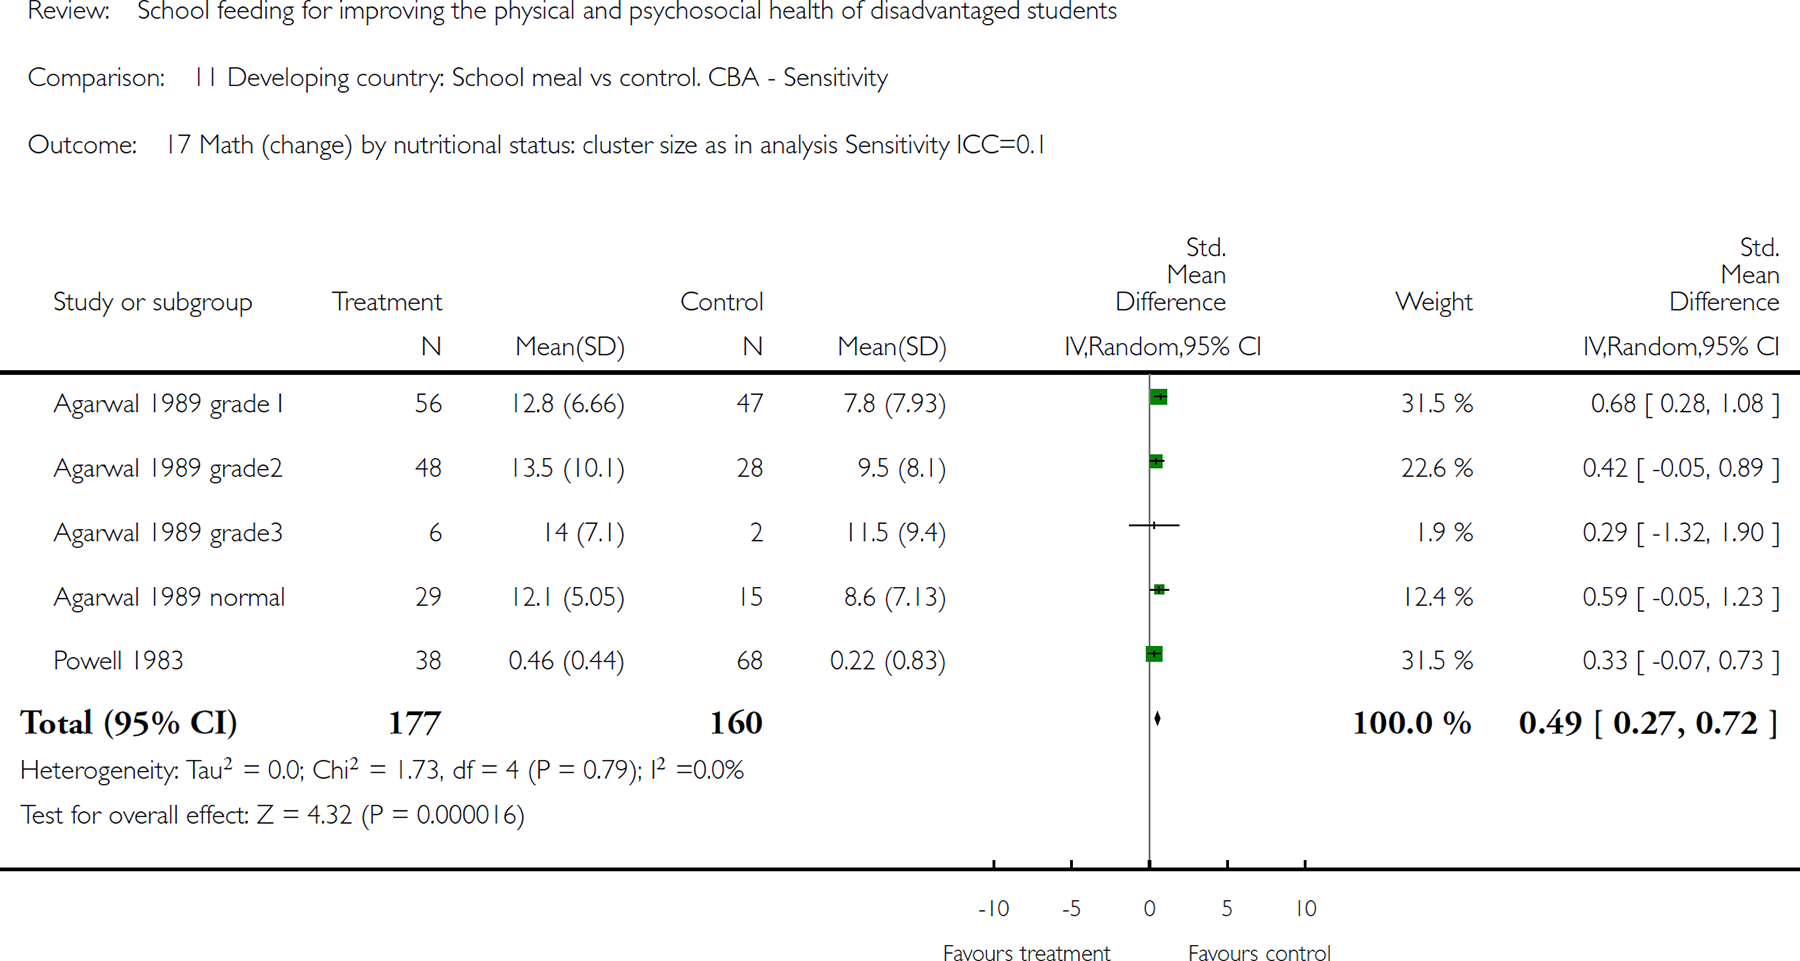
Comparison 11 Developing country: School meal vs control. CBA - Sensitivity, Outcome 17 Math (change) by nutritional status: cluster size as in analysis Sensitivity ICC=0.1.
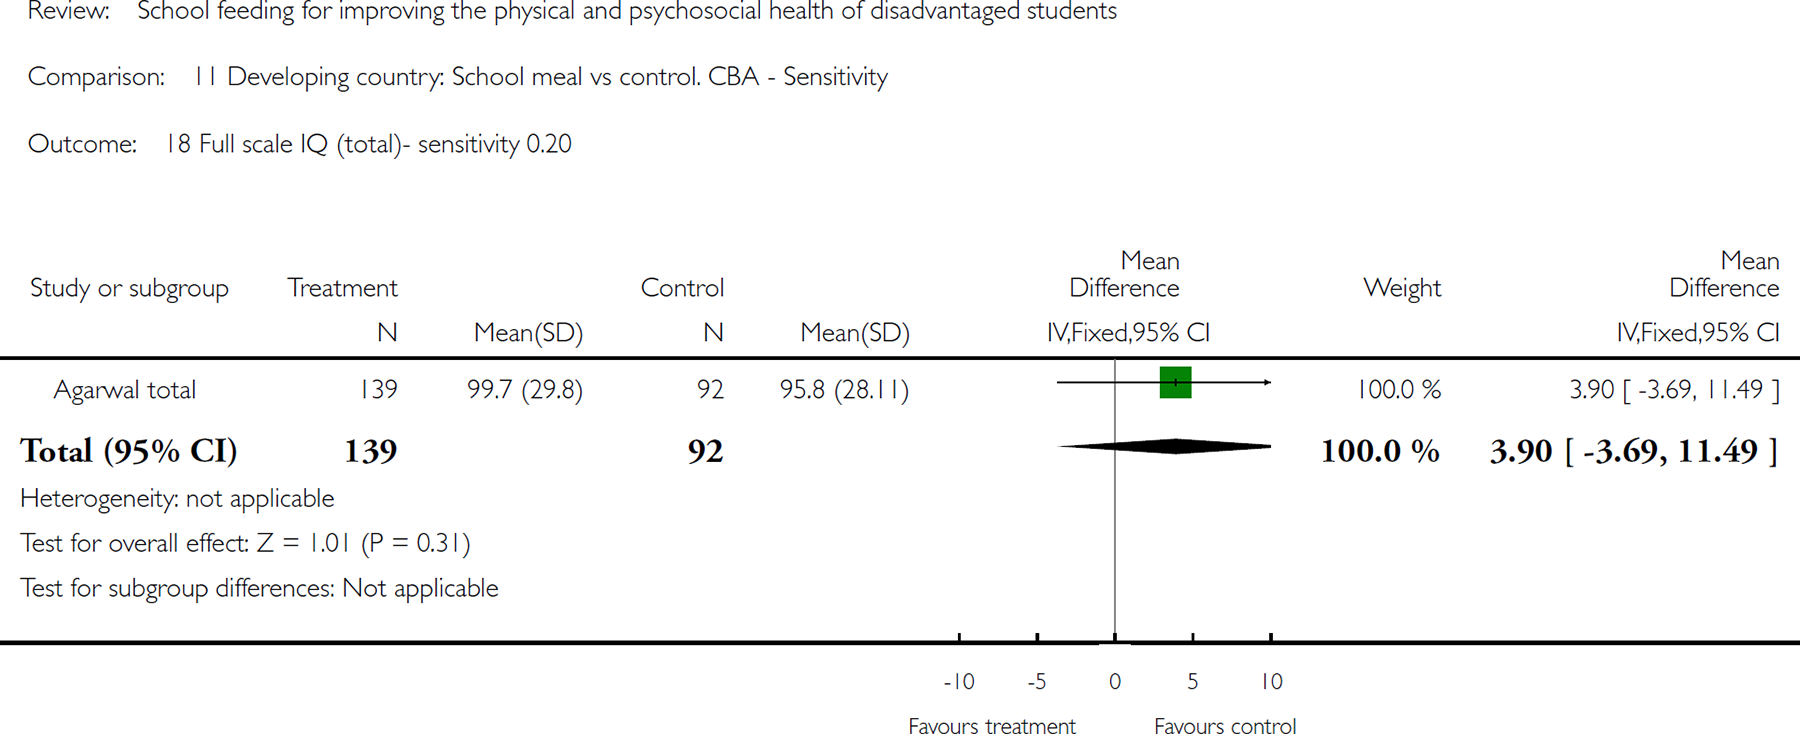
Comparison 11 Developing country: School meal vs control. CBA - Sensitivity, Outcome 18 Full scale IQ (total)- sensitivity 0.20.
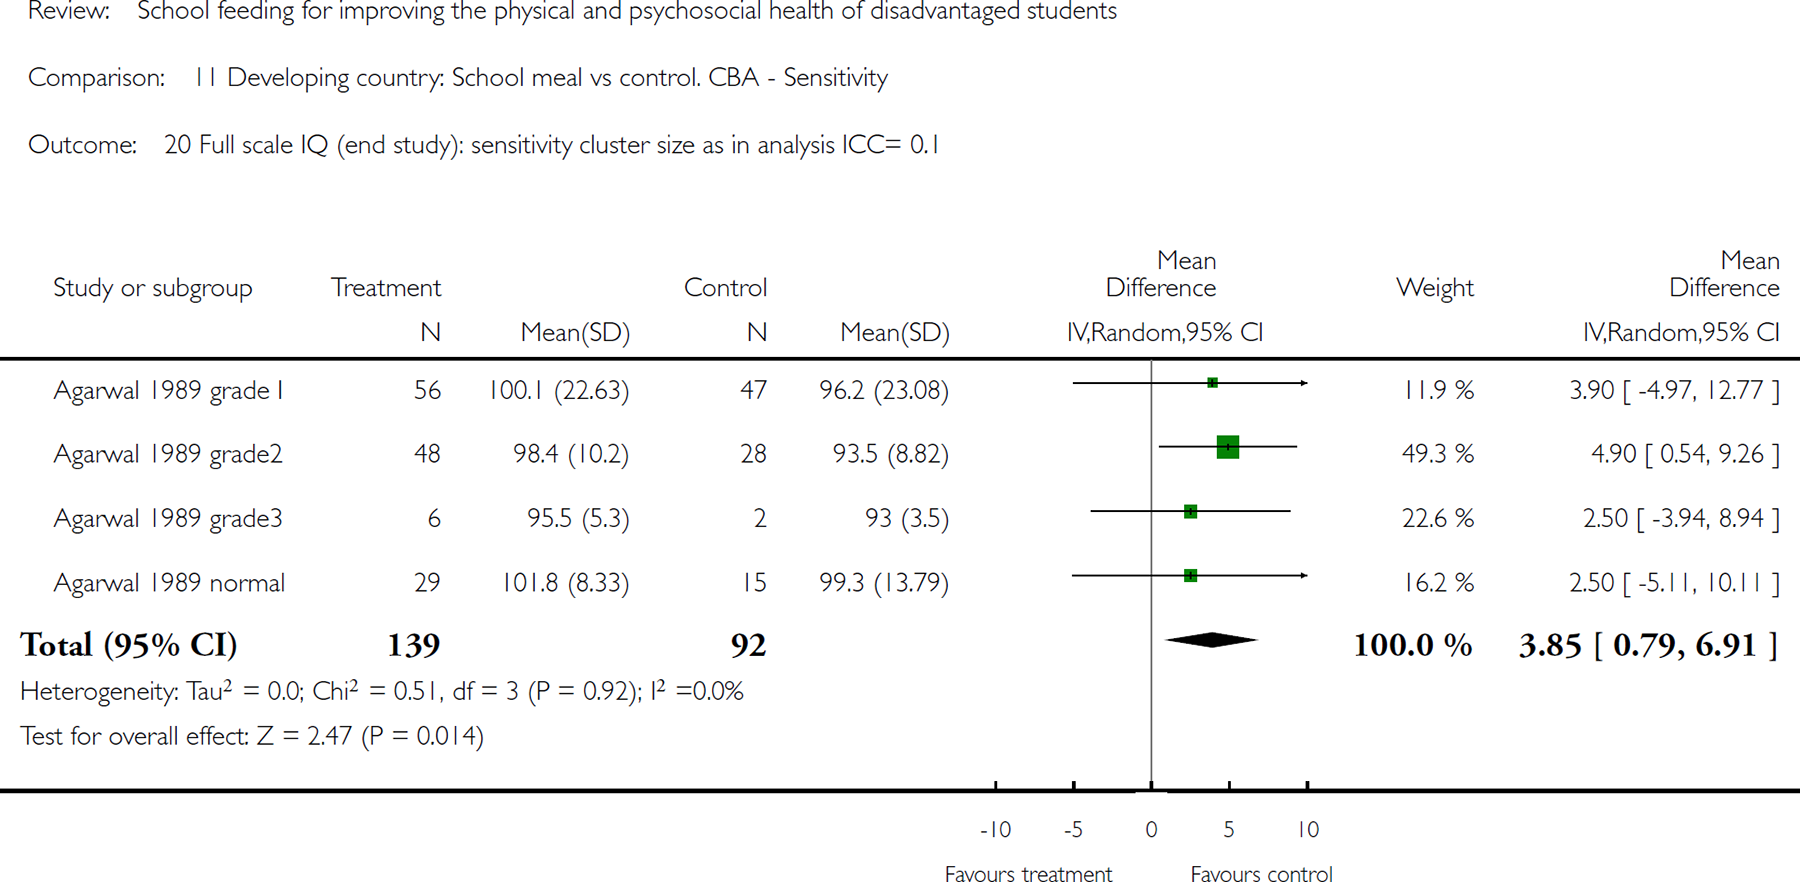
Comparison 11 Developing country: School meal vs control. CBA - Sensitivity, Outcome 20 Full scale IQ (end study): sensitivity cluster size as in analysis ICC= 0.1.
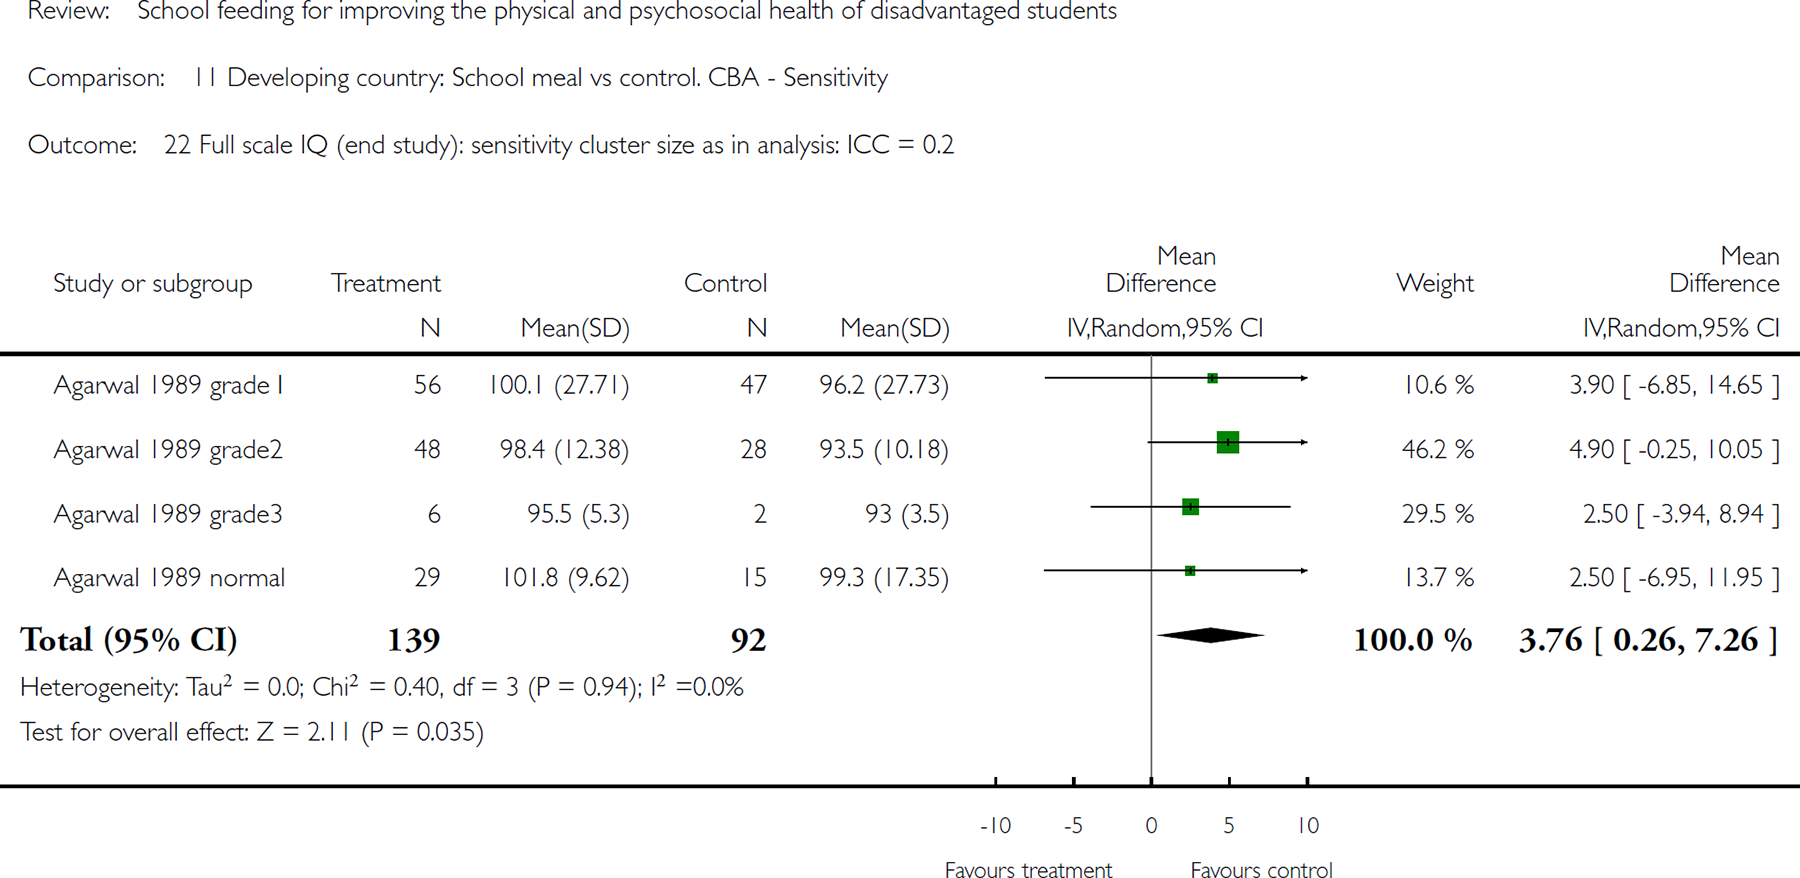
Comparison 11 Developing country: School meal vs control. CBA - Sensitivity, Outcome 22 Full scale IQ (end study): sensitivity cluster size as in analysis: ICC = 0.2.
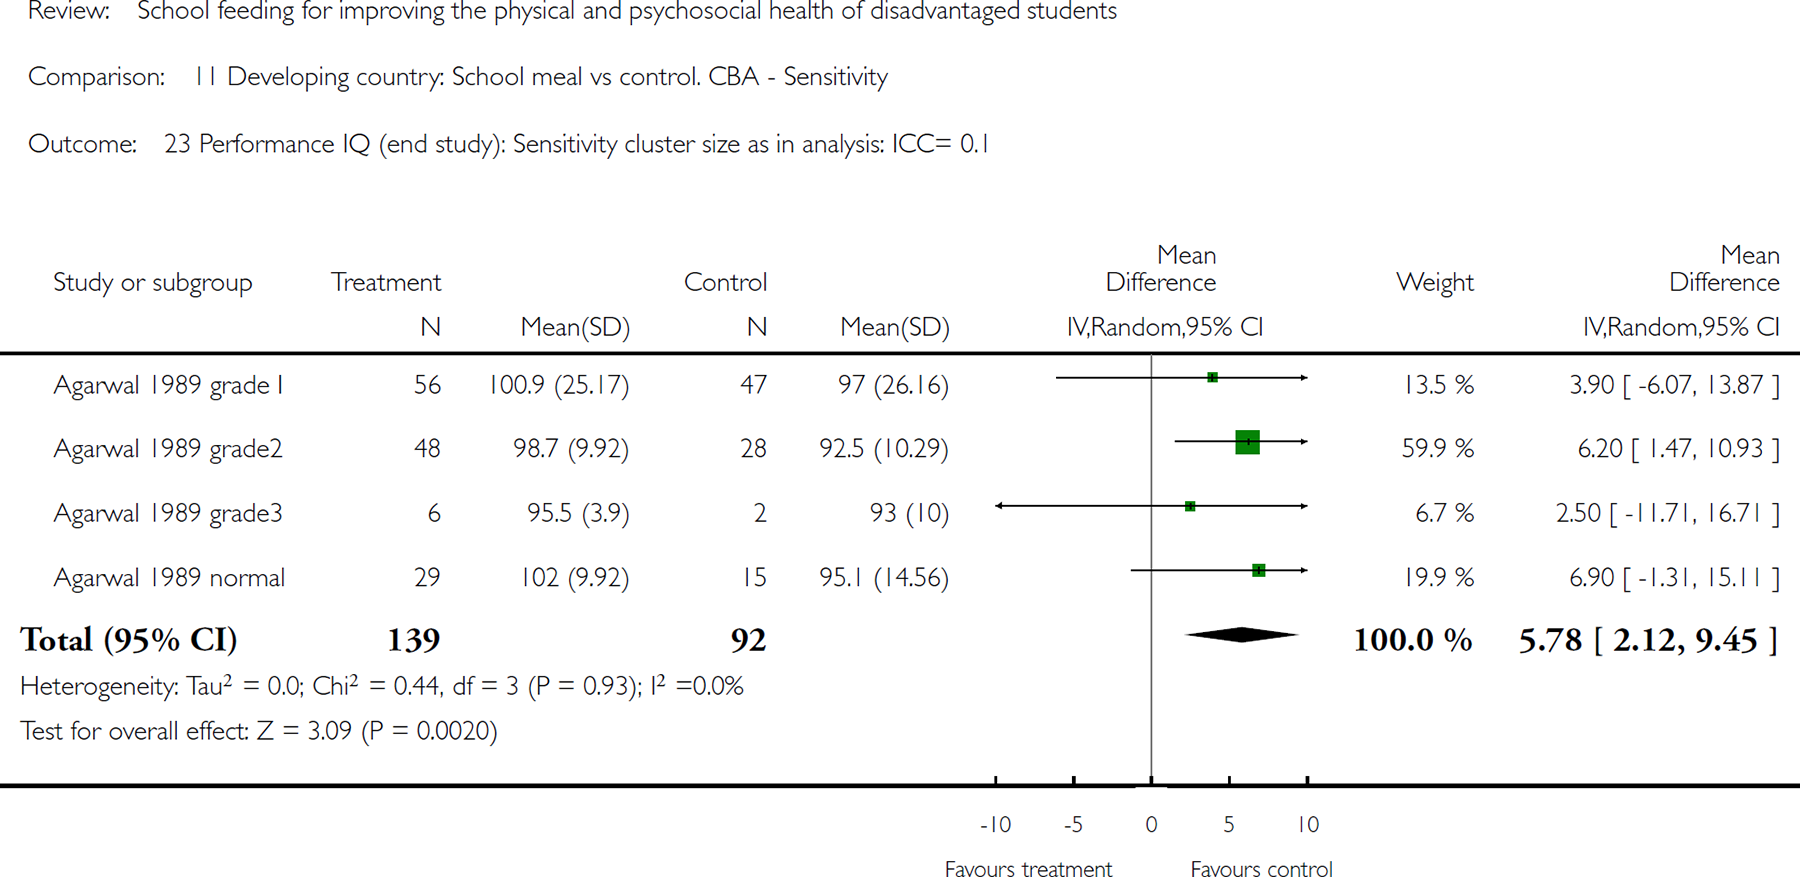
Comparison 11 Developing country: School meal vs control. CBA - Sensitivity, Outcome 23 Performance IQ (end study): Sensitivity cluster size as in analysis: ICC= 0.1.
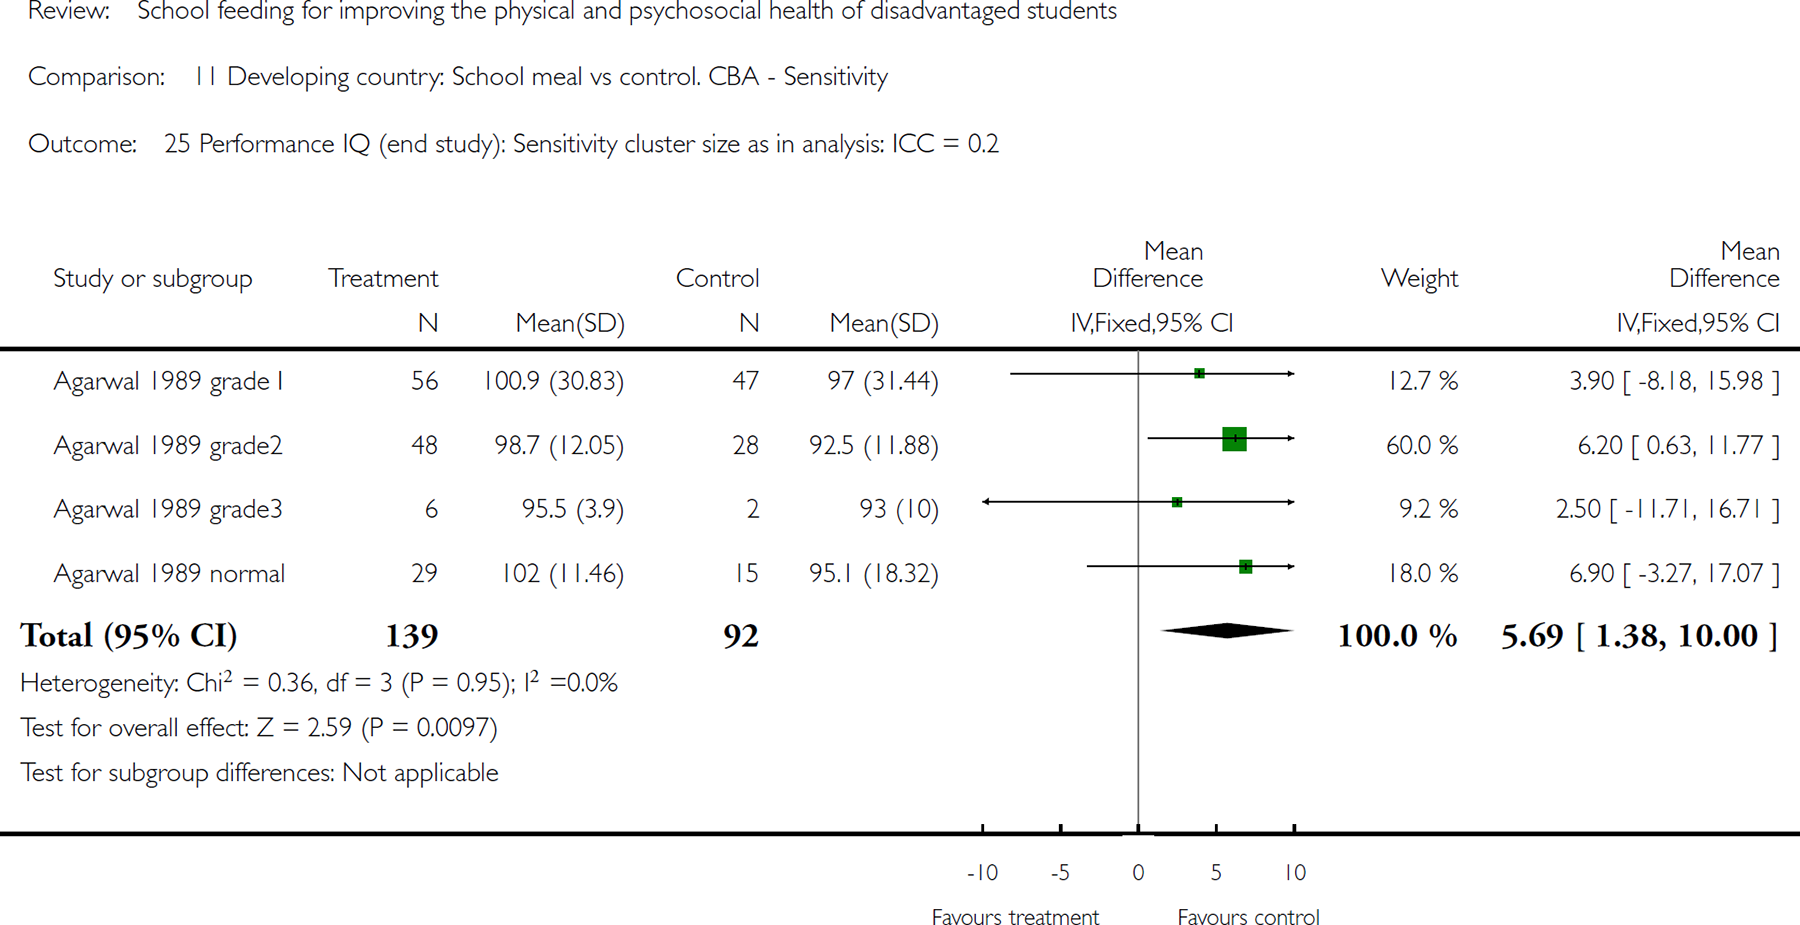
Comparison 11 Developing country: School meal vs control. CBA - Sensitivity, Outcome 25 Performance IQ (end study): Sensitivity cluster size as in analysis: ICC = 0.2.
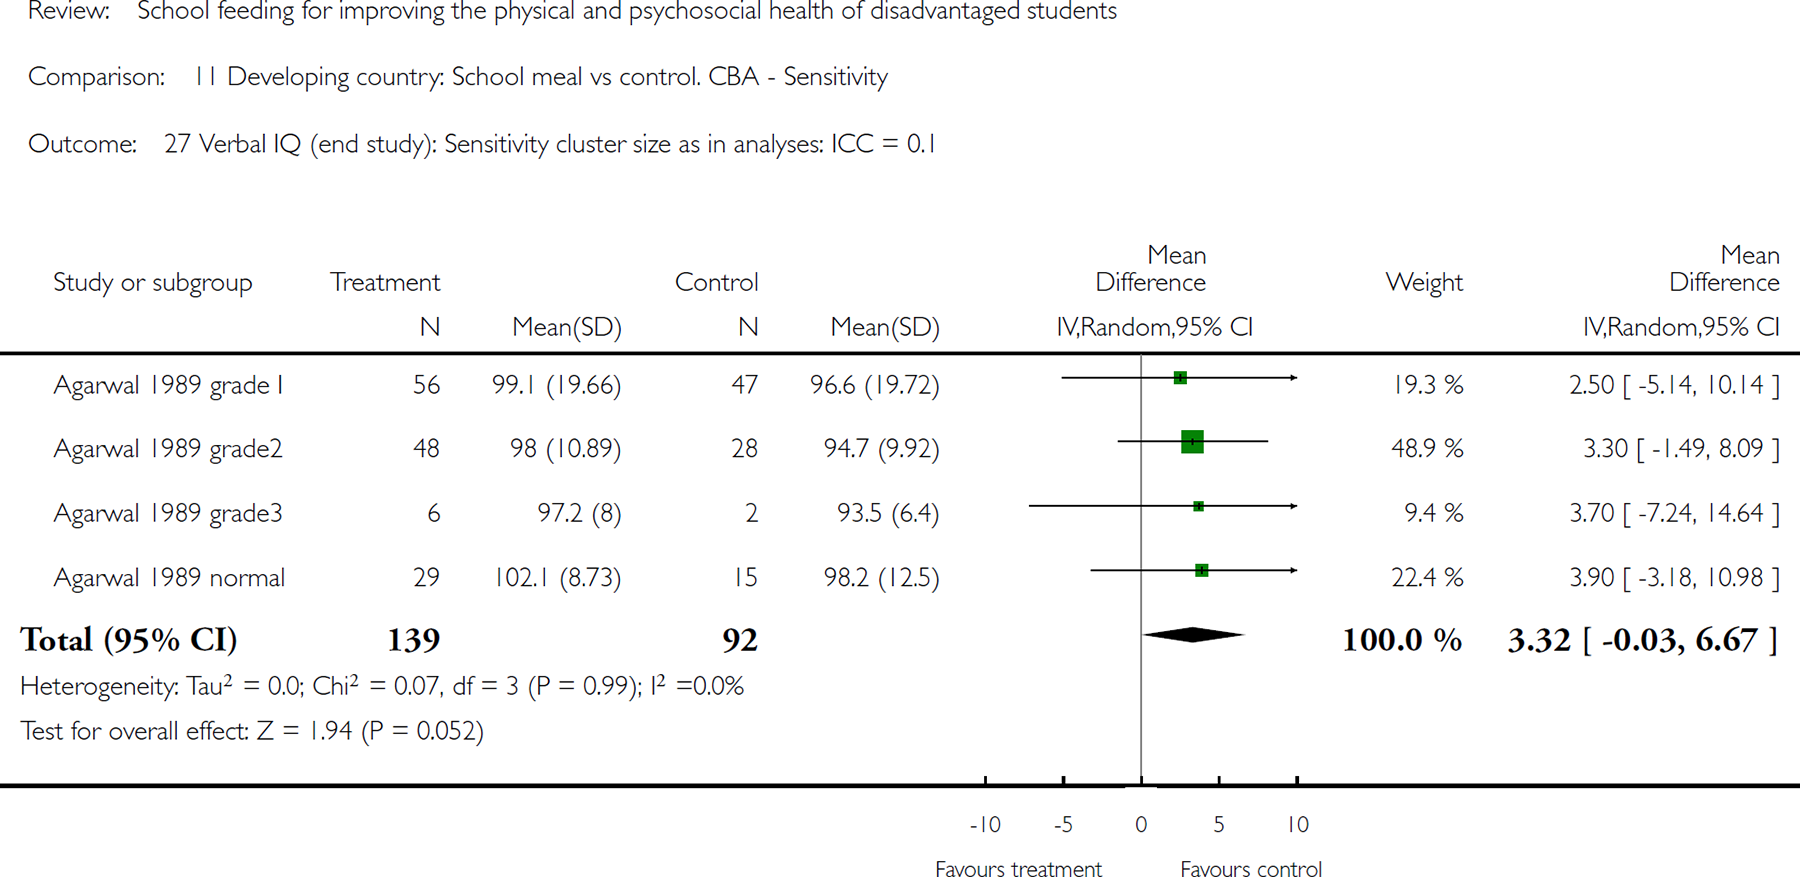
Comparison 11 Developing country: School meal vs control. CBA - Sensitivity, Outcome 27 Verbal IQ (end study): Sensitivity cluster size as in analyses: ICC = 0.1.
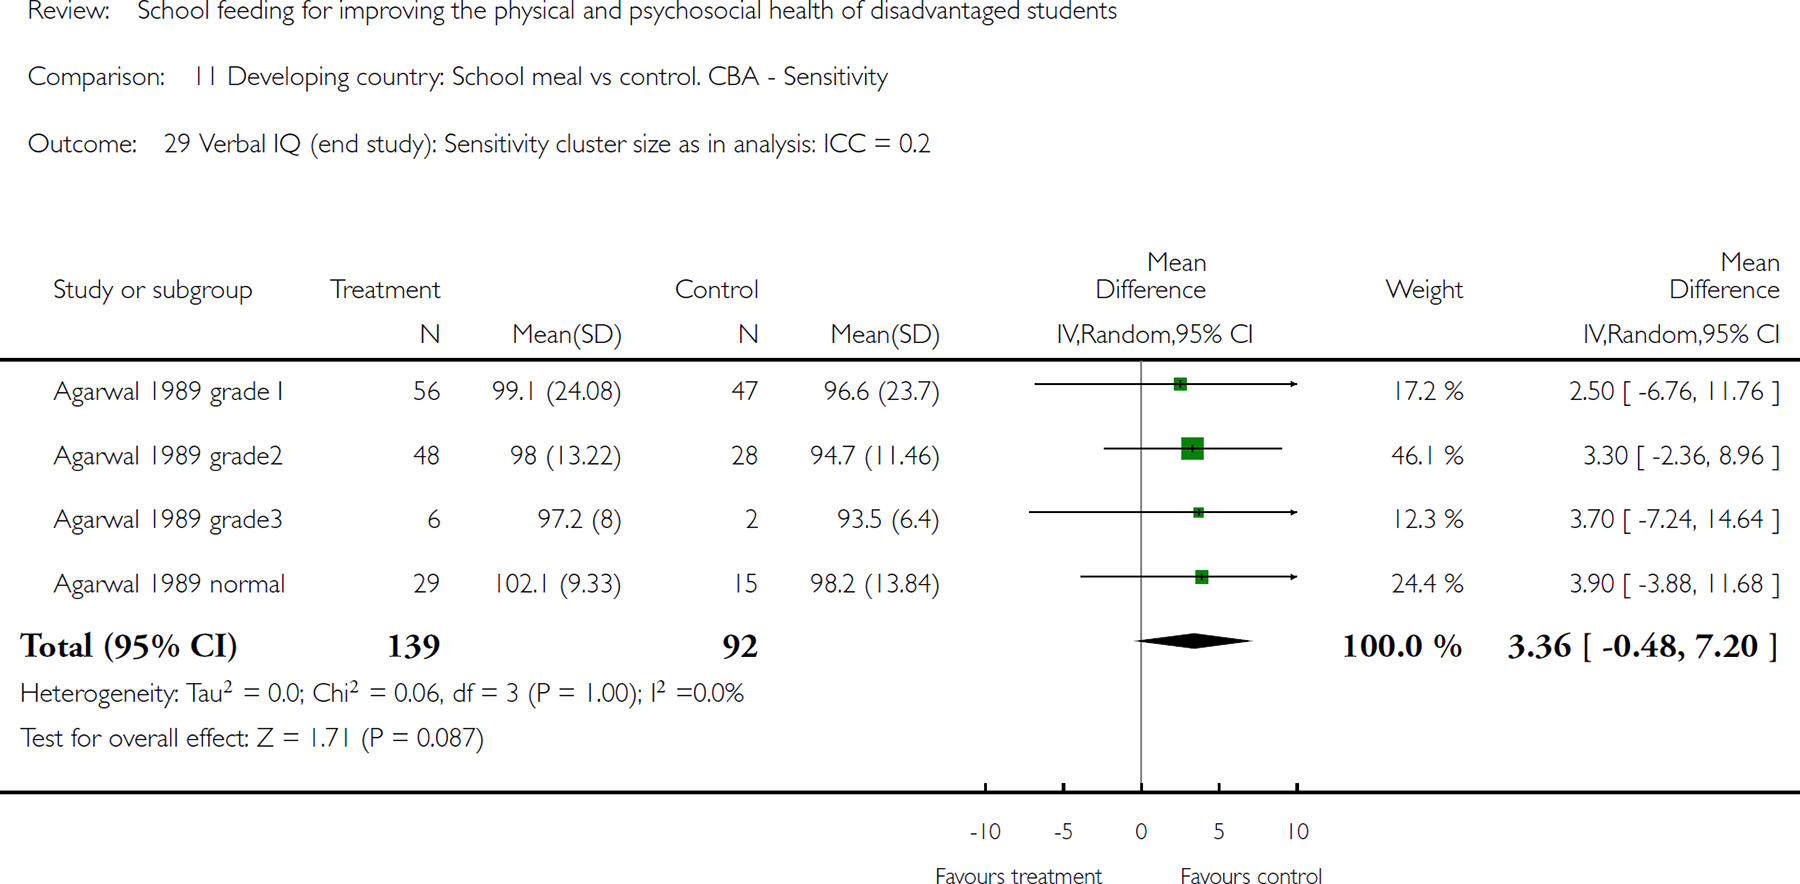
Comparison 11 Developing country: School meal vs control. CBA - Sensitivity, Outcome 29 Verbal IQ (end study): Sensitivity cluster size as in analysis: ICC = 0.2.

Comparison 11 Developing country: School meal vs control. CBA - Sensitivity, Outcome 30 Percentage standard weight. Sensitivity = 0.01.
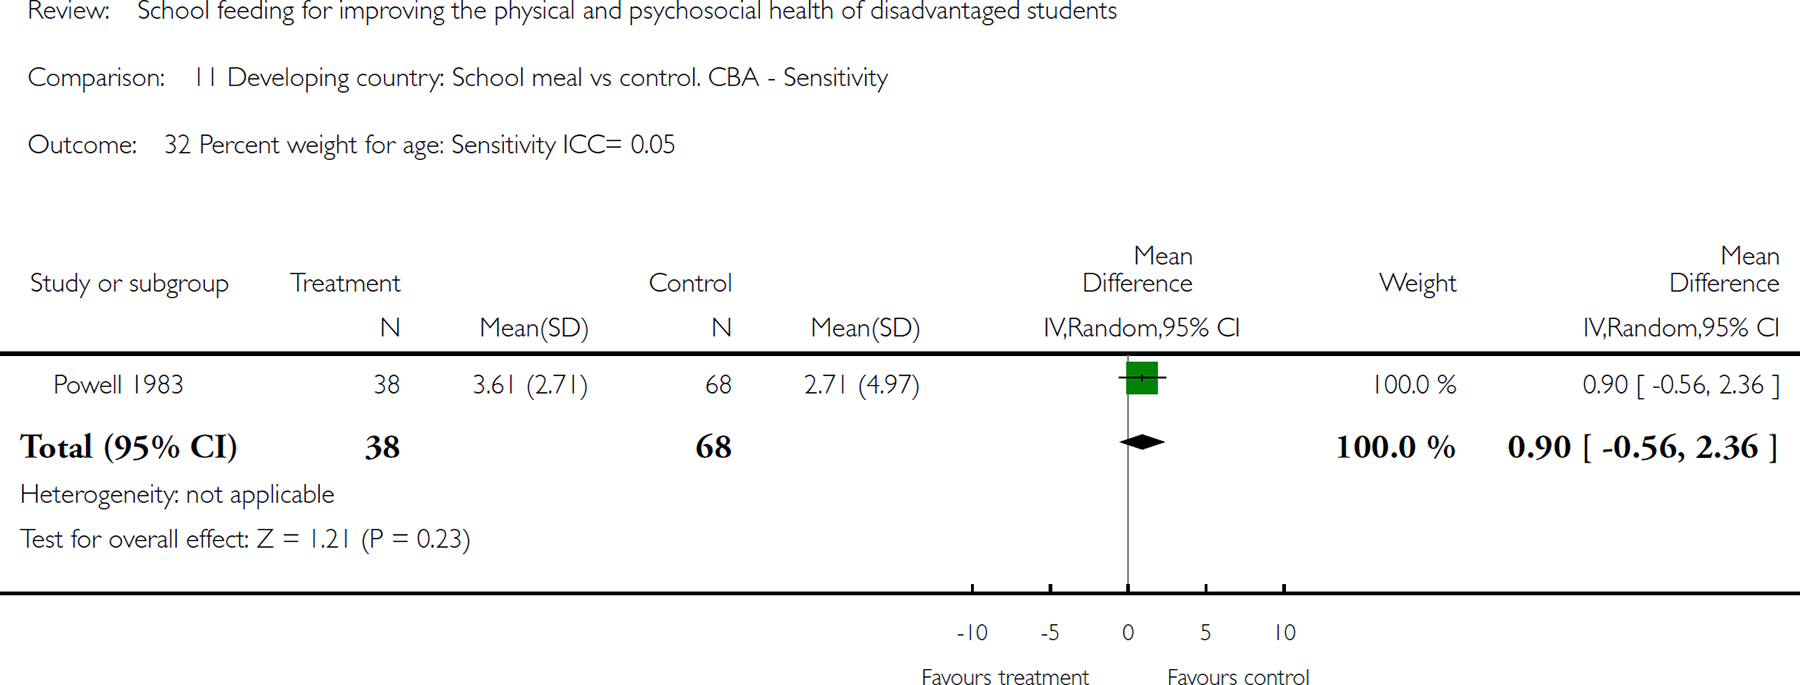
Comparison 11 Developing country: School meal vs control. CBA - Sensitivity, Outcome 32 Percent weight for age: Sensitivity ICC= 0.05.
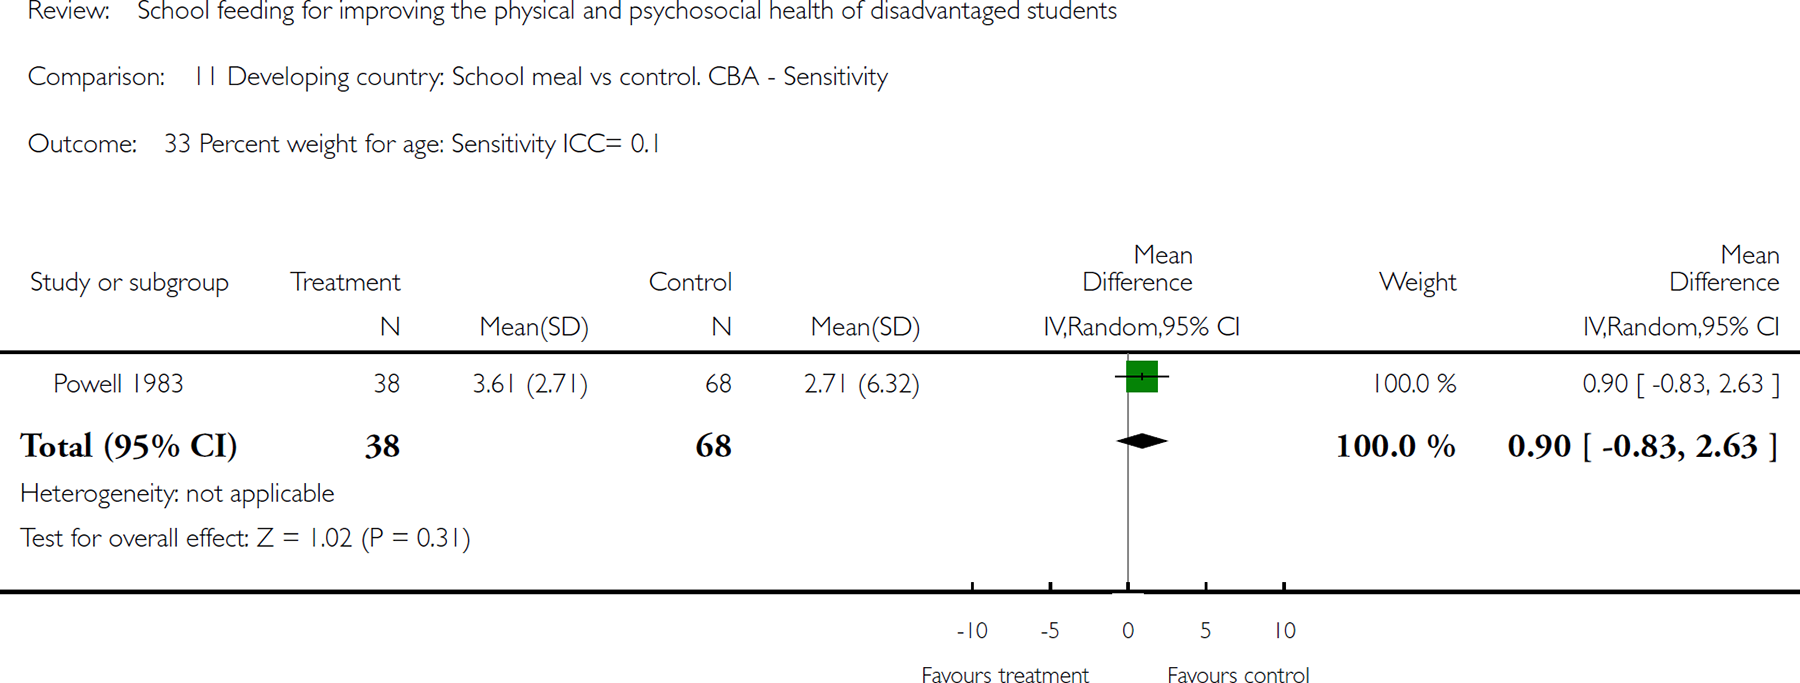
Comparison 11 Developing country: School meal vs control. CBA - Sensitivity, Outcome 33 Percent weight for age: Sensitivity ICC= 0.1.
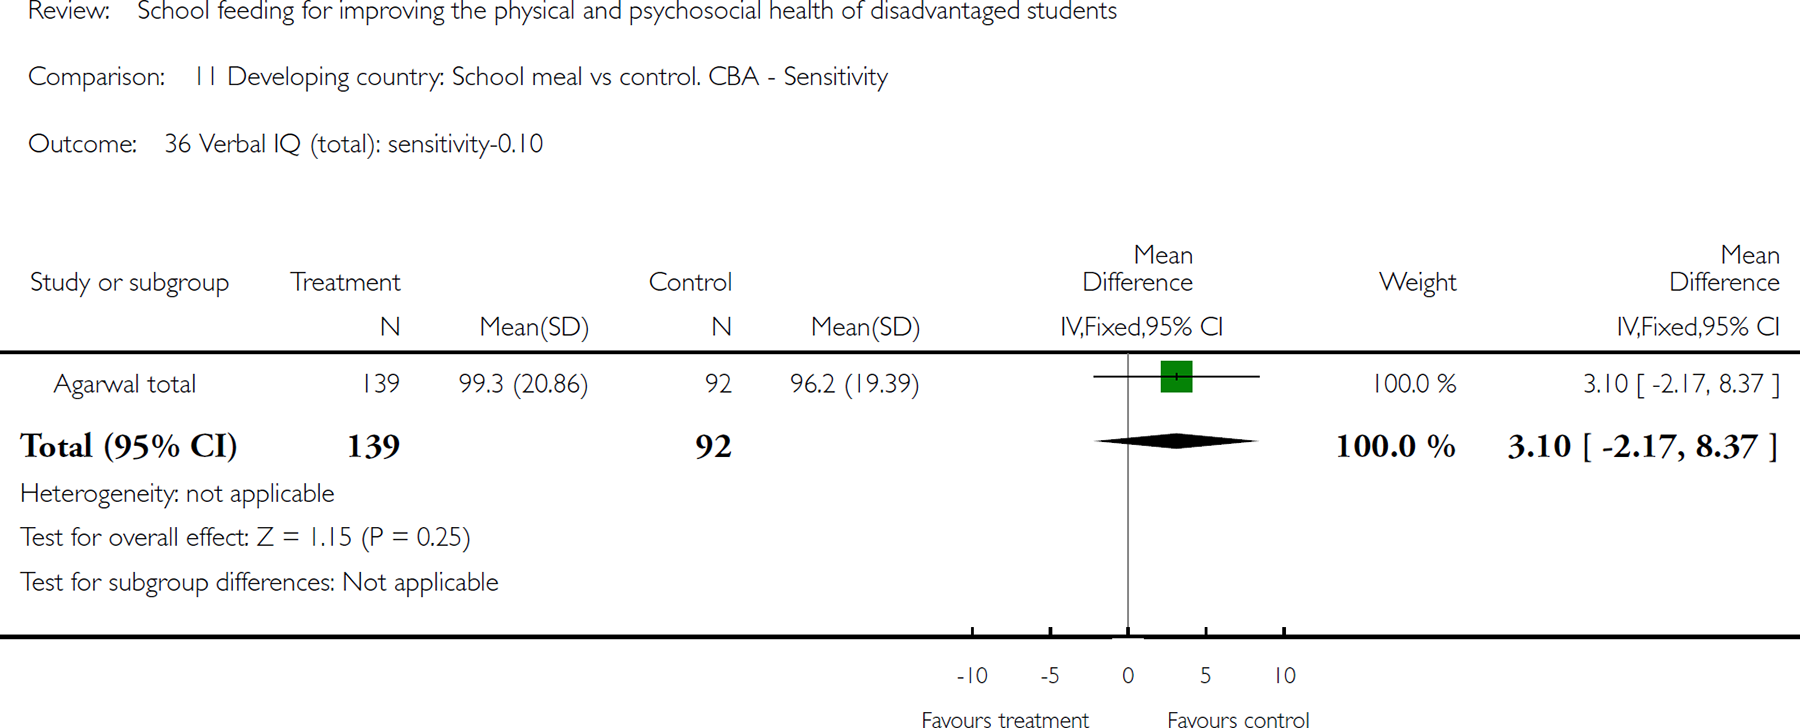
Comparison 11 Developing country: School meal vs control. CBA - Sensitivity, Outcome 36 Verbal IQ (total): sensitivity-0.10.
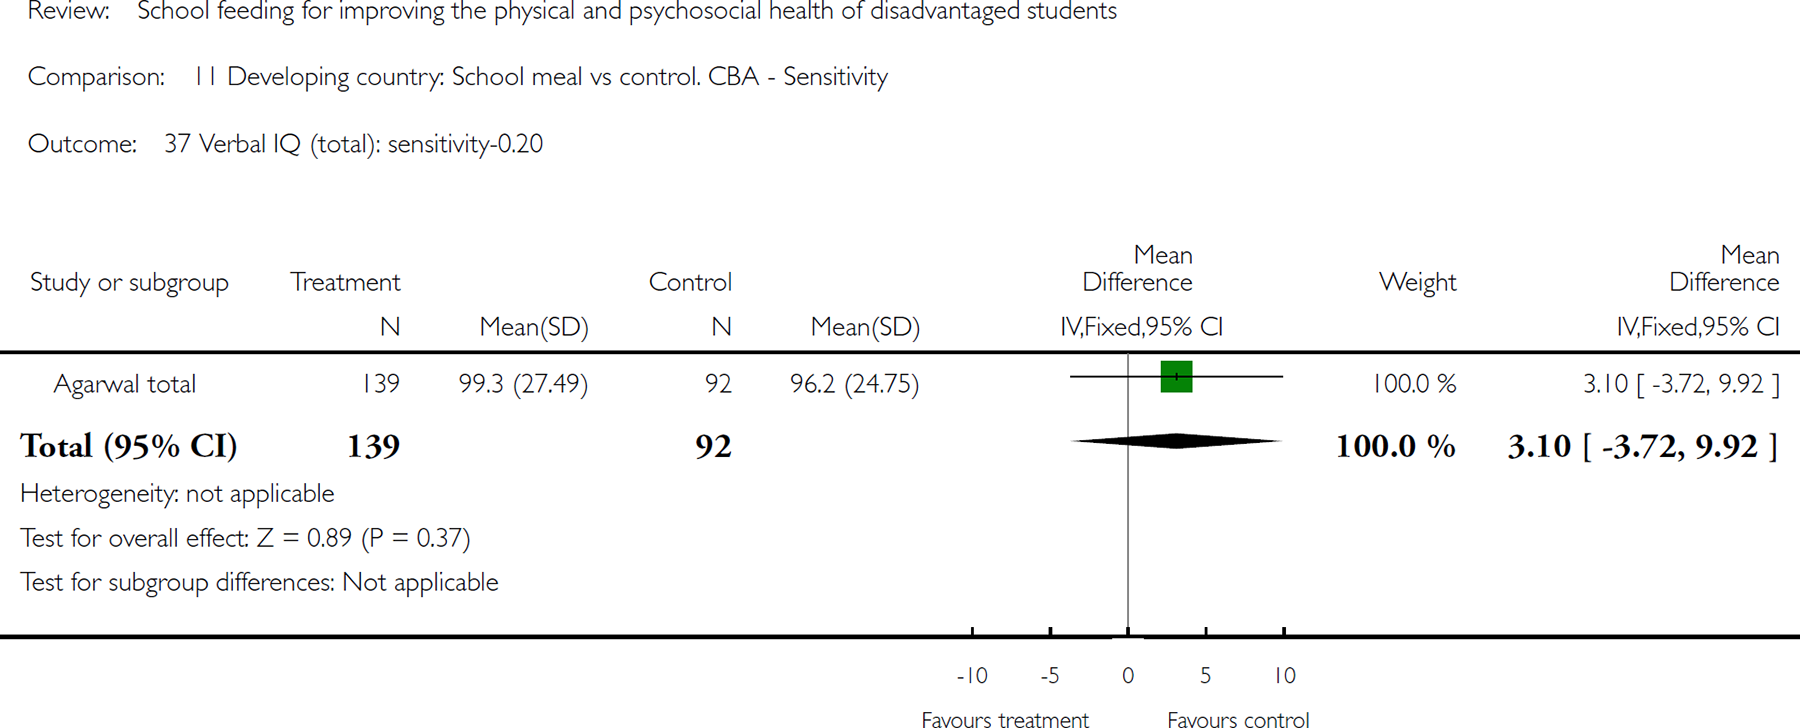
Comparison 11 Developing country: School meal vs control. CBA - Sensitivity, Outcome 37 Verbal IQ (total): sensitivity-0.20.
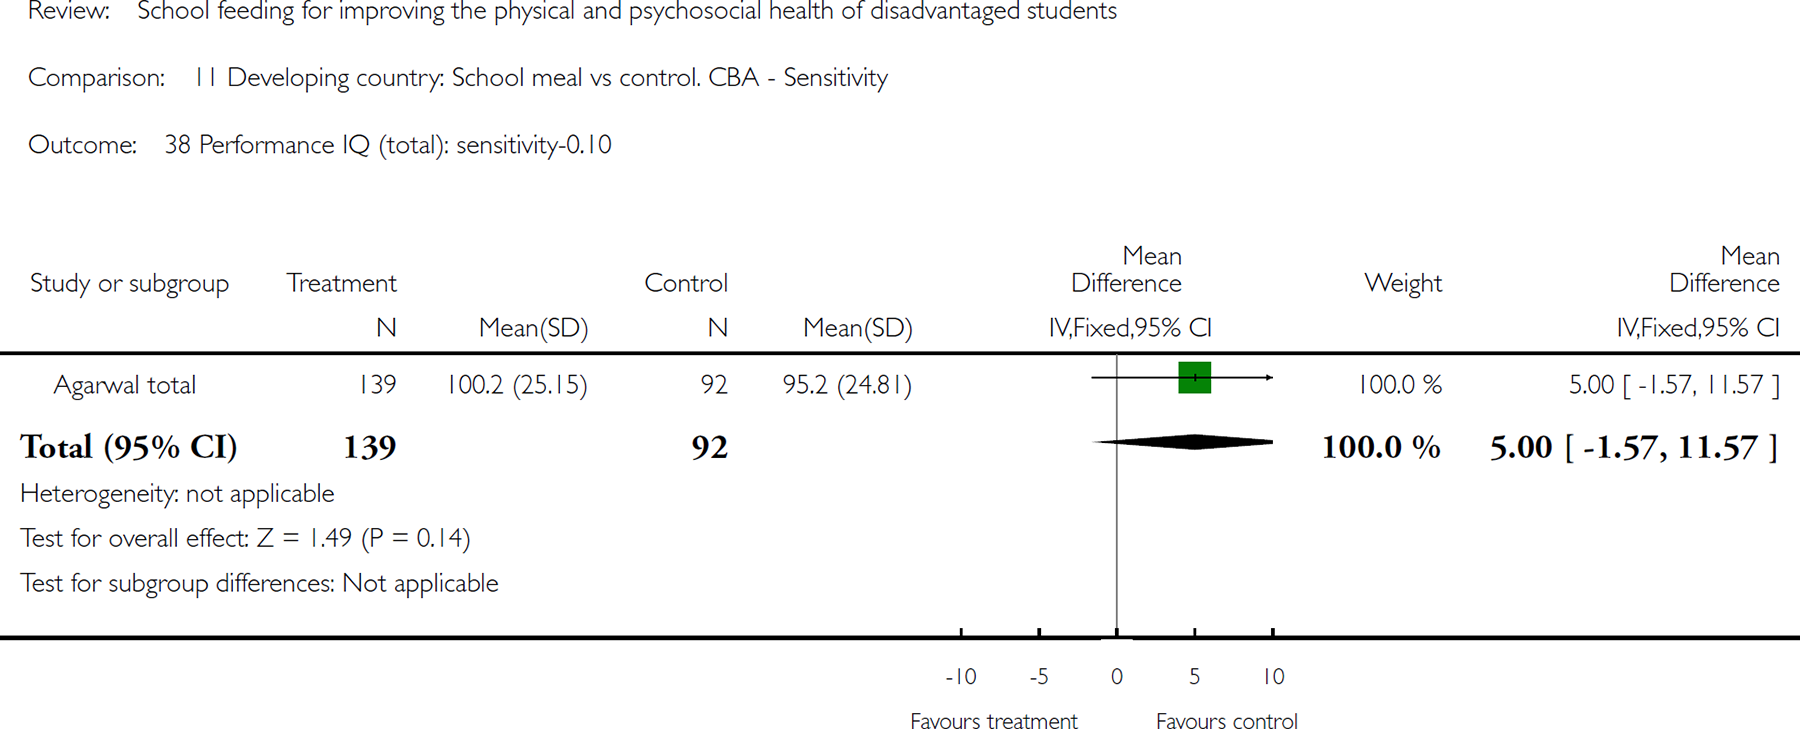
Comparison 11 Developing country: School meal vs control. CBA - Sensitivity, Outcome 38 Performance IQ (total): sensitivity-0.10.

Comparison 11 Developing country: School meal vs control. CBA - Sensitivity, Outcome 39 Percentage standard height. Sensitivity = .01.
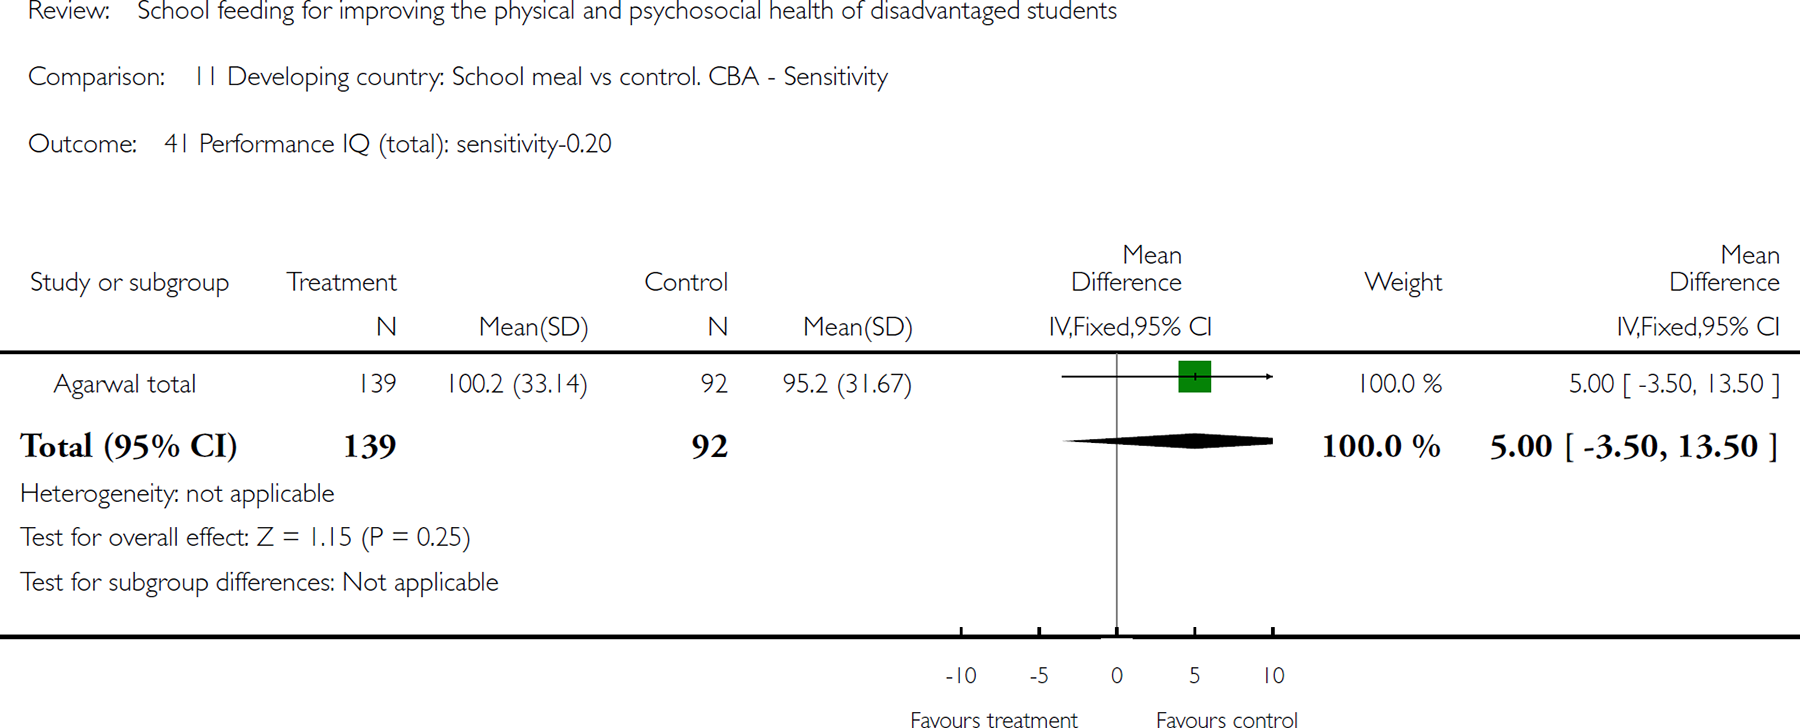
Comparison 11 Developing country: School meal vs control. CBA - Sensitivity, Outcome 41 Performance IQ (total): sensitivity-0.20.
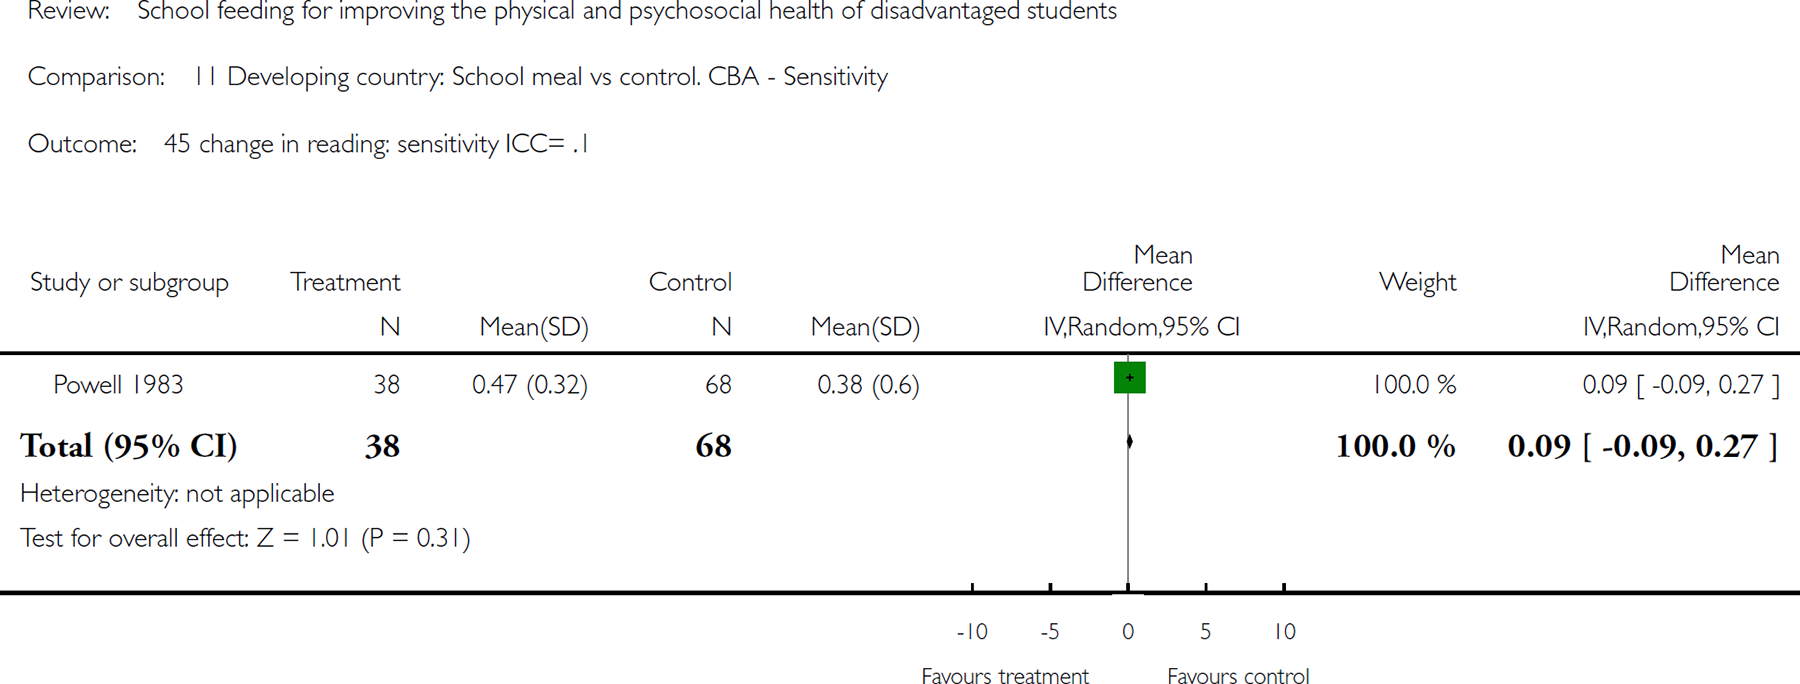
Comparison 11 Developing country: School meal vs control. CBA - Sensitivity, Outcome 45 change in reading: sensitivity ICC= .1.
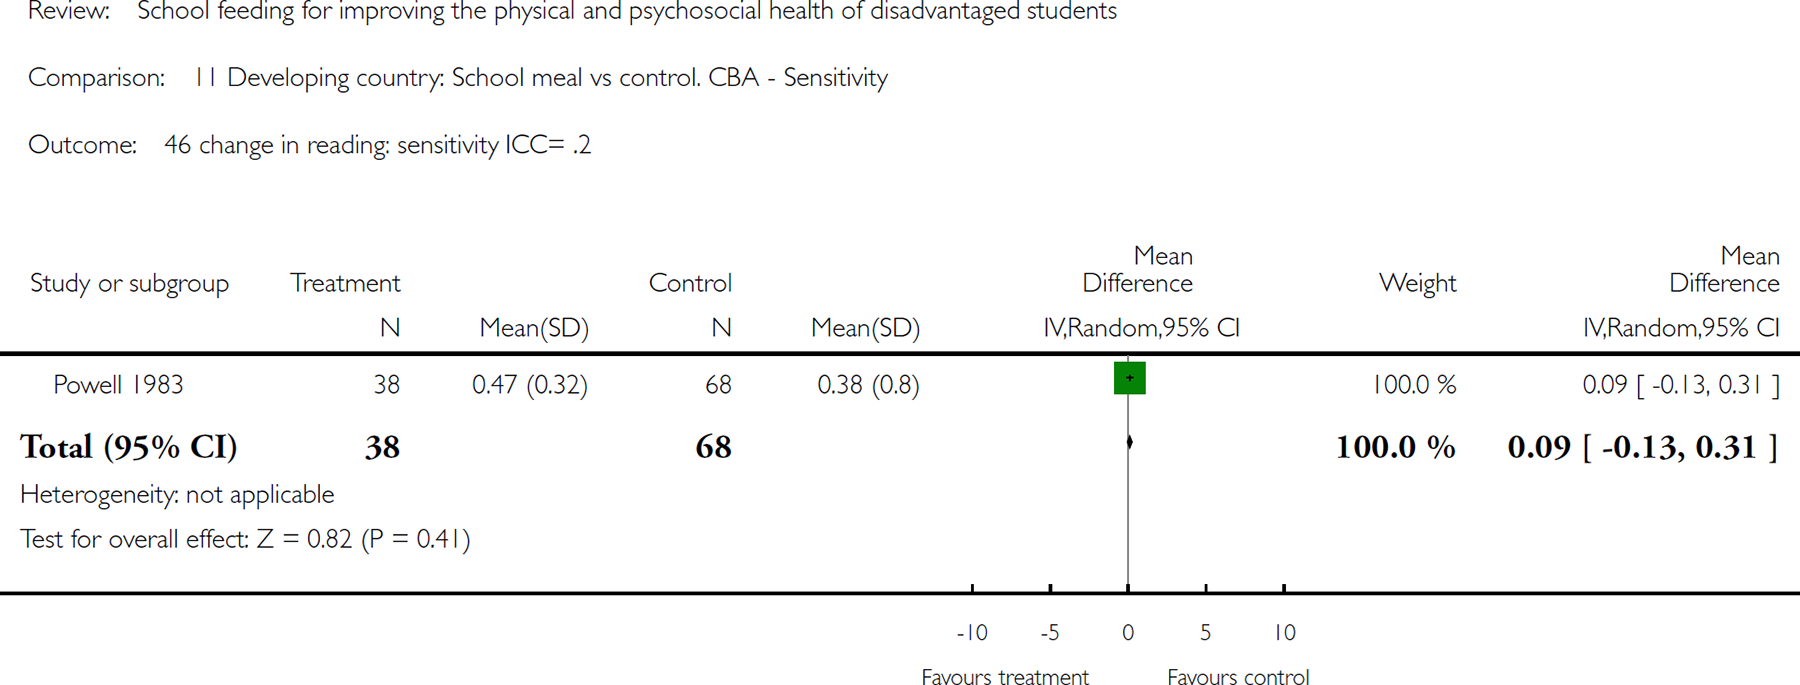
Comparison 11 Developing country: School meal vs control. CBA - Sensitivity, Outcome 46 change in reading: sensitivity ICC= .2.
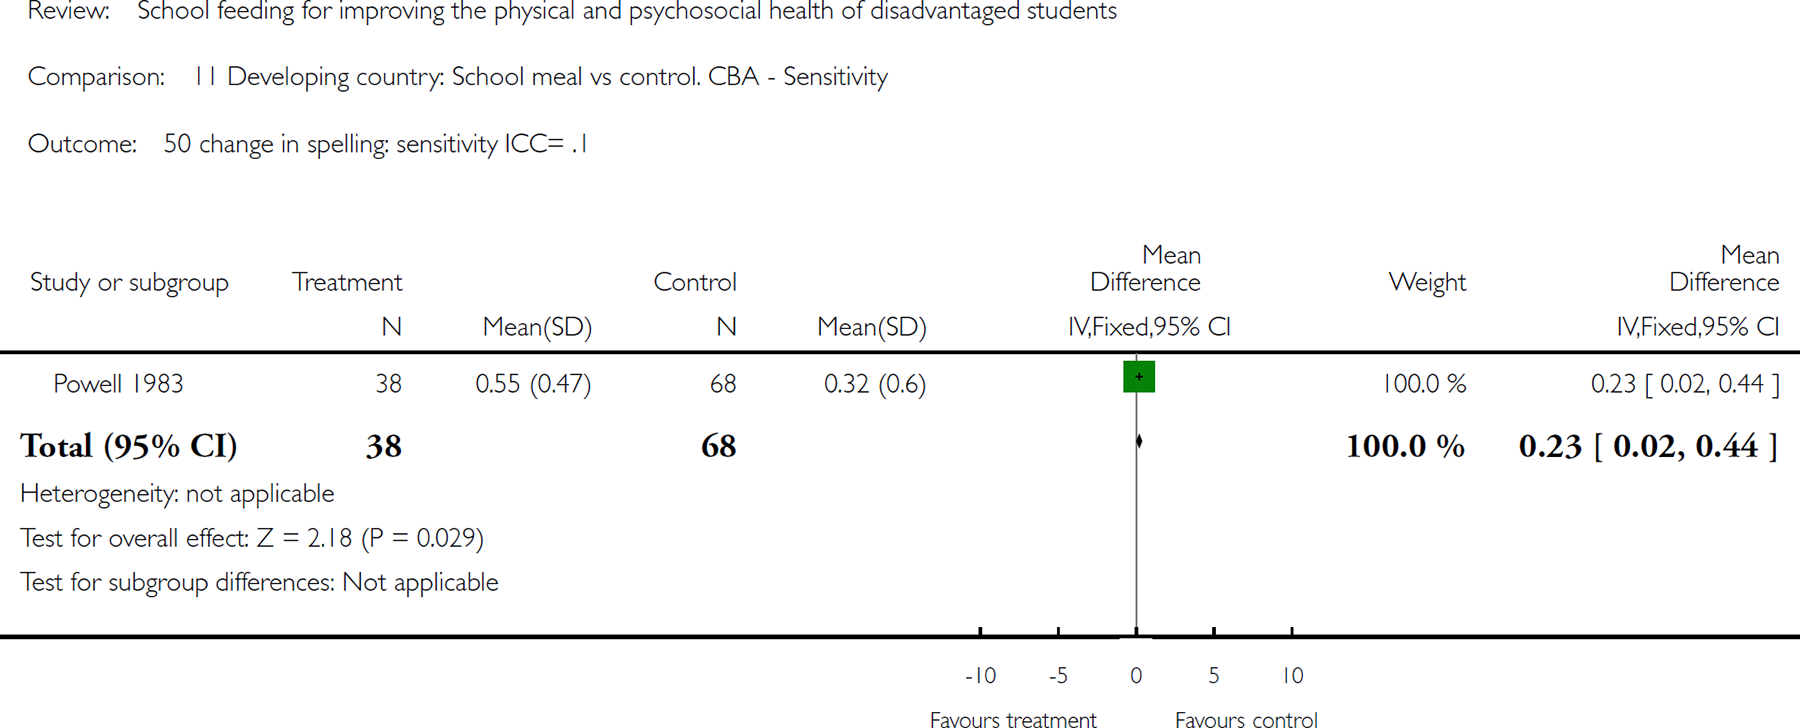
Comparison 11 Developing country: School meal vs control. CBA - Sensitivity, Outcome 50 change in spelling: sensitivity ICC= .1.
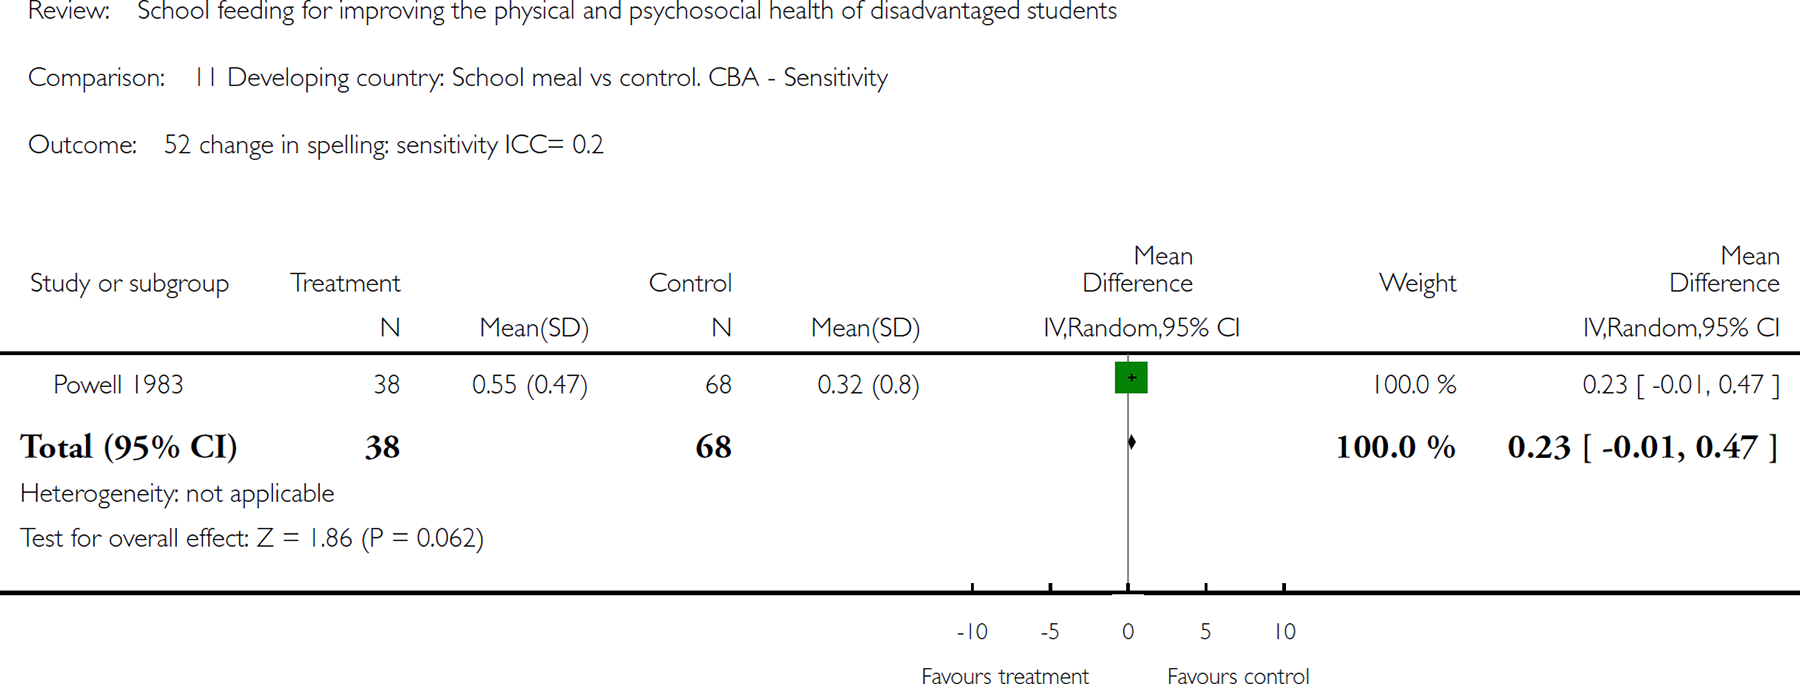
Comparison 11 Developing country: School meal vs control. CBA - Sensitivity, Outcome 52 change in spelling: sensitivity ICC= 0.2.
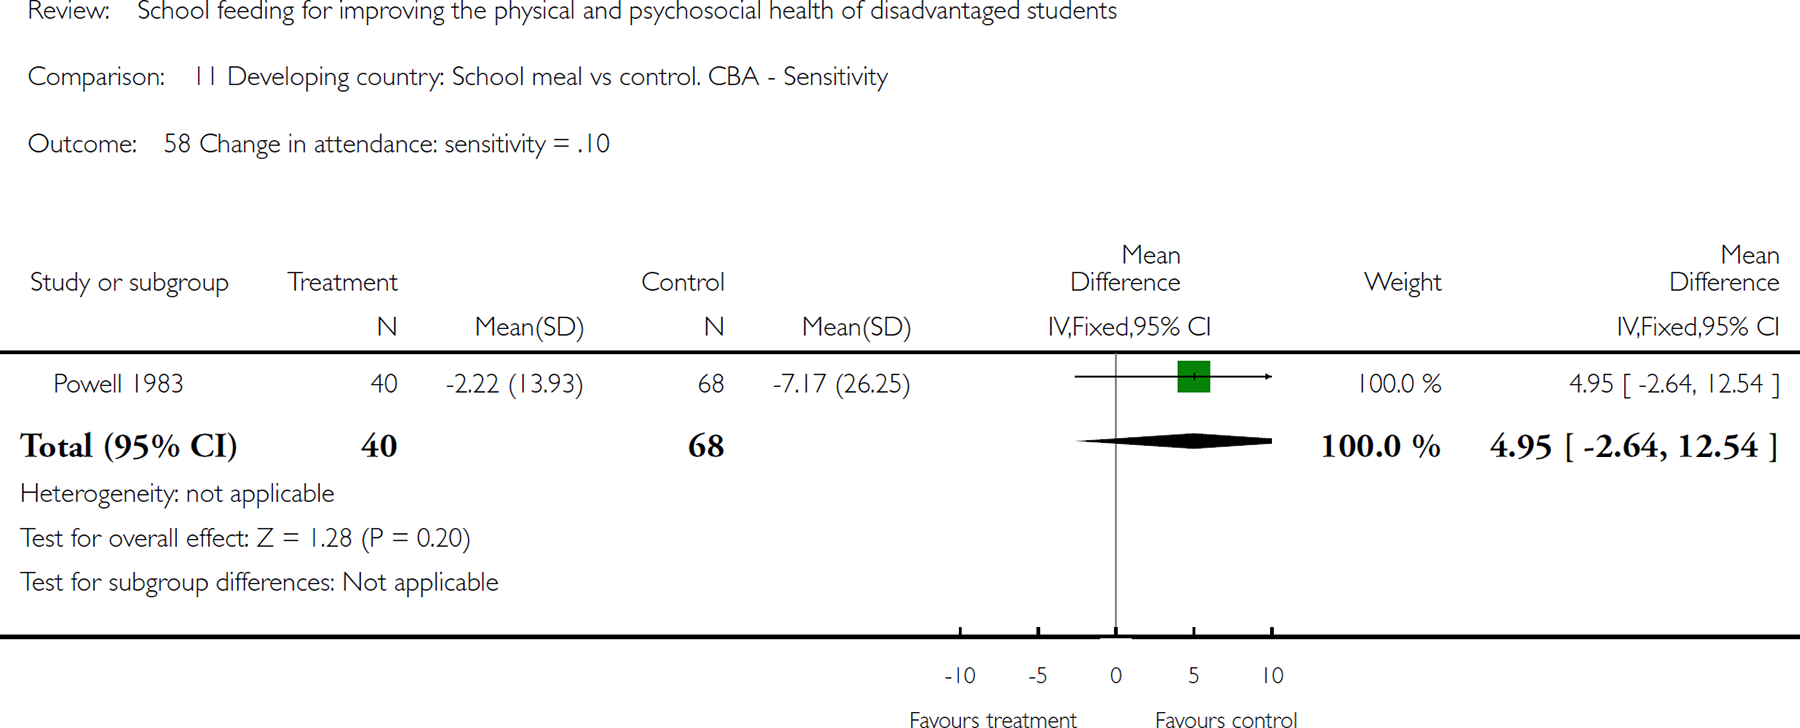
Comparison 11 Developing country: School meal vs control. CBA - Sensitivity, Outcome 58 Change in attendance: sensitivity = .10.
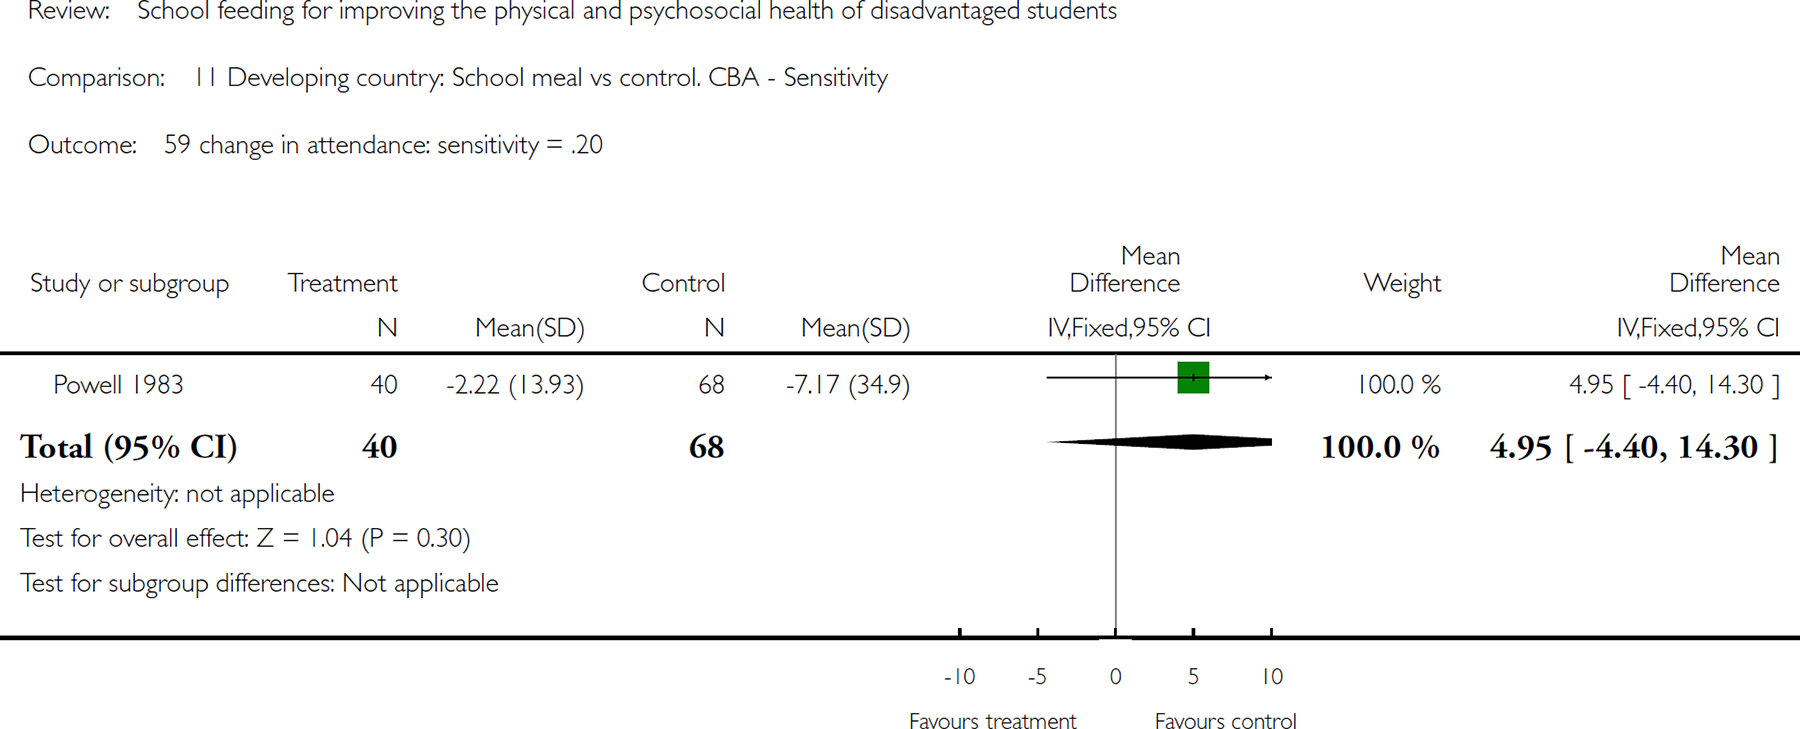
Comparison 11 Developing country: School meal vs control. CBA - Sensitivity, Outcome 59 change in attendance: sensitivity = .20.

Comparison 11 Developing country: School meal vs control. CBA - Sensitivity, Outcome 60 End of study attendance: sensitivity icc = .10.
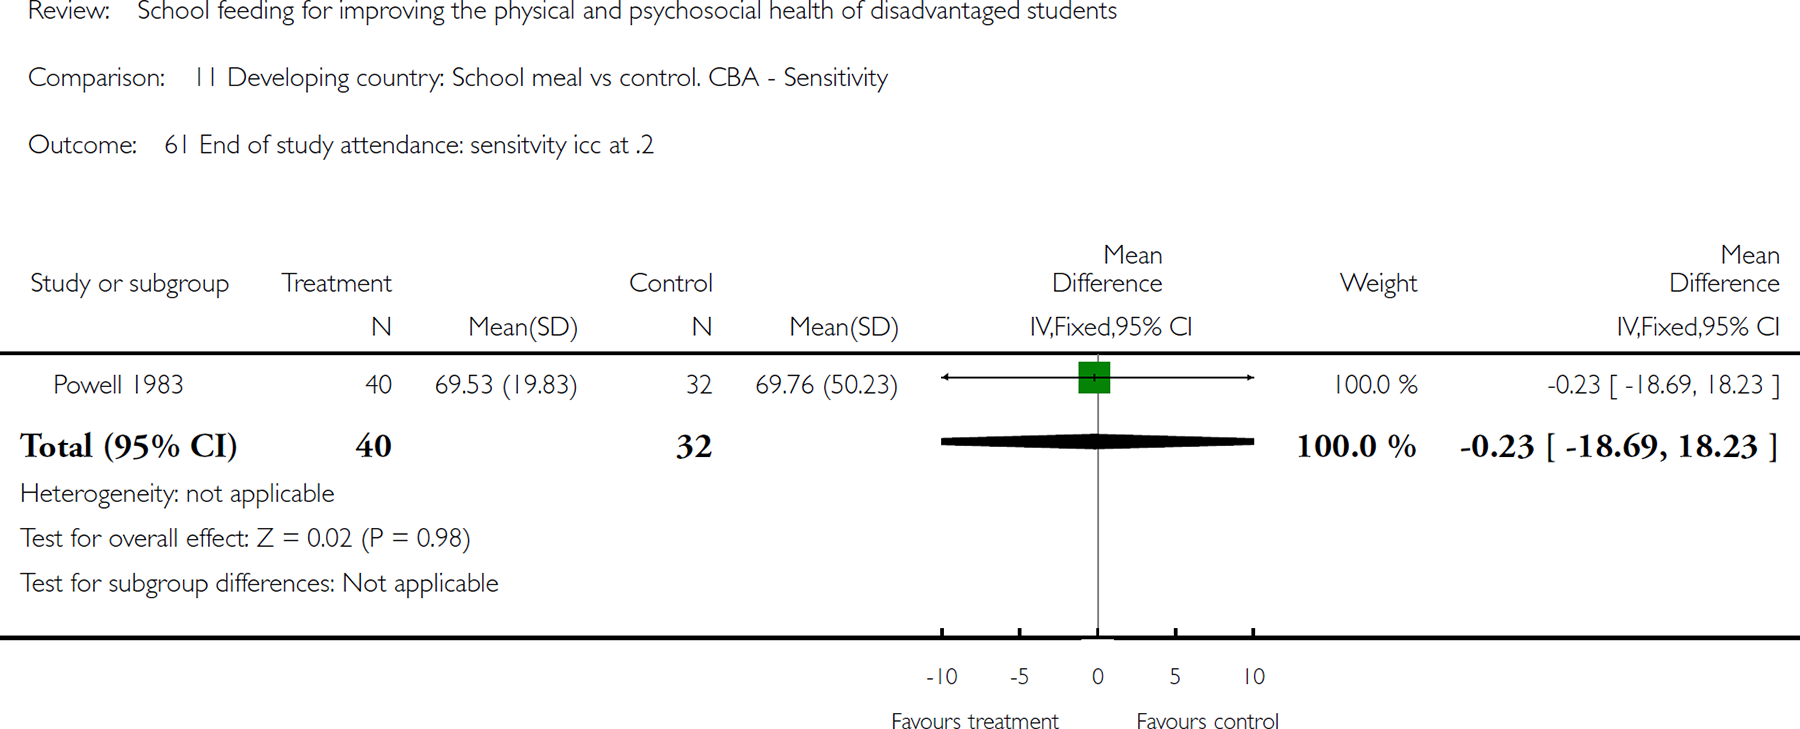
Comparison 11 Developing country: School meal vs control. CBA - Sensitivity, Outcome 61 End of study attendance: sensitvity icc at .2.
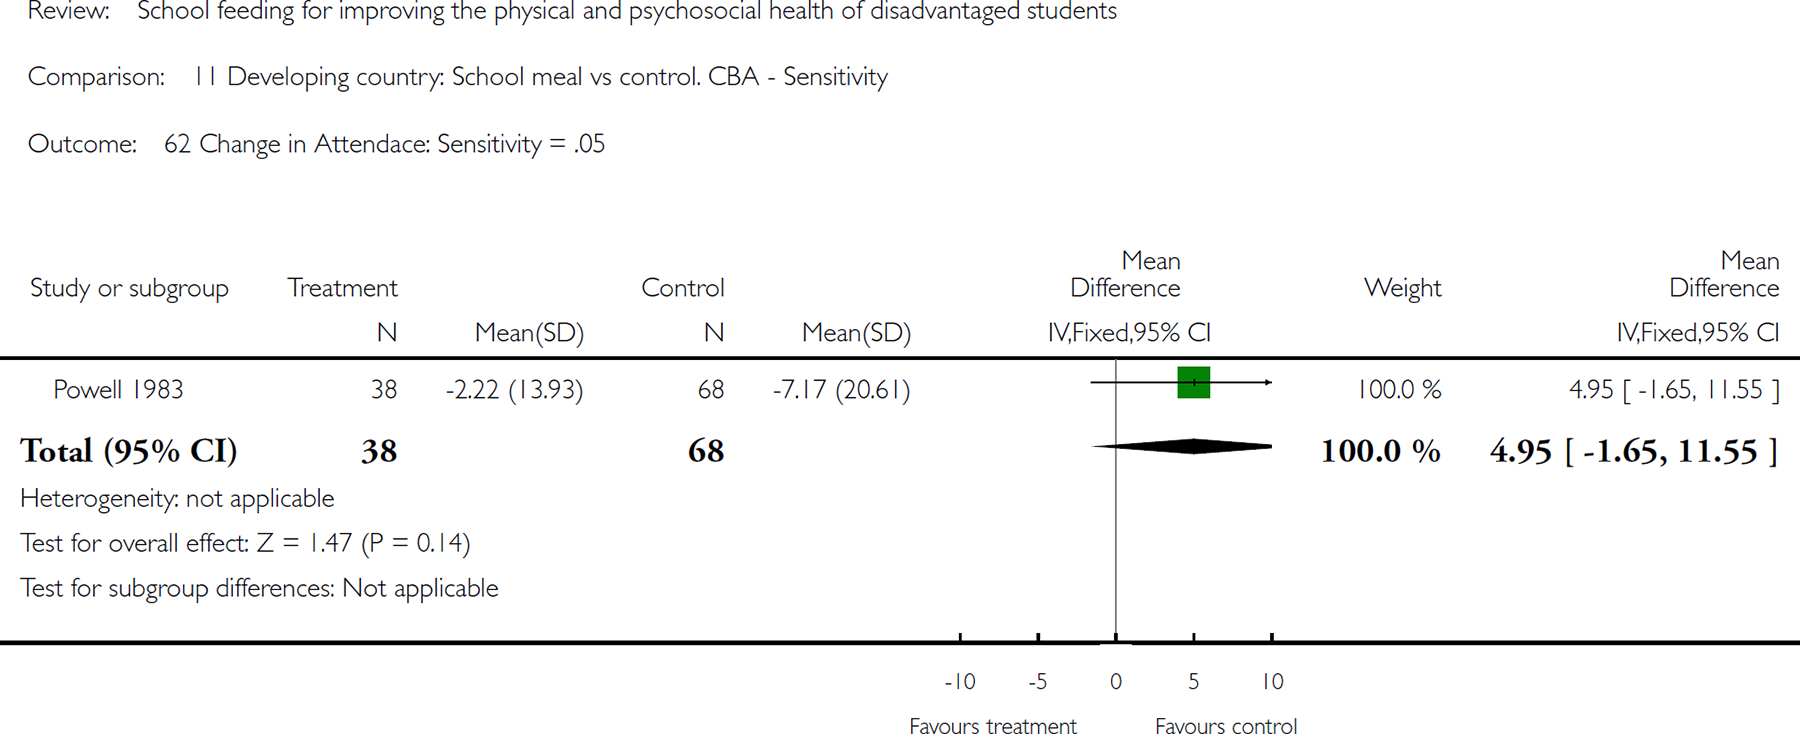
Comparison 11 Developing country: School meal vs control. CBA - Sensitivity, Outcome 62 Change in Attendace: Sensitivity = .05.
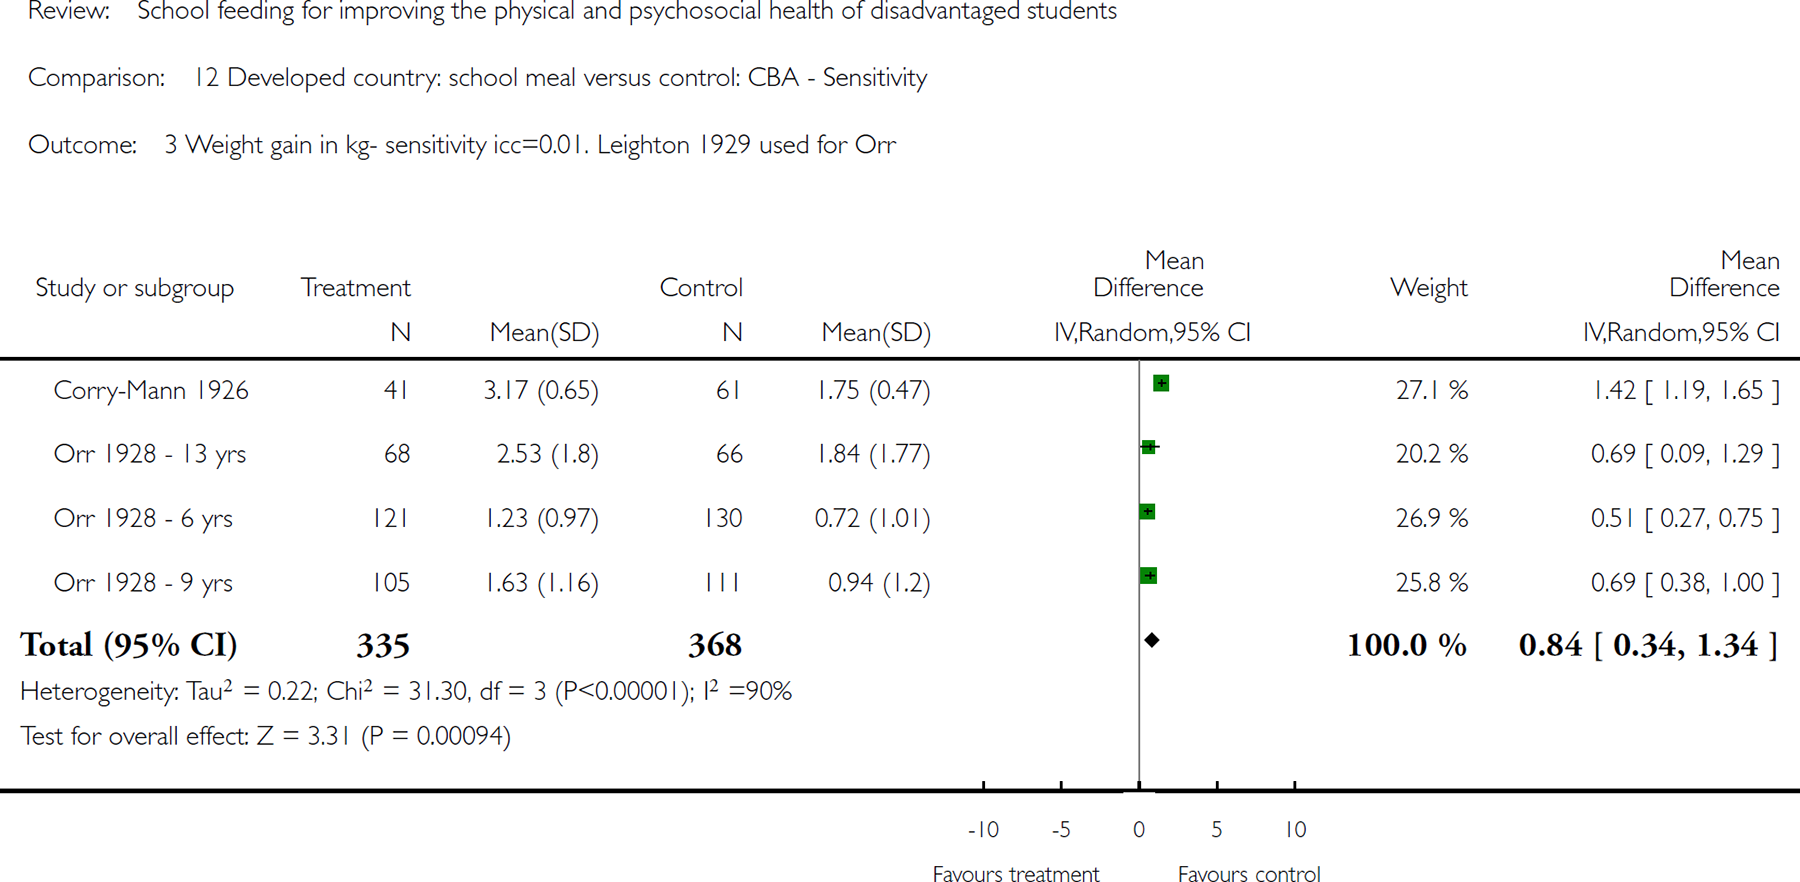
Comparison 12 Developed country: school meal versus control: CBA - Sensitivity, Outcome 3 Weight gain in kg- sensitivity icc=0.01. Leighton 1929 used for Orr.
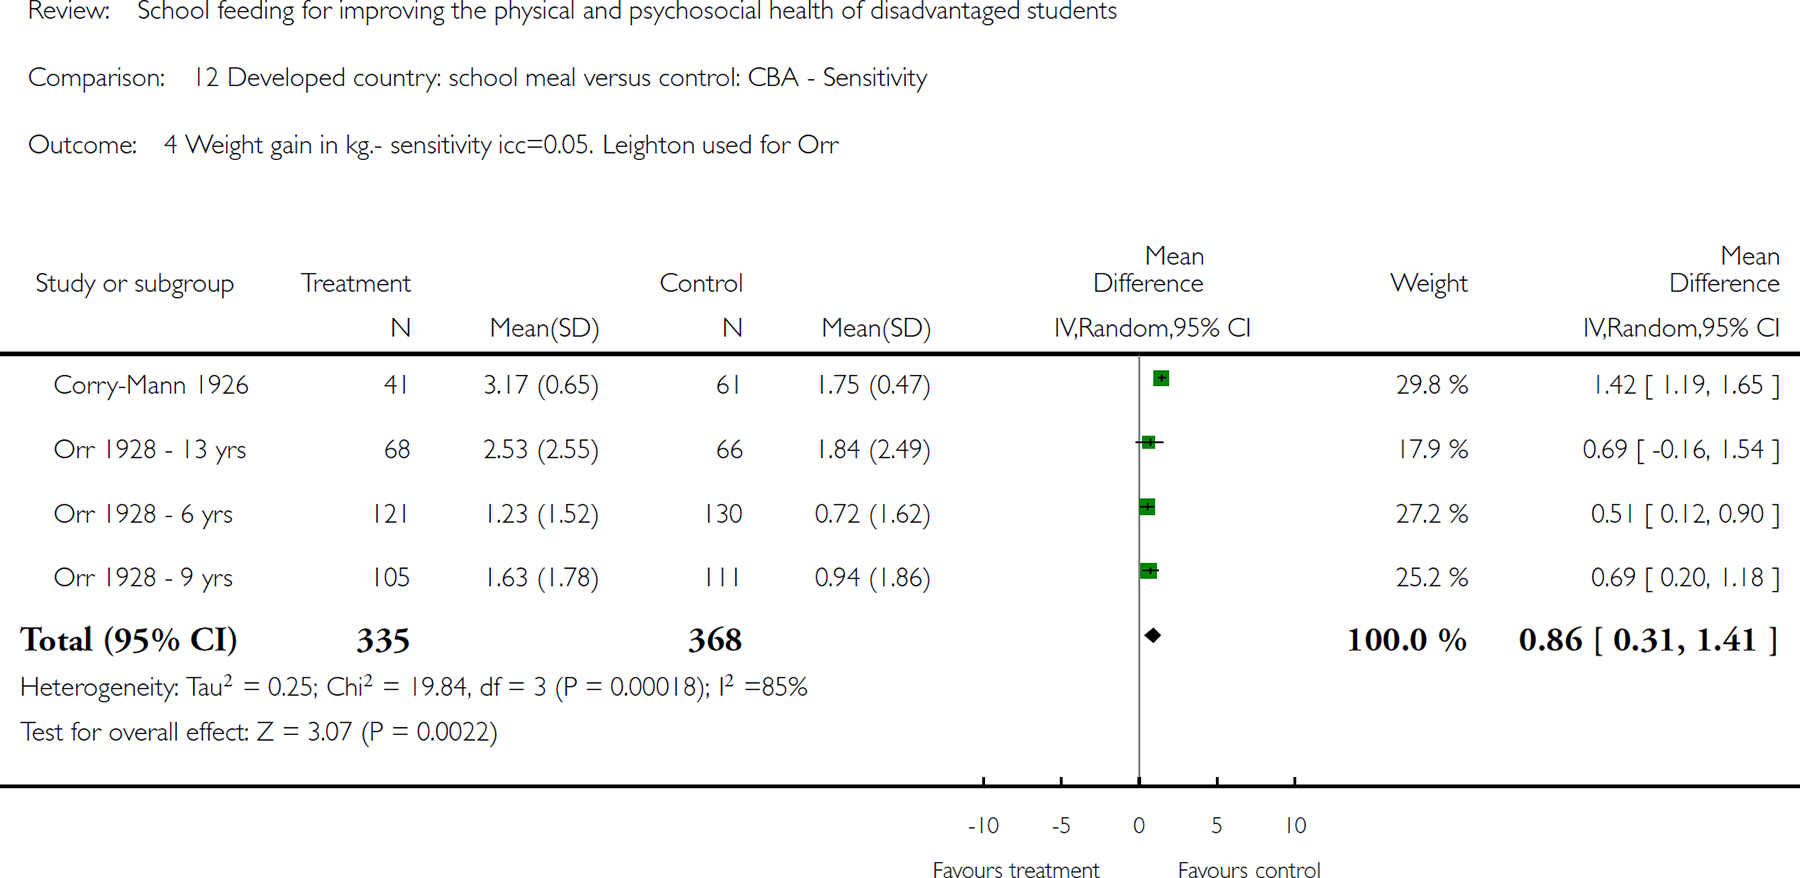
Comparison 12 Developed country: school meal versus control: CBA - Sensitivity, Outcome 4 Weight gain in kg.- sensitivity icc=0.05. Leighton used for Orr.
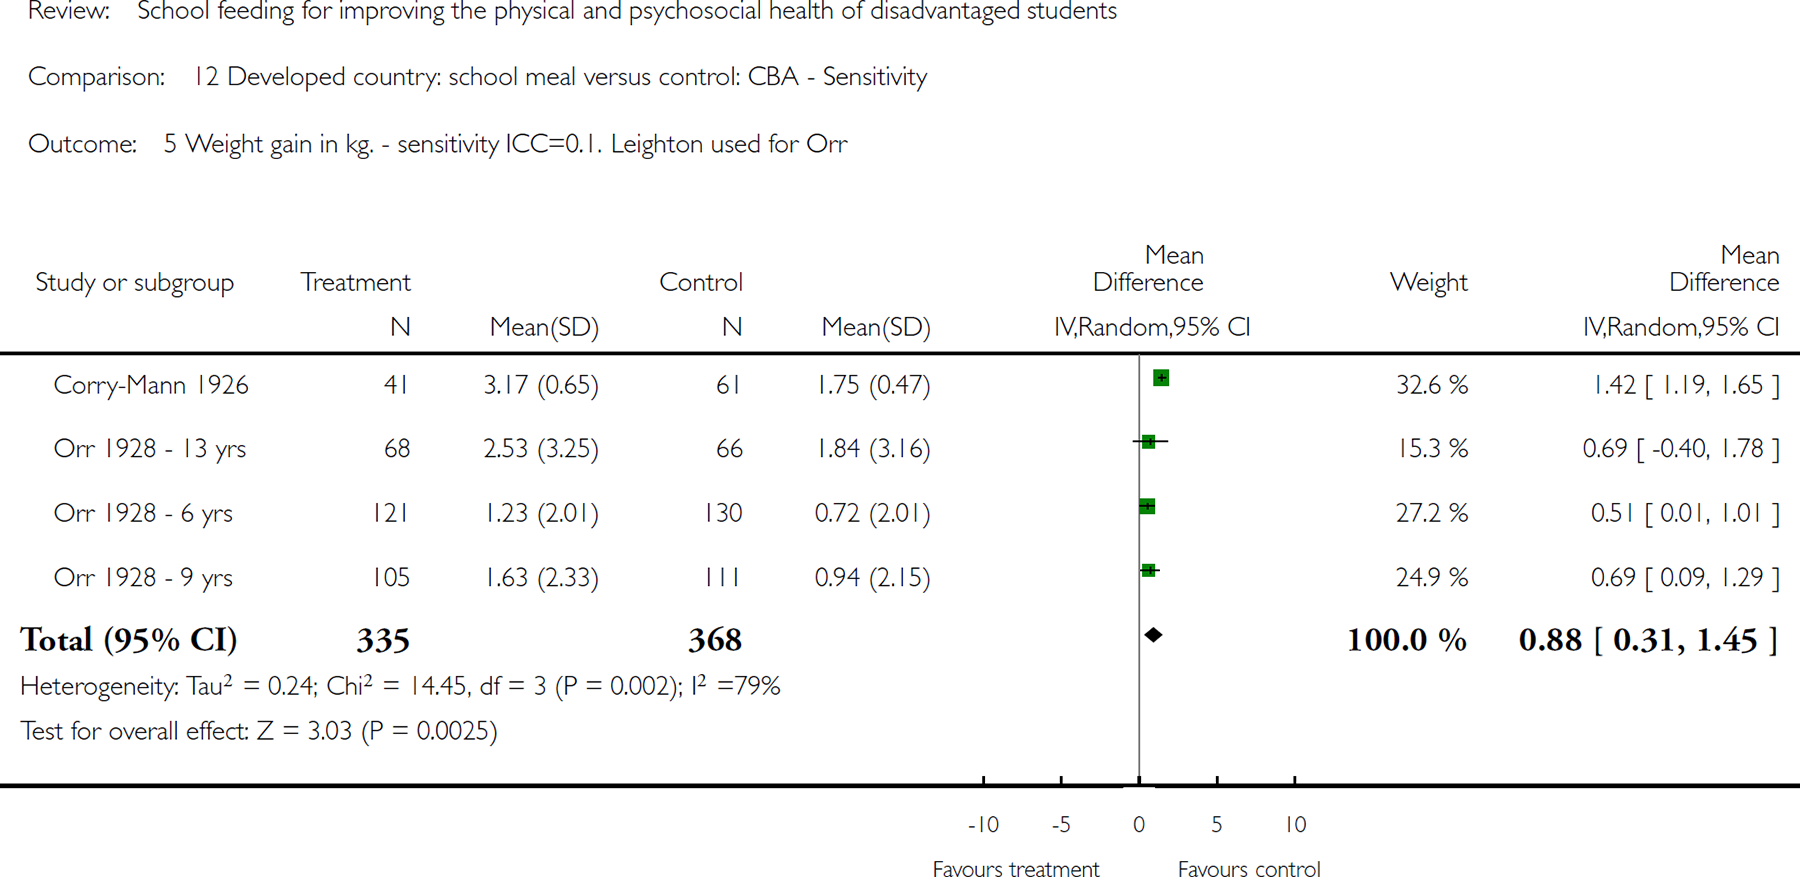
Comparison 12 Developed country: school meal versus control: CBA - Sensitivity, Outcome 5 Weight gain in kg. - sensitivity ICC=0.1. Leighton used for Orr.

Comparison 12 Developed country: school meal versus control: CBA - Sensitivity, Outcome 7 Height gain in cm. adjusted ICC=0.016.
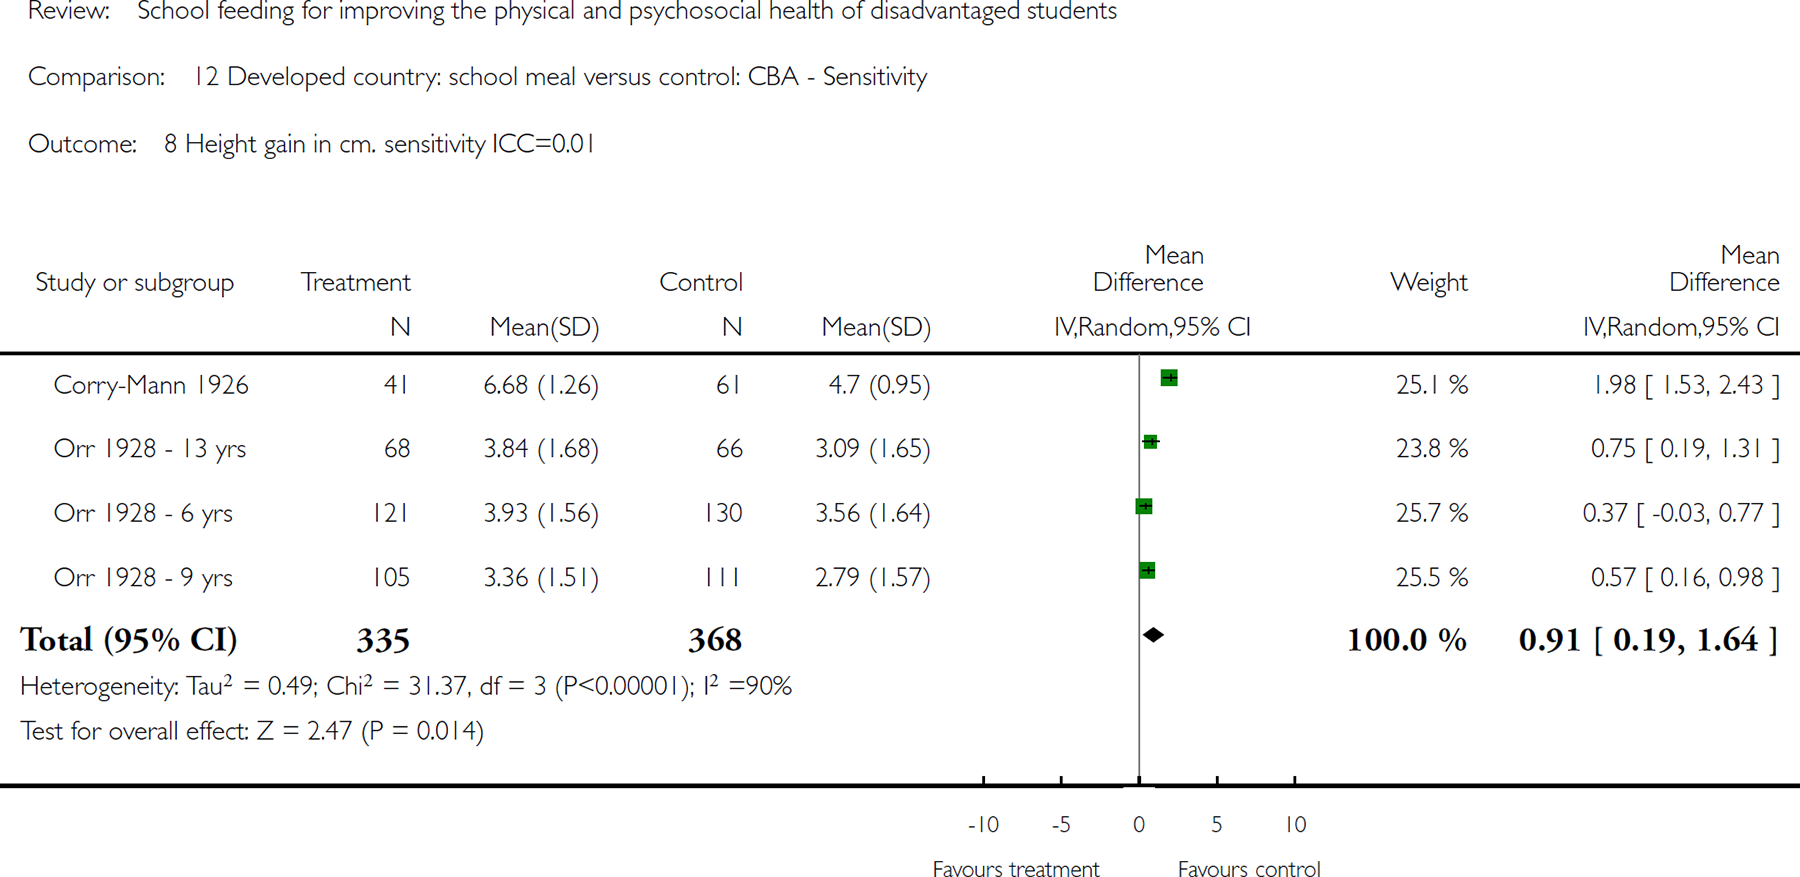
Comparison 12 Developed country: school meal versus control: CBA - Sensitivity, Outcome 8 Height gain in cm. sensitivity ICC=0.01.
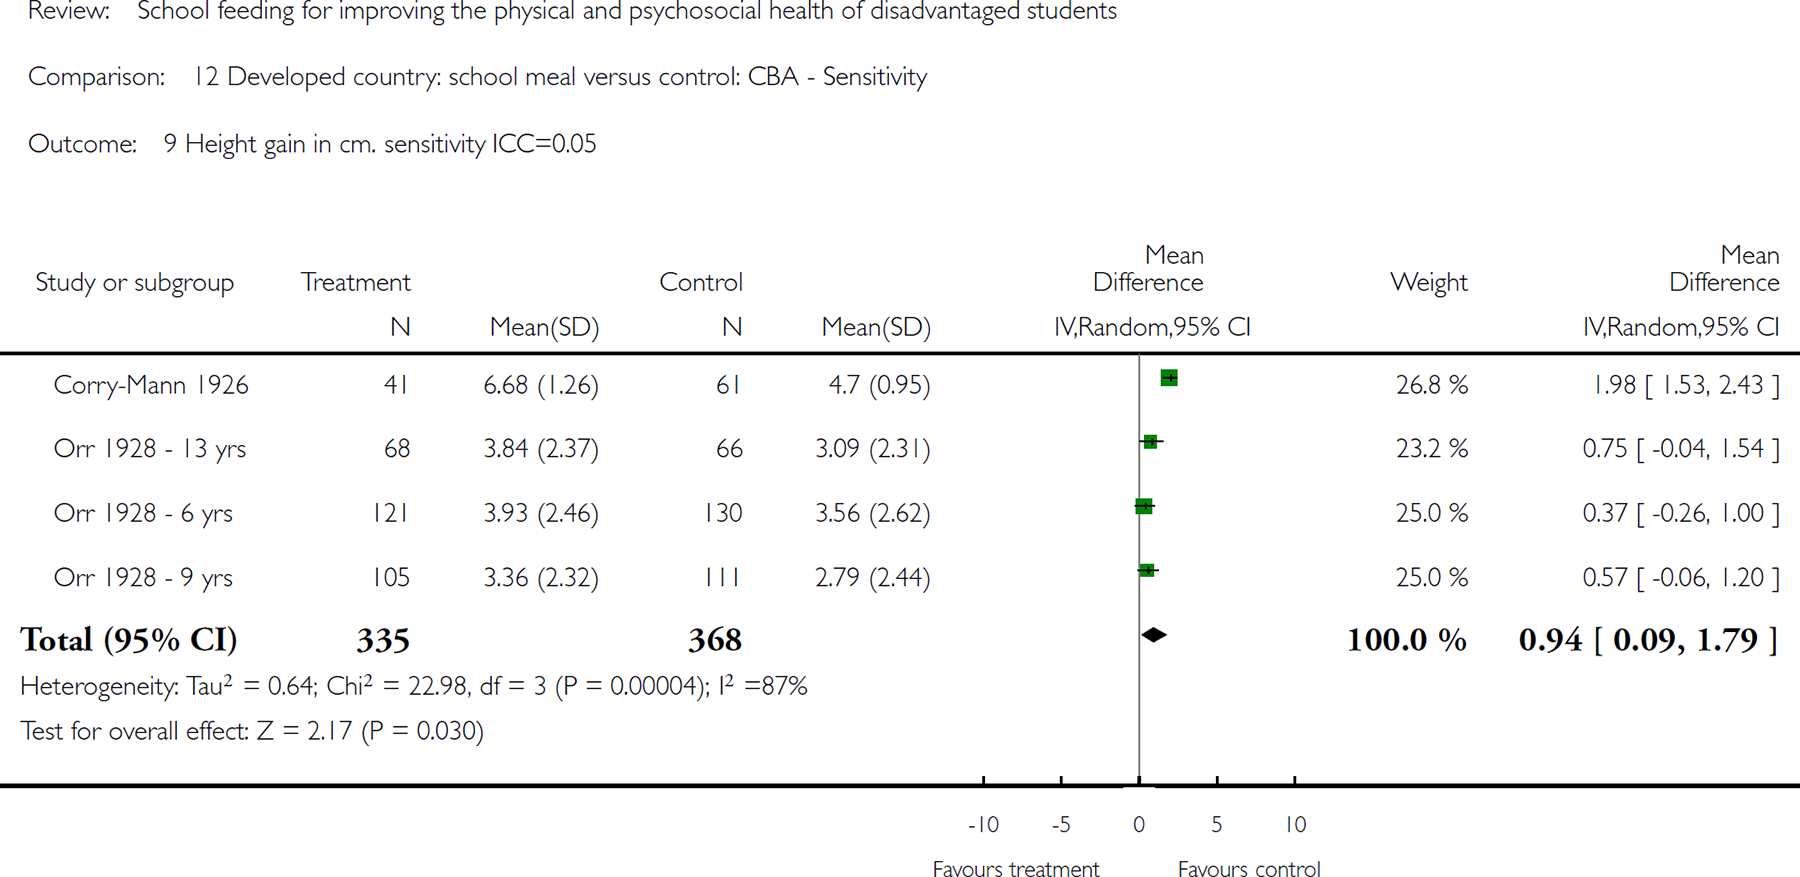
Comparison 12 Developed country: school meal versus control: CBA - Sensitivity, Outcome 9 Height gain in cm. sensitivity ICC=0.05.
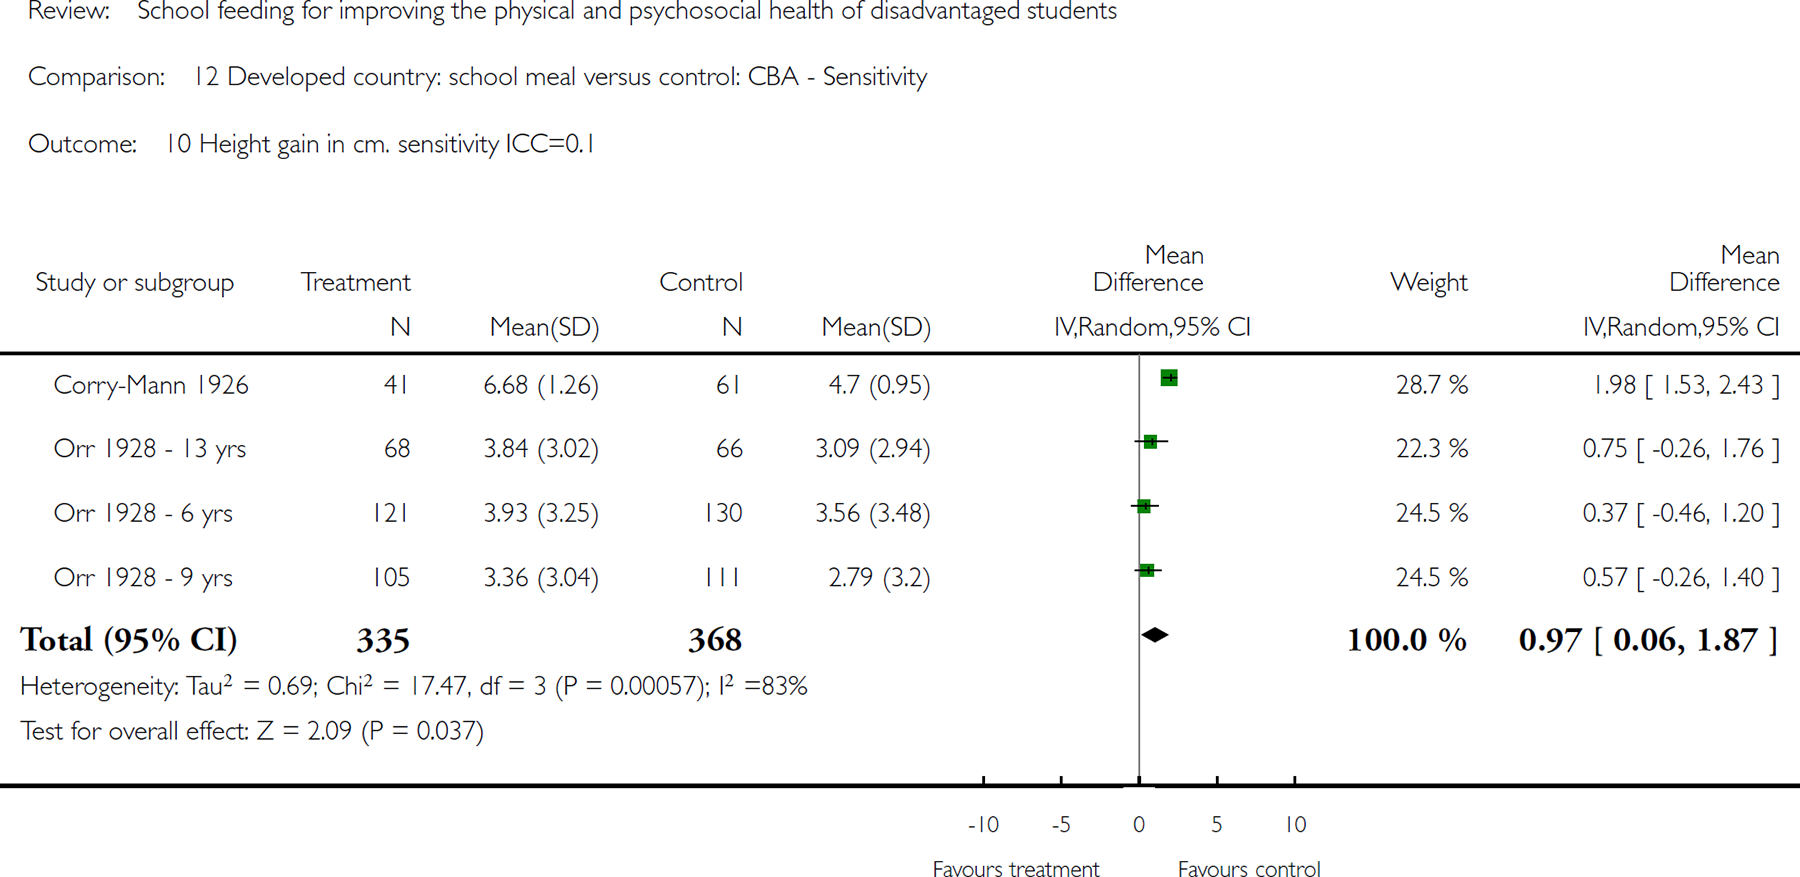
Comparison 12 Developed country: school meal versus control: CBA - Sensitivity, Outcome 10 Height gain in cm. sensitivity ICC=0.1.
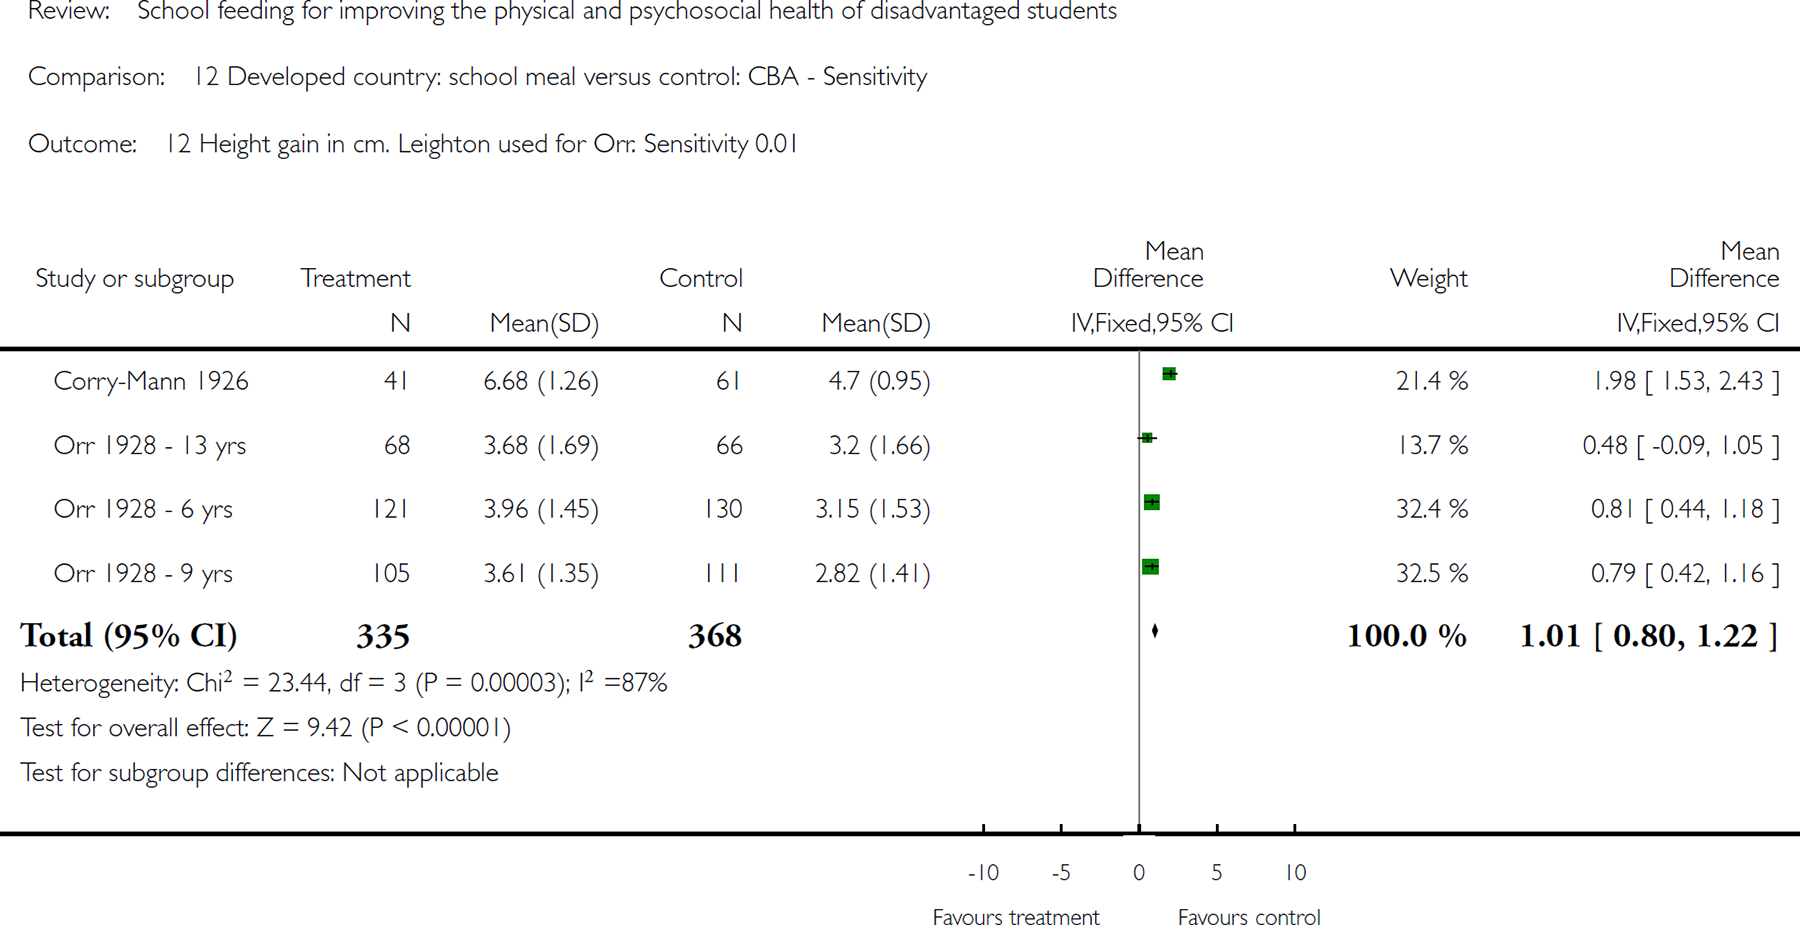
Comparison 12 Developed country: school meal versus control: CBA - Sensitivity, Outcome 12 Height gain in cm. Leighton used for Orr. Sensitivity 0.01.

Comparison 12 Developed country: school meal versus control: CBA - Sensitivity, Outcome 13 Height gain in cm. Sensitivity ICC = 0.05. Leighton used for Orr.
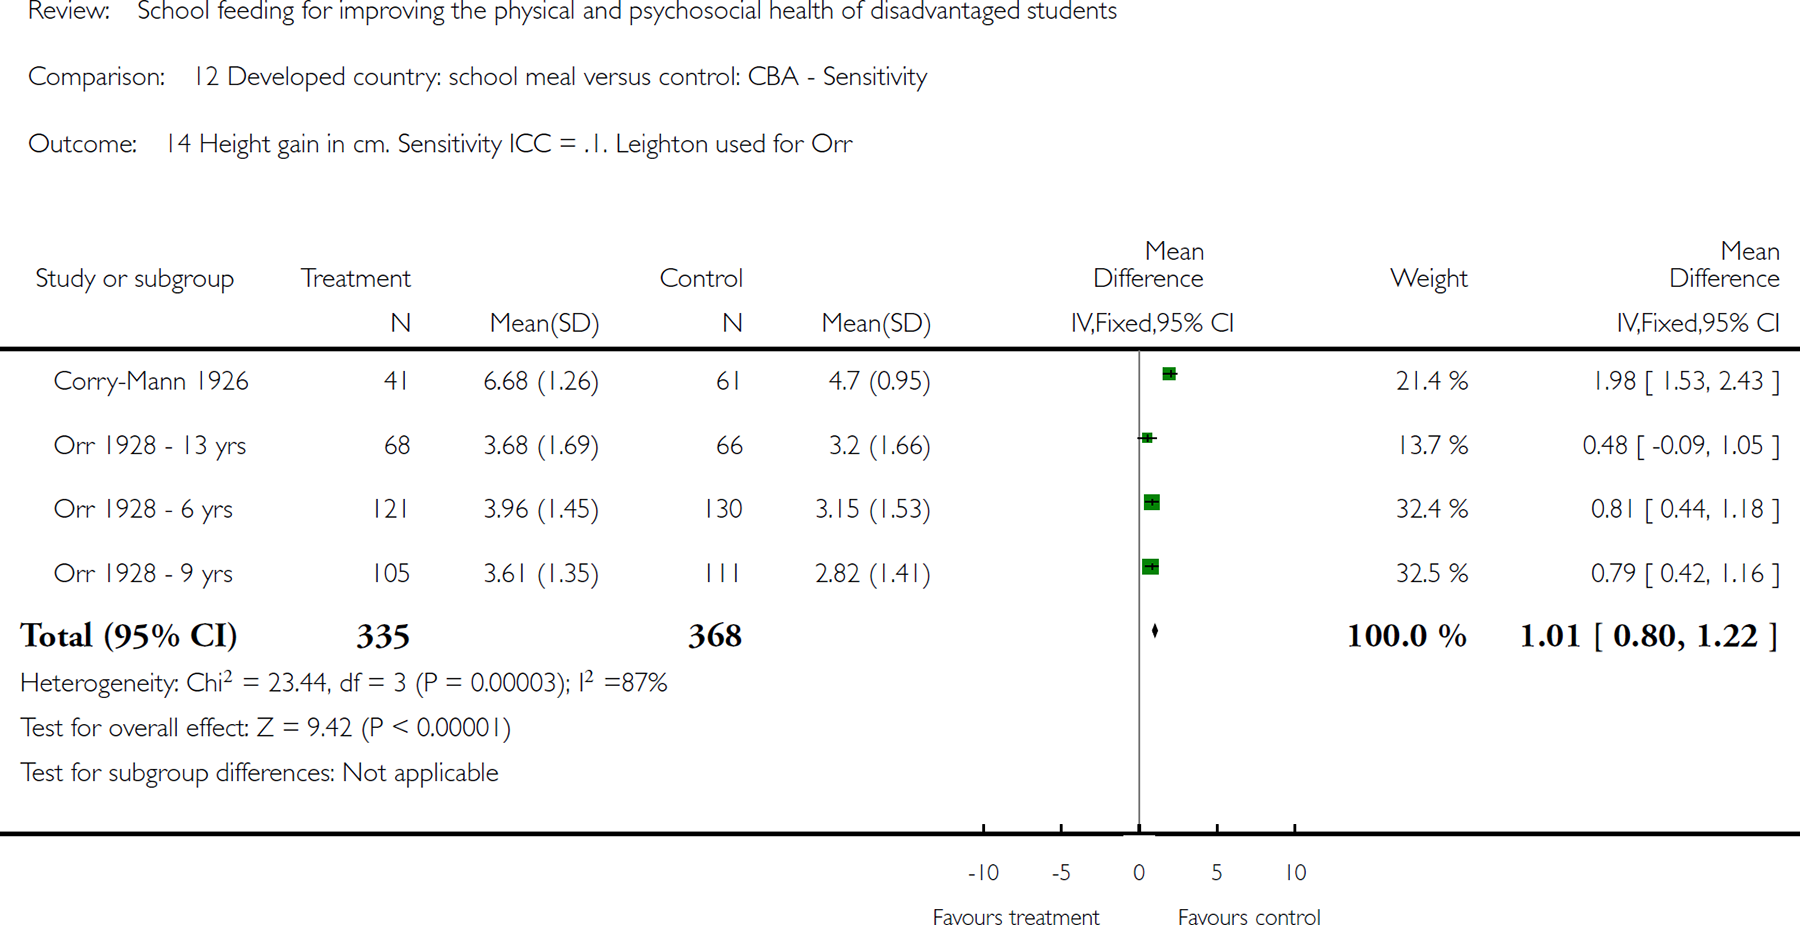
Comparison 12 Developed country: school meal versus control: CBA - Sensitivity, Outcome 14 Height gain in cm. Sensitivity ICC = .1. Leighton used for Orr.
01 Developing country: School meal vs control. RCT
01.01 Weight gain kg
01.02 Height gain (cm)
01.03 Weight for age: z-scores
01.04 Height for age: z-scores
01.14 MAUC
01.21 Mid-upper arm muscle area
01.22 Mid upper arm fat area
01.23 weight for height gain
02 Developing country RCT: Subgroup analysis: meals vs control
02.01 Undernourished vs adequately nourished: Weight gain in kg
02.01.01 Undernourished
02.01.02 Adequately Nourished
02.02 Undernourished versus adequately nourished, height in cm
02.02.01 Undernourished
02.02.02 Adequately nourished
02.03 Age subgroup analysis: weight gain in kg
02.03.01 Ages 5-6 years
02.03.02 Age 6-8 years
02.03.03 Age 9-10 years
02.03.04 Age 6-16 years
02.04 Age subgroup analysis: height gain (cm)
02.04.01 Ages 5-6 years
02.04.02 Age 6-8 years
02.04.03 Age 9-10 years
02.04.04 Age 6-16 years
03 Developing country: School meal vs control. CBA
03.01 Weight gain kg- adjusted ICC 0.025
03.02 Math change overall icc .15
03.03 Math change by nutritional status, icc 0.15
03.05 Height gain (cm)- adjusted ICC =0.016
03.09 subgroup analysis weight by sex
03.09.01 Agarwal boys
03.09.02 Agarwal: girls
03.10 Subgroup analysis: height by sex
03.10.01 agarwal boys
03.10.02 agarwal girls
03.11 Subgroup by age: weight gain in kg - Agarwal adjusted
03.11.01 Ages 5-6 years
03.11.02 Age 6-8 years
03.11.03 Age 9-10 years
03.11.04 Age 6-16 years
03.12 Subgroup by age: height gain in cm - Agarwal adjusted
03.12.01 Ages 5-6 years
03.12.02 Age 6-8 years
03.12.03 Age 9-10 years
03.12.04 Age 6-16 years
03.13 Full scale IQ (total): adjusted-ICC 0.15
03.21 Full scale IQ (separated): cluster size as in analysis: icc = .15
03.24 Performance IQ (separated): numbers as in analysis: ICC = 0.15
03.26 Performance IQ (total): adjusted-ICC 0.15
03.28 Verbal IQ (separated): cluster size as in analysis: ICC= 0.15
03.29 Verbal IQ (total): adjusted- ICC 0.15
03.36 Percent weight for age: ICC= .025
03.40 Percent height for age: ICC= 0.016
03.44 Change in reading: ICC= .15
03.47 change in spelling: ICC = .15
03.56 change in attendance: icc = .15
03.57 End of study: attendance: icc = .15
04 developed country: school meal versus control: CBA
04.02 Weight gain: Corry-Mann alone
04.07 Height gain in cm. adjusted ICC=0.016
05 Developed country: School meal vs control RCT
05.01 change in height
05.02 Subgroup analysis: height by sex
05.02.01 bakerboys
05.02.02 baker girls
05.03 change in weight (kg)
05.04 Subgroup analysis: weight by sex
05.04.01 bakerboys
05.04.02 baker girls
10 Developing country: School meal vs control. RCT- Sensitivity
10.05 Weight gain kg- sensitivity ICC 0.01
10.06 Weight gain kg- sensitivity ICC 0.05
10.07 Weight gain kg- sensitivity ICC 0.1
10.09 Height gain (cm), sensitivity ICC 0.01
10.10 Height gain (cm), sensitivity ICC 0.05
10.11 Height gain (cm), sensitivity ICC 0.1
11 Developing country: School meal vs control. CBA – Sensitivity
11.01 Math change overall icc .1
11.02 Weight gain kg- sensitivity ICC 0.01
11.03 Weight gain kg- sensitivity ICC 0.05
11.04 Weight gain kg- sensitivity ICC 0.1
11.05 Math change overall icc .2
11.06 Height gain (cm)- sensitivity ICC 0.01
11.07 Height gain (cm)- sensitivity ICC 0.05
11.08 Height gain (cm)- sensitivity ICC 0.1
11.11 Percent height for age: icc = 0.05
11.12 Percent height for age: icc = .1
11.14 Full scale IQ (total)- sensitivity 0.1
11.16 Math (change) by nutritional status: cluster size as in analysis Sensitivity ICC=0.2
11.17 Math (change) by nutritional status: cluster size as in analysis Sensitivity ICC=0.1
11.18 Full scale IQ (total)- sensitivity 0.20
11.20 Full scale IQ (end study): sensitivity cluster size as in analysis ICC= 0.1
11.22 Full scale IQ (end study): sensitivity cluster size as in analysis: ICC = 0.2
11.23 Performance IQ (end study): Sensitivity cluster size as in analysis: ICC = 0.1
11.25 Performance IQ (end study): Sensitivity cluster size as in analysis: ICC = 0.2
11.27 Verbal IQ (end study): Sensitivity cluster size as in analyses: ICC = 0.1
11.29 Verbal IQ (end study): Sensitivity cluster size as in analysis: ICC = 0.2
11.30 Percentage standard weight. Sensitivity = 0.01
11.32 Percent weight for age: Sensitivity ICC= 0.05
11.33 Percent weight for age: Sensitivity ICC= 0.1
11.36 Verbal IQ (total): sensitivity-0.10
11.37 Verbal IQ (total): sensitivity-0.20
11.38 Performance IQ (total): sensitivity-0.10
11.39 Percentage standard height. Sensitivity = .01
11.41 Performance IQ (total): sensitivity-0.20
11.45 change in reading: sensitivity ICC= .1
11.46 change in reading: sensitivity ICC= .2
11.50 change in spelling: sensitivity ICC= .1
11.52 change in spelling: sensitivity ICC= 0.2
11.58 Change in attendance: sensitivity = .10
11.59 change in attendance: sensitivity = .20
11.60 End of study attendance: sensitivity icc = .10
11.61 End of study attendance: sensitvity icc at .2
11.62 Change in Attendace: Sensitivity = .05
12 Developed country: school meal versus control: CBA – Sensitivity
12.03 Weight gain in kg- sensitivity icc=0.01. Leighton 1929 used for Orr
12.04 Weight gain in kg.- sensitivity icc=0.05. Leighton used for Orr
12.05 Weight gain in kg. - sensitivity ICC=0.1. Leighton used for Orr
12.07 Height gain in cm. adjusted ICC=0.016
12.08 Height gain in cm. sensitivity ICC=0.01
12.09 Height gain in cm. sensitivity ICC=0.05
12.10 Height gain in cm. sensitivity ICC=0.1
12.12 Height gain in cm. Leighton used for Orr. Sensitivity 0.01
12.13 Height gain in cm. Sensitivity ICC = 0.05. Leighton used for Orr
12.14 Height gain in cm. Sensitivity ICC = .1. Leighton used for Orr
Additional tables
01 Absolute and relative differences for randomized controlled trials
02 Absolute and relative differences for controlled before after studies
03 Absolute and relative differences for subgroup analysis by age: RCTs
04 Absolute and relative differences for age subgroups: CBAs
05 Quality of included studies
06 Table 6: LLMIC: Effect size and significance by various study attributes
07 Table 7: HIC: Effect size and significance by various study attributes
Contact details for co-reviewers
Anna P Farmer
Graduate Research Fellow
Cochrane Effective Practice and Organisation of Care
Institute of Population Health, University of Ottawa
1 Stewart St. Ottawa
Ontario CANADA
K1N 6N5
Telephone 1: 613-562-6800
Facsimile: 613-562-5659
E-mail:
URL: www.epoc.uottawa.ca
Trish Greenhalgh
Professorof Primary of Health Care
Primary Care and Population Sciences
University College London
410 Holburn Union Building
Highgate Hill
London
UK
N19 5LW
Telephone 1: 44 (0) 20 7288 3246
Facsimile: 44 (0) 20 7281 8004
E-mail:
Dr Laura Janzen, PhD., C.Psych., ABPP-CN
Psychologist
Department of Psychology & Division of Haematology/Oncology
The Hospital for Sick Children
555 University Avenue
Toronto
Ontario CANADA
M5G 1X8
Telephone 1: + (416) 813 5437
E-mail:
Julia Krasevec
c/o Contact Author
Dr Barbara MacDonald
c/o Contact Author
Jessie MacGowan
Institute of Population Health
University of Ottawa
Mr Alain Mayhew
Co-ordinator, Cochrane Effective Practice and Organisation of Care Group
Institute of Population Health
University of Ottawa
1 Stewart Street
Ottawa
Ontario CANADA
K1N 6N5
Telephone 1: 613 562 5800 ext: 2361
Facsimile: 613 562 5659
E-mail:
Dr Mark Petticrew
Professor of Public Health Evaluation
PEHRU
London School of Hygiene and Tropical Medicine
Keppel Street
London
UK
WC1E 7HT
Telephone 1: +44 (0)207 027 2009
E-mail:
Ms Vivian Robinson
Institute of Popoulation Health
University of Ottawa
One Stewart Street, Room 310
Ottawa
Ontario CANADA
K1N 6N5
Telephone 1: +1 613 562-5800 ext: 1963
Facsimile: +1 613 562-5659
E-mail:
Beverley Shea
Institute of Population Health
University of Ottawa
1 Stewart St.
Room 312
Ottawa
Ontario CANADA
K1N 6N5
Telephone 1: +1 613 562 5800 ext: 8571
E-mail:
Dr Peter Tugwell Director
Centre for Global Health, Institute of Population Health
University of Ottawa
1 Stewart Street
Ottawa
Ontario CANADA
K1N 6N5
Telephone 1: 613-562-5800 ext: 1945
Facsimile: 613-562-5659
E-mail:
Dr George A Wells, PhD, MSc
Director
Cardiovascular Research Reference Centre
University of Ottawa Heart Institute
Room H1-1
40 Ruskin Street
Ottawa
Ontario CANADA
K1Y 4W7
Telephone 1: +1 613 798 5555 18640
Telephone 2: +1 613 798 5555 18642
E-mail:
Footnotes
indicates the primary reference for the study