






Abstract
This Campbell systematic review examines the impacts of police strategies to reduce illegal possession and carrying of firearms on gun crime. Examples include gun detection patrols in high-crime areas, enhanced surveillance of probationers and parolees, weapon reporting hotlines, consent searches, and other similar tactics.
Four studies met the inclusion criteria, reporting a total of seven non-randomized tests of directed patrols focused on gun carrying in three American cities (five tests) and two Colombian cities (two tests).
These studies suggest that directed patrols focused on illegal gun carrying prevent gun crimes. However, conclusions and generalizations must be qualified based on the small number of studies, variability in study design and analytic strategy across the studies, pre-intervention differences between intervention and comparison areas, and limited data regarding factors such as implementation, crime displacement, and long-term impact. There is also a strong need for rigorous study of other strategies to reduce illegal possession and carrying of firearms.
Executive summary/Abstract
BACKGROUND
Criminal misuse of firearms is among the world's most serious crime problems. Strategies to reduce gun violence include efforts to restrict the manufacture and sale of firearms, interrupt the illegal supply of guns, deter gun possession, reduce gun carrying in public places, toughen responses to illegal gun use, reduce demand for firearms, promote responsible ownership of guns, and address community conditions that foster gun crime. In this review, we examine research on the effectiveness of selected law enforcement strategies for reducing gun crime and gun violence.
OBJECTIVES
This review examines the impacts of police strategies to reduce illegal possession and carrying of firearms on gun crime. Examples include gun detection patrols in high-crime areas, enhanced surveillance of probationers and parolees, weapon reporting hotlines, consent searches, and other similar tactics.
CRITERIA FOR INCLUSION OF STUDIES
Studies using randomized designs or quasi-experimental designs involving a nonintervention condition were eligible for inclusion. Eligible studies had to include pre and post-intervention measurements of the outcome measure(s) for an intervention area(s) or group(s) and at least one comparison area or group without the intervention. However, we also included studies involving repeated interventions with one group or area in which the intervention and comparison units consisted of samples of time with and without the intervention. Eligible studies also had to measure gun-related crime (e.g., gun murders, shootings, gun robberies, gun assaults). The review does not include studies in which eligible interventions were implemented simultaneously with other new crime-reduction efforts.
SEARCH STRATEGY
We searched 11 national and international databases for published and unpublished literature available through the end of 2009; examined 25 reviews and compilations of research on policing, gun control, and violence reduction; and searched the websites of five prominent police and criminal justice organizations in the United States and the United Kingdom. Four studies met the inclusion criteria, reporting a total of 7 non-randomized tests of directed patrols focused on gun carrying in three American cities (5 tests) and two Colombian cities (2 tests).
DATA COLLECTION AND ANALYSIS
From each included study, we extracted data pertaining to research design, subject characteristics, intervention(s), and outcome measure(s). We present a detailed narrative assessment of each included study, followed by a qualitative and quantitative synthesis of key features and results across studies. Our synthesis does not include a statistical meta-analysis of the results due to variability in the study designs and problems in computing a usable standardized effect size index for the studies.
MAIN RESULTS
Six of the seven tests (not all of which were independent) suggest that directed patrols reduced gun crime in high-crime places at high-risk times. The Colombian studies, which were based on before and after changes from repeated interventions measured at the city level, estimated that crackdowns on gun carrying reduced firearm homicides 10% to 15%. Estimated effects were generally larger and more variable in the American studies, which examined before and after changes in smaller target areas (beats or patrol zones) relative to changes in comparison areas. With one exception, the American studies found that gun crime declined by 29% to 71%, depending on the outcome measures and statistical techniques used. Authors' Conclusions: These studies suggest that directed patrols focused on illegal gun carrying prevent gun crimes. However, conclusions and generalizations must be qualified based on the small number of studies, variability in study design and analytic strategy across the studies, pre-intervention differences between intervention and comparison areas, and limited data regarding factors such as implementation, crime displacement, and long-term impact. There is also a strong need for rigorous study of other strategies to reduce illegal possession and carrying of firearms.
1 Introduction
Criminal misuse of firearms is among the world's most serious crime problems. In the United States, for example, there were nearly 10,000 murders with firearms in 2010 (calculated from Federal Bureau of Investigation statistics available at http://www.fbi.gov/about-us/cjis/ucr/ucr) and another 338,000 non-fatal violent crimes with guns (Truman, 2011). Violent crimes with guns are about 3 times as likely to be deadly as crimes committed with knives and nearly 44 times as likely to be deadly as crimes involving no weapons (Alba and Messner 1995, pp. 397-402; also see Cook 1991; Zimring 1968). The prevalence of guns may contribute to particularly high levels of homicide in the United States (e.g., Hoskins 2001; Zimring and Hawkins 1997), where some estimates imply that the total costs of gun violence–including medical, criminal justice, and other costs–could be well over $100 billion per year (calculated from Cohen et al. 2004; also see Cook and Ludwig 2000).
Nations such as Colombia, Brazil, Mexico, and South Africa have firearm homicide rates that exceed those of the United States (Krug et al. 1998; United Nations 1997; Villaveces et al. 2000). Guns are also involved in roughly a quarter to a third of homicides in a number of countries not known for having serious gun violence problems, including Canada, France, Israel, the Netherlands, Norway, and New Zealand (calculated from Fingerhut et al. 1998, p. 18). In England and Wales, where gun possession is strictly regulated relative to the United States, crimes with firearms have roughly doubled since the late 1990s (Kaiza 2008).
Strategies for reducing gun violence range from restrictions on the manufacture and sale of firearms to educational efforts that promote safe storage and use of firearms or discourage firearm ownership. In this paper, we review research on the effectiveness of law enforcement strategies for reducing gun crime and gun violence through reducing illegal gun possession and carrying.
2 Background: law enforcement strategies for reducing gun violence
Strategies to reduce gun violence may attempt to interrupt the illegal supply of guns, deter gun possession, reduce gun carrying in public places, toughen responses to illegal gun use, reduce demand for firearms, promote responsible ownership of guns, and address community conditions that foster gun crime (e.g., see Center to Prevent Handgun Violence 1998; Office of Juvenile Justice and Delinquency Prevention 1999). Law enforcement agencies are integral in all of these domains.
Police typically handle gun crimes reactively, investigating violent gun crimes and making arrests for illegal possession or carrying when they encounter violations during routine activities (such as answering calls for service). To varying degrees, police also use proactive strategies to emphasize the targeting of gun crime. Among others, these include: disrupting the illegal supply of firearms through investigation of illicit gun trafficking, gun theft, and suspicious activities by retail gun dealers; focusing intensive investigative and enforcement activities on violent gun offenders and people at high-risk for gun violence (such as gang members and career gun offenders); implementing educational and preventive activities in conjunction with schools and other community groups (e.g., teaching students about gun safety) and collaborating with other criminal justice, government, and community organizations on comprehensive initiatives that combine various enforcement, prosecutorial, and prevention activities.
This review examines evidence for law enforcement strategies that aim to reduce illegal gun possession and carrying through gun detection patrols in high-crime areas, enhanced surveillance of probationers and parolees, weapon reporting hotlines, consent searches, and other tactics. In the United States, gun possession is common among persons prohibited from lawful gun ownership, including those with prior convictions for serious crimes. Nationally, over 80% of incarcerated gun offenders appear to have possessed guns illegally prior to confinement; more than a third were already on probation or parole when they were arrested for a gun crime (Harlow 2001, p.10). Studies of murderers in some U.S. cities have revealed similar patterns (Kennedy et al. 1996; Moran 2006; Tierney et al. 2001).
Many juveniles (i.e., those under the age of 18) also possess guns in the United States despite various legal restrictions on their access to firearms. A survey of incarcerated juvenile offenders and inner city high school students in four states during the 1990s, for example, found that 83% of the inmates possessed guns prior to confinement, as did 22% of the students (Sheley and Wright 1993, p.4). Persons under the age of 18 committed nearly 10% of gun murders in the United States from 2000 through 2005 (calculated from Fox and Zawitz 2007).
Carrying of firearms is central to the commission of gun crimes in public locations, which is where many violent and predatory crimes occur. Almost all gun robberies, for example, are likely to involve gun carrying. In the U.S. city of Philadelphia, 76% of homicides from 1996 through 1999 occurred in a non-residential location and 80% were committed with guns; this implies that many if not most homicides were committed by offenders carrying firearms in public places (Tierney et al. 2001). Despite legal restrictions on gun carrying, survey evidence suggests that roughly one-third to one-half of serious adult and juvenile offenders in the United States carry guns regularly for defense and to be prepared for criminal opportunities (Sheley and Wright 1993, p.5; Wright and Rossi 1986, pp.99-102). For all of these reasons, police strategies to reduce illegal possession and carrying of firearms are important to the prevention of gun violence.
This review is not the first to examine the impacts of police crackdowns on illegal gun carrying. Other assessments of studies in this area have been conducted by the National Research Council (NRC) in the United States (NRC 2005), Sherman (1997), and Sherman and Eck (2002). This paper expands on these earlier efforts by systematically reviewing and updating the literature, by examining studies in greater detail than have earlier reviews, by incorporating research from outside the United States, and by considering strategies other than directed patrols for reducing illegal gun possession and carrying (e.g., enhanced monitoring of probationers and parolees and consent searches of at-risk youth).
3 Methodology
Our review was conducted using systematic methods (e.g., see Farrington and Petrosino 2001) as required for Campbell Collaboration reviews, and an earlier version (which was done independently by the authors and not reviewed by the Campbell Collaboration) has been published elsewhere (Koper and Mayo-Wilson 2006). In the sections below, we discuss our criteria for selecting studies, our search strategy, and our methods for data collection and synthesis 1 .
3.1 CRITERIA FOR INCLUSION OF STUDIES
3.1.1 Types of interventions
This review sought to examine evidence on a range of police interventions to reduce the illegal possession and carrying of firearms, including: directed or saturation patrols; roadblock checkpoints; enhanced monitoring of probationers, parolees, and other suspected gun offenders; use of new gun (and gunshot) detection technologies (such as portable, magnetic gun detection devices) 2 ; weapon reporting hotlines; searches of school lockers; and zero tolerance/crackdown initiatives. In order to make comparisons, interventions had to represent departures from normal practice (e.g., instituting new gun detection patrols).
To isolate the effects of these tactics, the review does not include studies in which these interventions were implemented simultaneously with other new crime-reduction efforts, whether by police or other organizations (e.g., Braga et al. 2001; Tita et al. 2003). Further, because the review emphasizes police action, we excluded legislative, prosecutorial, and judicial initiatives to enhance penalties for gun possession and carrying (i.e., efforts to increase the severity of punishment for these offenses). 3 Finally, the review does not include studies of gun buy-back programs (e.g., Plotkin 1996). Although these programs encourage illegal gun possessors to relinquish their firearms, they function more broadly as supply-side efforts to reduce the availability of guns in high-risk areas (e.g., see NRC 2005, pp. 95-96).
3.1.2 Study design
Studies using randomized designs or quasi-experimental designs involving a nonintervention condition were eligible for inclusion. These designs present fewer threats to a study's internal validity than do other methods of assessing the effects of interventions, such as correlational studies or before and after comparisons. Eligible studies had to include pre and post-intervention measurements of the outcome measure(s) for an intervention area(s) or group(s) and at least one comparison area or group without the intervention. We also included studies involving repeated interventions with one group or area in which the intervention and comparison units consisted of samples of time with and without the intervention (the time-equivalent samples design) (Campbell and Stanley 1966). Studies not utilizing random assignment had to have comparison units of the same type. If the comparison and intervention units were not matched (e.g., using pre-intervention crime rates), the studies had to include statistical controls to account for crime-related differences in the units. 4
3.1.3 Outcome measures
Eligible studies had to measure gun-related crime (e.g., gun murders, shootings, gun robberies, gun assaults). Arrests for illegal possession and carrying of guns were not analyzed as outcomes because they were considered measures of program implementation. 5
3.2 SEARCH STRATEGY
The following 11 national and international databases were searched for published and unpublished literature available through 2009. Criminal Justice Abstracts National Criminal Justice Reference Service Abstracts Database Criminal Justice Periodicals Index Sociological Abstracts Econlit Medline Dissertation Abstracts Catalog of U.S. Government Publications Policyfile Public Affairs Information Service International Educational Resources Information Clearinghouse
These databases were searched for the combination of terms on police (i.e., police, policing, or law enforcement) and firearms (i.e., firearm or gun). 6
In addition, searches were conducted on the websites of five prominent police and criminal justice organizations in the United States and the United Kingdom: the Police Executive Research Forum, the International Association of Chiefs of Police, the Office of Community Oriented Policing Services (U.S. Department of Justice), the Justice Research and Statistics Association, and the National Policing Improvement Agency of the United Kingdom. The Justice Research and Statistics Association maintains a database of reports by crime and justice statistical analysis centers operated (or funded) by state governments throughout the United States. The National Policing Improvement Agency of the United Kingdom has an online catalog with an extensive collection of books, reports, and journal articles from the United Kingdom and elsewhere. The other named organizations have searchable catalogs of their own reports and publications. Finally, 25 reviews and compilations of research on policing, gun control, and violence reduction were examined (Braga 2004, 2007; Centers for Disease Control and Prevention 2003; Center to Prevent Handgun Violence 1998; Cook and Moore 1995; Dedel 2007; Eck and Maguire 2000; Harcourt 2003; Jacobs 2002; Kleck 1997; Lum et al. 2011; Ludwig and Cook 2003; National Institutes of Health 2004; NRC 2004, 2005; Office of Juvenile Justice and Delinquency Prevention 1999; Reiss and Roth 1993; Scott 2003; Sherman 1990, 1992, 1997, 2001; Sherman and Eck 2002; Wintemute 2000; Wright et al. 1983). The senior author conducted or supervised all searches (a research assistant provided support in the searching of literature databases) and screened studies for eligibility.
3.3 DATA MANAGEMENT AND EXTRACTION
From each included study, both authors independently extracted data pertaining to research design, subject characteristics, intervention(s), and outcome measure(s). Differences in their coding were resolved through discussion as needed. Tables 1 through 3 summarize these features.
3.4 DATA SYNTHESIS
We present a detailed narrative assessment of each included study, followed by a qualitative and quantitative synthesis of key features and results across studies. However, our synthesis does not include a statistical meta-analysis of the results for reasons considered in Section 6.
4 Literature search results
Our search identified 25 studies—none of which were randomized trials—that described or evaluated eligible strategies. Seven of these studies were excluded due to the lack of an outcome evaluation. Another 14 were excluded based on the criteria for study design and outcome measures and/or the inclusion of ineligible program components (the effects of which could not be distinguished from those of eligible components). 7 Studies meeting the review criteria included four non-randomized evaluations testing police crackdowns on gun carrying in three U.S. cities—Kansas City, Missouri (Sherman and Rogan 1995; also see Shaw 1994, 1995; Sherman et al. 1995), Indianapolis, Indiana (McGarrell et al. 2000; also see McGarrell et al. 2001, 2002), and Pittsburgh, Pennsylvania (Cohen and Ludwig 2003)—and two Colombian cities—Cali and Bogota (Villaveces et al. 2000). All of the studies examined directed patrols, which involve assigning additional officers to high-crime areas at high-risk times and allowing them to focus on proactive investigation and enforcement (e.g., intensified traffic enforcement and field interrogations of suspicious persons) rather than answer calls for service (McGarrell et al. 2001, p. 120). 8
Police and researchers have long recognized that crime is concentrated in particular neighborhoods within cities (e.g., Shaw and McKay 1942). 9 For example, the intervention areas in the studies conducted in Kansas City and Indianapolis were relatively small areas of 0.6 to 2.8 square miles with 4,000 to 17,000 persons and homicide rates 7 to 20 times the national average. The two intervention areas in Indianapolis accounted for 19% of that city's homicides in 1996 while having only 8% of its population. Within such areas, crime is further concentrated in particular street blocks, addresses, and intersections that are nodes for various business, leisure, and travel activities. In large U.S. cities, about 50% of crime occurs within less than 5% of the street blocks and addresses (e.g., Sherman et al. 1989; Weisburd et al. 2004). Crime also follows temporal patterns according to season, day of week, and time of day. Violent crime, for instance, tends to be higher in warm weather, on weekends, and during evening hours (e.g., Cohen and Ludwig 2003; Tierney et al. 2001; Zawitz et al. 1993, p. 28).
Several studies conducted during the last few decades suggest that greater numbers of police and higher levels of proactive patrol activity can reduce crime in high-risk areas and at high-risk times, thus enhancing police efficiency and effectiveness (e.g., Boydstun 1975; Sampson and Cohen 1988; Schnelle et al. 1977; Sherman and Weisburd 1995; also see reviews in NRC 2004; Sherman and Eck, 2002). 10 In recent years, practitioners and researchers have increasingly emphasized directed patrols as a means to reduce gun crime in such contexts. In a 2009 survey of police agencies serving cities of 100,000 or more in the United States, over 40% reported using directed patrols or other specialized units emphasizing gun detection in hot spots on a frequent or regular basis and approximately one-third reported using them at least occasionally (Koper et al. 2012). In the studies reviewed here, officers sought to detect and deter illegal gun carrying—the suppression of which is thought to be a key mechanism for reducing gun crime at high-risk places and times—by enhancing their visibility and by initiating greater numbers of traffic stops and field interrogations. 11
Two of the U.S. studies (Indianapolis and Pittsburgh) involved interventions in multiple locations (i.e., patrol areas). Combining these studies with the Kansas City and Colombian studies thus provides seven tests of the effects of directed patrols on gun crime. 12 However, the tests were not all independent; two intervention areas in Indianapolis were compared to a single comparison area and two intervention areas in Pittsburgh were compared to the same comparison areas. The Colombian studies, in contrast, compared intervention and non-intervention periods in the same cities, adjusting for statistical differences between these periods. As described below, the studies differed considerably as a group in their units of analysis, intervention delivery, comparison groups, and statistical techniques.
No studies explicitly testing other police strategies for reducing illegal gun possession and carrying met the criteria for inclusion. However, the included studies used some of these tactics in addition to directed patrols; roadblock checkpoints were used in Bogota and Cali, enhanced monitoring of probationers occurred in one area in Indianapolis, and a weapon reporting hotline preceded the introduction of directed patrols in Kansas City.
5 Narrative assessment of studies
Because the eligible studies are few in number and non-randomized, we first present a detailed narrative assessment of each study. In the subsections below, we summarize key aspects of the interventions, the study designs, and the results of the included studies, while also highlighting their methodological limitations. Overall, six of the seven tests presented in these studies produced evidence that directed patrols focused on guns reduce gun crime. (Unless stated otherwise, results described as statistically significant had two-tailed probability levels of 0.05 or less.) Conclusions and generalizations must be qualified, however, based on a number of considerations, including variability in the study designs and outcome measures across studies, potentially confounding differences between the intervention and comparison conditions, limited implementation data, and other methodological issues. Tables 1 through 3 summarize key features and results of the studies.
5.1 KANSAS CITY
5.1.1 Design
From July 1992 through January 1993, police in Kansas City implemented evening gun patrols in a 0.6 square-mile patrol beat with 4,528 residents and a homicide rate roughly 20 times the national average (Sherman and Rogan 1995; see also Sherman et al. 1995). Changes in gun crime were examined during the 29 intervention weeks relative to the prior 29 weeks. The study also examined changes based on 52-week pre and post-intervention periods (the 52-week post-intervention period included the 29 intervention weeks and 23 weeks after the patrols ended).
Changes in gun crime in the target area were contrasted with changes in a comparison area several miles away. Both areas had homicide rates many times the national average, had virtually identical numbers of drive-by shootings in 1991, and were overwhelmingly black. Moreover, the areas had similar gun crime trends during the three and a half years prior to the intervention: oscillating but generally stable levels from 1989 through the first half of 1991, followed by an upswing before the beginning of the intervention period.
However, the areas also differed in numerous ways. The comparison area was nearly twice the size of the target area (150 versus 80 square residential blocks) and had a lower population density (4,308 versus 7,075 residents per square mile), higher land values ($23,958 versus $14,181 median parcel value), and a better-educated population (73% versus 53% of adults with a high-school degree). Furthermore, although the areas had similar numbers of gun crimes, their rates differed substantially; relative to the target area, the comparison area had a 24% lower rate of homicide (1.4 versus 1.8 per 1,000 residents), a 40% lower rate of drive-by shootings (3.1 versus 5.3 per 1,000 residents), and a 23% lower rate of overall gun crime (31.0 versus 40.4 per 1,000 residents). (Table 1 highlights selected features of the areas.)
Studies of Directed Patrol and Gun Crime: Research Design and Subject Characteristics
5.1.2 Intervention
Prior to the gun patrols, officers conducted a ten-week program of door-to-door visits in the target area, during which they informed residents of the upcoming crackdown on gun carrying and asked them to report gun offenders to an anonymous tips hotline. The hotline received only two calls.
After the pre-intervention campaigns, patrols were done on 200 nights, usually by four officers in a pair of two-officer cars (see Table 2). Patrols involved a total of 4,512 officer-hours, during which the officers were freed from answering radio calls and engaged in proactive gun detection via car and pedestrian stops. Officers issued 1,090 traffic citations and made 948 car checks, 532 pedestrian checks, and 616 arrests. In the process, officers seized 29 guns, which increased total gun seizures in the area by 65% over the prior six-month period. The authors reported that “regular policing activities” increased in the area by 260% (Sherman and Rogan 1995).
Studies of Directed Patrol and Gun Crime: Implementation Measures
5.1.3 Main results
Total gun crimes–which consisted primarily of violent crimes with guns (i.e., robberies and assaults) but also included property crimes committed with guns (primarily destruction of property)–fell by 49% in the target area, from 169 in the 29 weeks prior to the patrols to 86 during the 29-week intervention period (see Table 3). This change was statistically significant in a t-test of weekly means. Similarly, an interrupted time series analysis based on the 52 weeks before the program and the 52 weeks following the start of the program suggested a drop of 2.6 gun crimes per week (or about 44%) after controlling for temporal trends. 13 As reported below, there was some evidence that the patrols may have reduced homicides and drive-by shootings, but there were no reported changes in total crimes, overall violent or property crimes, or disorderly behavior. Substitution of crimes without firearms was not assessed.
Studies of Directed Patrol and Gun Crime: Outcome Measures, Statistical Analyses, and Results
Though gun seizures did decline in the comparison area, there were no statistically significant changes in gun seizures or gun crime in the comparison beat. Gun crime increased 4% (from 184 to 192) from the 29 pre-intervention weeks to the 29 intervention weeks and declined by less than one gun crime per week (-.751) in the time series analysis of 52 pre-intervention and 52 post-intervention weeks. Direct statistical tests between the target and comparison areas were not reported.
It is possible that the post-intervention change in the intervention area was an artifact of regression to the mean; the intervention followed the highest levels of crime in the five years for which data were reported. After the intervention, gun crime in the target area dropped to a level comparable to what it had been from 1989 through mid-1991, raising the possibility that the evaluators missed a regression artifact by analyzing only the 29 and 52-week periods prior to the intervention. The fact that the crime drop in the target area coincided closely with the start of the intervention while no such regression occurred in the comparison area mitigates this concern to some degree, but it is hard to rule out a regression artifact in light of the short analysis period and the noted differences between the target and comparison areas.
5.1.4 Other results
To investigate geographic displacement of gun crime, the investigators used both t-tests (for 29-week pre and post periods) and interrupted time series models (for 52-week pre and post periods) to examine pre-post changes in the seven beats adjacent to the target beat, both individually and collectively (see Table 3). None of these beats experienced a statistically meaningful increase in gun crime. Collectively, the adjacent beats had a non-significant net increase of 52 gun crimes (7%) during the 29 intervention weeks–which would not wholly offset a reduction of 83 in the target area–and a non-significant drop for the 52-weeks spanning the intervention and follow-up period. Further, the city as a whole had a 2% drop in gun crime during the 29 intervention weeks, providing no obvious sign of displacement elsewhere.
While not significant, the time series impact estimate for all contiguous areas (impact= -2.577, p>.05) was similar to the impact estimate for the target area (impact= -2.558, p<.05) and both were greater than the non-significant impact estimate for the comparison area (impact= -.751, p>.05). Further, impact estimates were negative for five of the seven surrounding areas, and two of the negative estimates were statistically significant. This could be interpreted as evidence of diffusion of benefits or as evidence that the area as a whole was on a downward trend.
After a 5-month pause, the patrols were reintroduced from July 1993 to December 1993. The evaluators reported that gun crime again declined in the target area while rising in the comparison area, though they did not present details regarding the patrols or regarding crime trends during this second phase. In addition, contrasts of the two six-month intervention periods with all other half-year periods from 1991 through 1993 suggested that the patrols reduced both homicides (based on chi-square tests) and drive-by shootings (based on analysis of variance) in the target area while these crimes remained unchanged in the comparison area. 14 Finally, surveys suggested that gun patrols had strong community support and had favorable impacts on residents' perceptions of neighborhood conditions and fear of crime (Shaw 1995). 15
5.2 INDIANAPOLIS
5.2.1 Design
For 90 days during the latter part of 1997, police in Indianapolis implemented directed patrols in two target areas, each of which included two patrol beats (McGarrell et al. 2000, 2001, 2002). One target area in the east part of the city covered 1.7 square miles, with a primarily white and low-income population of about 14,600 residents and a violent crime rate 96% higher than the citywide rate (38.4 versus 19.6 per 1,000 residents) (see Table 1). Another target area in the north part of the city was a low-income area of about 16,600 residents, mostly black, and 2.8 square miles with a violent crime rate 72% higher than the citywide rate (33.8 versus 19.6 per 1,000 residents). Although pre-intervention crimes trends were not presented in detail, both areas appeared to have rising levels of violence. Violent crime rose 25% in the east area from early 1996 to early 1997 and 23% in the north area from early 1995 to early 1997 (McGarrell et al. 2000, Table 5-1).
The project evaluation contrasted changes in crime in the target areas to those in a comparison area that did not receive gun patrols (and where gun seizures declined during the study period). The comparison area consisted of two patrol beats in the east part of the city that together covered 4.7 square miles with a largely black population of about 19,300 persons. However, the area's violent crime rate was 33% to 41% lower than those of the respective target areas prior to the intervention. The population density in the comparison area (4,073 people per square mile) was much lower than the population density in either the east or north intervention areas (8,666 and 5,954 people per square mile, respectively). The comparison area was, therefore, more like the city as a whole than the target areas, which were relatively more violent and dense.
It is not clear that the comparison area offers a reasonable counterfactual of what would have happened in the target areas had the patrols not been in effect. Gun crime was much lower in the comparison area than in the north area (pre-intervention trends in the comparison area were not presented), and may have been low enough to create a floor effect; given the pre-intervention levels of crime, it is possible that the north area would appear to improve by comparison merely as a result of chance. To illustrate, the north target area had about six violent gun crimes per week (as measured by homicides, gun assaults, and armed robberies) during the 90-day period one year prior to the intervention. The east target area had four per week, and the comparison area had only three per week.
Gun crime was more comparable (in terms of numbers though not rates) in the east area and comparison area than in the north area and comparison area, and the east and comparison areas may have shared other similarities by virtue of their geographic proximity. However, they were very different demographically, and it is not clear if their pre-intervention crime trends were similar. Because the comparison area was not a particularly good match to the target areas, the authors also looked for changes in gun crime during the intervention period for the city overall (minus the target areas). Using time series analyses (described below), they found no significant changes.
5.2.2 Intervention
Officers implemented different styles of patrol in the two target areas (see Table 2). In the east target area, officers pursued a general deterrence strategy in which they sought to maximize traffic stops, thereby seizing more guns and creating a general sense of enhanced police presence. In the north area, officers made pedestrian and vehicle stops more selectively, utilizing a targeted offender approach that focused on particularly suspicious persons and vehicles. Officers in the north area also paired with probation officers to conduct home visits of probationers. During the 90-day intervention period, officers spent 2,905 hours patrolling the east/general deterrence area, making 3,826 vehicle stops and 558 arrests. In the north/targeted offender area, officers spent 1,975 hours on patrol, making 1,417 vehicle stops, 434 arrests, and 126 probation checks. 16
The gun patrols produced 12 illegal gun seizures in the north/targeted offender area and 13 illegal gun seizures in the east/general deterrence area, increasing total gun seizures 50% in the east/general deterrence area but by only 8% in the north/targeted offender area relative to the same 90-day period of the prior year. 17 Although gun seizures rose less (in percentage terms) in the north/targeted offender area than in the east/general deterrence area, there were more gun recoveries per officer-hour, per vehicle stop, and per pedestrian stop in the north area. Meanwhile, gun seizures fell 40% in the comparison area between these same periods (from 45 to 27).
5.2.3 Main results
During the intervention period, total gun crime (undefined) dropped 29% in the north/targeted offender area relative to the same 90-day period of the prior year (from 75 to 53) (see Table 3). 18 In addition, gun assaults and armed robberies (including those with guns and other weapons) both declined about 40%, and homicides dropped from seven to one. In total, homicides, gun assaults, and armed robberies dropped 44%, from 78 to 44. Based on analysis of variance tests, the reductions in gun assaults and armed robberies were statistically significant relative to the comparison area, where gun and weapon offenses increased (see below) and homicides remained unchanged.
In the east/general deterrence area, homicides dropped from four to zero, but other gun crimes rose. Contrasts of the east/general deterrence and comparison areas produced mixed and non-significant results. Total gun crimes, for example, increased 36% in the former but only 8% in the latter. On the other hand, total homicides, gun assaults, and armed robberies rose 22% in the east/general deterrence area (from 54 to 66) and 89% in the comparison area (from 38 to 72). 19
The investigators supplemented these tests with interrupted time series analyses of weekly violent gun crimes (approximated by the sum of homicides, gun assaults, and armed robberies) in each area over a 158-week span covering the 132 weeks (i.e., two-and-a-half years) prior to the intervention, the 13 intervention weeks, and 13 post-intervention weeks. Controlling for temporal trends, results suggested a statistically significant drop of nearly two gun crimes per week (-1.72) during the intervention in the north/targeted offender area (a result consistent with results in Kansas City), a statistically non-significant increase of 0.41 gun crimes per week in the east/general deterrence area, and a statistically significant increase of 1.46 gun crimes per week in the comparison area. 20 The time series analyses suggest that gun crime dropped in the north/targeted offender area and that the increase in the east/general deterrence area was due to normal variation or a pre-intervention trend. 21
Taking the results at face value, the targeted offender gun patrols may have been successful but the general deterrence patrols appear to have made little difference. The targeted offender patrol style may have enabled officers to focus their attention more efficiently and effectively on people and places at highest risk for gun violence; however, one might question whether the patrol styles interacted with differences between the target areas in crime, racial composition, and other factors. 22
5.2.4 Other results
Focusing on other results from the north/targeted offender area, the gun patrols did not appear to affect violent crimes without firearms. 23 Nor was there clear evidence of crime displacement or diffusion of benefits to nearby areas; collectively, the five patrol beats surrounding the north target area experienced a 10% increase in homicides, gun assaults, and armed robberies (relative to the same 90-day period of the prior year), which was statistically non-significant, spread across the areas, and too small to completely offset the corresponding reduction in the north/targeted activities area. 24
Community surveys administered by the evaluators indicated that the initiative had a high level of public support, which may have been due in part to the efforts of police managers to emphasize professional and respectful treatment of citizens and to secure the support of neighborhood leaders prior to the intervention. 25
5.3 PITTSBURGH
5.3.1 Design
For 14 weeks spanning July 1998 to October 1998, police in Pittsburgh conducted evening gun patrols two nights a week in two of the city's six patrol zones (Cohen and Ludwig 2003). Compared to the interventions tested in Kansas City and Indianapolis, this project was less intensive, involving fewer officer-hours spread over larger areas. The target patrol zones (zones 1 and 5) were both approximately ten square-miles with about 55,000 and 80,000 residents, respectively. These zones had the highest crime rates in the city and each had over a dozen neighborhoods that were described as diverse in their demographic characteristics and crime problems (see Table 1).
The comparison areas were the city's four remaining patrol zones. Relative to the target zones, the comparison zones were on average less dense (6,494 versus 7,312 persons per square miles) and had a lower percentage of black residents (24.8% versus 38.8%), but they had comparable home ownership rates (47.1% versus 44.1% of residents owned their own homes) and poverty levels (23.3% versus 24.4% of residents were poor) (Cohen 2002, Exhibit 5). 26
Given the relatively short study period (6 pre-intervention weeks and 14 intervention weeks) and the large pre-intervention differences in crime between the intervention and comparison zones, regression artifacts and floor effects must be considered throughout the analyses. For example, daily gunshot injuries, one of the study's primary outcome measures, were 187% higher in the target zones than in the comparison zones prior to the intervention (.155 versus .054). This difference was due to the Wednesday to Saturday portion of the week, which is when police conducted the intervention (as discussed below). Gun injuries averaged 0.028 per day for both intervention and comparison zones on Sunday through Tuesday, but from Wednesday to Saturday the target areas averaged 0.25 per day while the comparison areas averaged 0.073 per day. Hence, even a naturally occurring reduction in injuries (i.e. a regression artifact) would have been most likely to occur in the intervention zones on the intervention days.
5.3.2 Intervention
Gun patrols were conducted in the target areas during the Wednesday to Saturday portion of each week, though the specific days varied week-to-week and between zones (see Table 2). Five additional officers working in three cars patrolled the areas between 8 p.m. and midnight on the selected evenings. The patrols emphasized traffic stops and “stop and talk” contacts, reportedly using a mix of place-based and person-based targeting. In sum, 51 patrols were implemented across the two intervention areas for a total of nearly 1,000 officer-hours, increasing the usual number of officers by 50% in zone 1 and by 25% in zone 5. In addition to making over 200 contacts and 18 arrests (most of which occurred in zone 5), the officers seized seven guns (two in zone 1 and five in zone 5). It is not clear that gun seizures increased over normal levels.
5.3.3 Main results
An evaluation of the program compared changes in calls to an emergency dispatcher reporting “shots-fired” and hospital reports of assault-related gunshot injuries in the target zones to those in the city's other patrol zones (see Table 3). Most analyses were based on daily time series data covering the six weeks prior to the intervention and the fourteen intervention weeks. This review counts the intervention in each area as a separate trial, but many of the analyses presented by the authors were based on results combined for the two target areas.
Averaged across the target zones, shots-fired calls declined 0.066 per day (9%) and gunshot injuries declined 0.048 per day (31%) during the intervention. In contrast, shots-fired calls increased by 0.053 per day (19%) and gunshot injuries rose by 0.026 per day (48%) in the other patrol zones. Changes in gunshot injuries were significantly different between the intervention and comparison areas, leading the authors to a differences-in-differences 27 estimate of 0.073 injuries prevented per day.
The investigators also conducted a differences-in-differences-in-differences (DDD) analysis based on changes in gun crime during the program nights (Wednesday to Saturday) and non-program nights (Sunday to Tuesday) between areas. 28 The authors argued that results averaged across the intervention areas suggested the patrols reduced shots-fired calls by 0.347 per day (34%, p<=.05) and gunshot injuries by 0.222 per day (71%, p<=.10) on the program days. 29 Separate DDD estimates for each target zone (see Table 3) suggest that both had significant reductions in shots-fired calls relative to the control zones, but only zone 5 experienced a significant reduction in gunshot injuries (the authors reported that the proportional decline in gunshot injuries was similar in both zones). The authors also reported that gunshot injuries increased in zone 5 after the program ended.
5.3.4 Other results
These estimates may overstate the program's impacts in a number of ways. The validity of the shots-fired measure was questionable; officers were unable to verify an incident in three out of every four calls. Moreover, a sensitivity analysis that substituted the program year data with data from the same calendar period of the year before the program (1997) also produced significant DDD estimates for shots-fired calls (the authors referred to these estimates as “phantom program effects”). This strongly suggests the estimated drop in shots-fired incidents was due at least in part to a pre-intervention trend, a seasonal pattern, or chance.
As discussed previously, regression artifacts and floor effects may have also influenced the gunshot injuries analysis. Indeed, the authors found a similar though smaller DDD “phantom” effect in Zone 5 by replacing the program year data with data from the same weeks of the year after the program (1999), during which the gun patrols were no longer in effect. 30
Geographic and temporal displacements of crime are also a concern. As noted earlier, gunshot injuries decreased by 0.048 per day in the program areas but simultaneously increased by about half that value (0.026 per day) in the comparison areas. While injuries declined by 0.161 per day during the program days in the program areas, they rose by 0.103 per day on non-program days in these same areas. Similar patterns appeared in the shots-fired analyses. Therefore, it is possible that crime was displaced from the target areas to the comparison areas and/or that crime was displaced from intervention days to non-intervention days within the target areas. The former would have increased both the DD and DDD estimates of the patrols' impact, and the latter would have increased the DDD estimates.
5.4 COLOMBIA (CALI AND BOGOTA)
5.4.1 Design
The Colombian cities of Cali (1.8 million residents in 1994) and Bogota (5.6 million residents in 1996) implemented intermittent bans on all gun carrying at different times in the 1990s (Villaveces et al. 2000). During the early 1990s, these cities had overall homicide rates comparable to those of the highest crime areas of some American cities (see Table 1); together, they accounted for less than 20% of the population and nearly a third of homicides in Colombia, which had a homicide rate over nine times higher than that of the U.S. 31
An evaluation of these programs compared homicide rates during ban and non-ban days over multiple years in each city. The investigators refer to their study design as interrupted time series with multiple replications. While the design is most appropriate when the intervention is introduced randomly rather than on a regular basis (Campbell and Stanley 1966, pp. 43-46), which was not the case in this application, the study met all criteria for inclusion in this review. Because the bans were implemented primarily at high-risk times for homicide (e.g., weekends following paydays), the researchers used statistical adjustments (described below) to compensate for pre-existing differences between the intervention and nonintervention days.
5.4.2 Intervention
The bans were implemented primarily on weekends following paydays, holidays, and election days (all of which were high-risk times for homicide) (see Table 2). However, bans were not established on all such days during the intervention periods and bans were not limited to just these days. 32 In Cali, bans were implemented on 34 occasions for a total of 89 days spanning from November 1993 through 1994. In Bogota, there were 22 bans covering a total of 67 days during the following periods: December 1995 through March 1996; December 1996 through February 1997; and March 1997 through April 1997. Cali used the bans during a period of rising homicide rates, and Bogota employed them during a period of falling homicide rates and rapid population growth.
The bans were advertised through the media and applied to all people, including those with permits to carry guns. Police enforced the bans through roadblock checkpoints (which were usually established in high-crime areas), searches during traffic and pedestrian stops, searches of patrons in bars, and other routine activities. 33 However, the study provided very little specific information about police activities. The evaluators reported that police in Cali recovered four guns per day during intervention times and 0.8 guns per day during non-intervention times. These figures seem remarkably low given Cali's size and homicide rate, perhaps suggesting that police enforcement efforts were focused on relatively small areas of the city, enforcement efforts were modest, or efforts to advertise the bans were highly effective. No further implementation data were available for either city. Hence, the contexts, types, dosages, and durations of police activities are unclear.
5.4.3 Main results
An evaluation of these programs compared homicide rates during ban and non-ban days in Cali from 1993 through 1994 and in Bogota from 1995 through August 1997 (see Table 3). As noted above, the bans were generally implemented on days when homicides were most likely to occur. Despite the bans, the unadjusted homicide rate was higher on intervention days than on non-intervention days in both cities; Cali's homicide rate was 51% higher on intervention days (161.8 versus 107.5 per 100,000 person-years) and Bogota's homicide rate was 37% higher on intervention days (81.3 versus 59.3 per 100,000 person-years). In short, police were able to identify and implement bans at times that were considerably more violent than normal.
To adjust for pre-existing differences between ban and non-ban days, the researchers stratified non-intervention days according to several temporal dimensions (such as type of day, time of day, and season) to estimate risk-adjusted, expected homicide rates for the intervention periods and compared these to homicide rates observed during intervention days. They also estimated negative binomial regression models controlling for the effects of time of week, payday weekends, holidays and election days, month of the year, and citywide time trends. Results were similar with both analytical methods.
Based on regression analyses, the authors estimated that the bans reduced homicides 13% to 14% when they were in effect. In Bogota, the authors estimated that the bans had comparable effects on gun and non-gun homicides, reducing the former by 15% and the latter by 12%. In Cali, the estimated reductions were 23% for non-gun homicides and 10% for gun homicides, though the difference in these effect sizes was not statistically significant.
5.4.4 Other results
Evidence thus suggests that non-gun homicides also decreased during the bans. There was no measurable displacement of homicides to the seven-day periods immediately following each ban, but other patterns of temporal and geographic displacement were not examined. Consequently, the study may overstate the impact of the bans, particularly since they occurred on a regular rather than random basis and were advertised through the media, giving potential offenders a clear sense of when detection risks were greatest. Further, homicides actually rose 18% in Cali from 1993 to 1994 despite the use of the bans (the investigators did not explore whether this was an improvement over prior trends).
6 Synthesis of results
6.1 KEY OUTCOMES ACROSS STUDIES
To summarize, six of the seven tests presented in these studies suggest that the police crackdowns on gun carrying reduced gun crime. The estimated effects ranged from a 10% reduction in gun homicides in the city of Cali to a 71% reduction in gunshot victimizations in selected police zones of Pittsburgh.
The Colombian studies, which were based on before and after changes from repeated interventions, estimated that crackdowns on gun carrying reduced firearm homicides 10% to 15% (based on regression estimates). Results from the two studies, which utilized the same statistical procedures and outcome measures, were statistically indistinguishable based on their confidence intervals.
Estimated effects were generally larger and more variable in the American studies, which examined before and after changes in one or more target areas relative to changes in one or more comparison areas. The most similar of the American studies were conducted in Kansas City and Indianapolis. Gun crime dropped 29% to 49% in the successful trials in those cities. The Pittsburgh study, which involved larger and more diverse areas, lower intervention dosages, different outcome measures, a shorter time series, and different statistical techniques, suggested reductions in gun crime ranging from 34% (for shots fired calls) to 71% (for gunshot injuries) averaged over two target areas. Taken together, the American studies suggest that directed patrols reduced gun crime by roughly a third or more by most measures. The major exception to this pattern was the unsuccessful effort in the Indianapolis east target area where gun crime did not decline (though by some measures, this area improved relative to the comparison area). In the American studies, gun crime generally rose or remained unchanged in the comparison areas.
Determining a standardized effect size from the American studies is problematic because the variability in the outcome measures is based on time rather than areas or people. Thus, for example, the size of a standardized mean difference calculated from these studies would vary for any given underlying effect depending on whether the time units (and hence the group sample sizes) were measured in terms of days, weeks, months, years, or some other measure of time (e.g., see Lipsey and Wilson 2001, pp. 48-50). For this reason, we did not conduct a statistical meta-analysis of the results from the American studies. 34
However, to provide an informal summary of results across all of the studies, Figure 1 presents before and after percentages changes in gun crime based on selected measures and analyses from each study. For this illustration, we attempted to focus on reasonably comparable outcome measures and on analyses that could be expressed in terms of before and after percentage changes for target areas and, if applicable, comparison areas. For the Kansas City study, we present the change in the weekly average of all gun crimes (primarily robberies and assaults with guns) for the main intervention period. The Indianapolis results in Figure 1 are based on changes in weapons violence (i.e., homicides, aggravated assaults with guns, and armed robbery) between the 90-day intervention period and the same 90-day period of the prior year. The Pittsburgh results represent changes in the daily average of assault-related gunshot injuries from the 6-week pre-intervention period to the 14-week program period, averaged for the two target areas and the four comparison areas, respectively. Note that these are not the DDD estimates from the Pittsburgh study and that they were chosen to provide measures more comparable to those from the other studies [see Cohen and Ludwig 2003, p. 235). 35 By this measure, the impact of gun patrols in the Pittsburgh target areas was substantial but smaller than that observed in Kansas City and Indianapolis north. 36 Finally, the estimates for Cali and Bogota are regression-adjusted estimates of the change in gun homicides during periods when the gun carrying bans were in effect. Based on these measures and analyses, the reductions in gun crime ranged from 10% to 15% in the Colombian studies and from 31% to 49% in the successful American trials (to maintain comparability between the estimates from the Colombian and American studies, estimates from the latter are based on pre-post changes in the target areas and have not been adjusted for increases in the comparison areas).
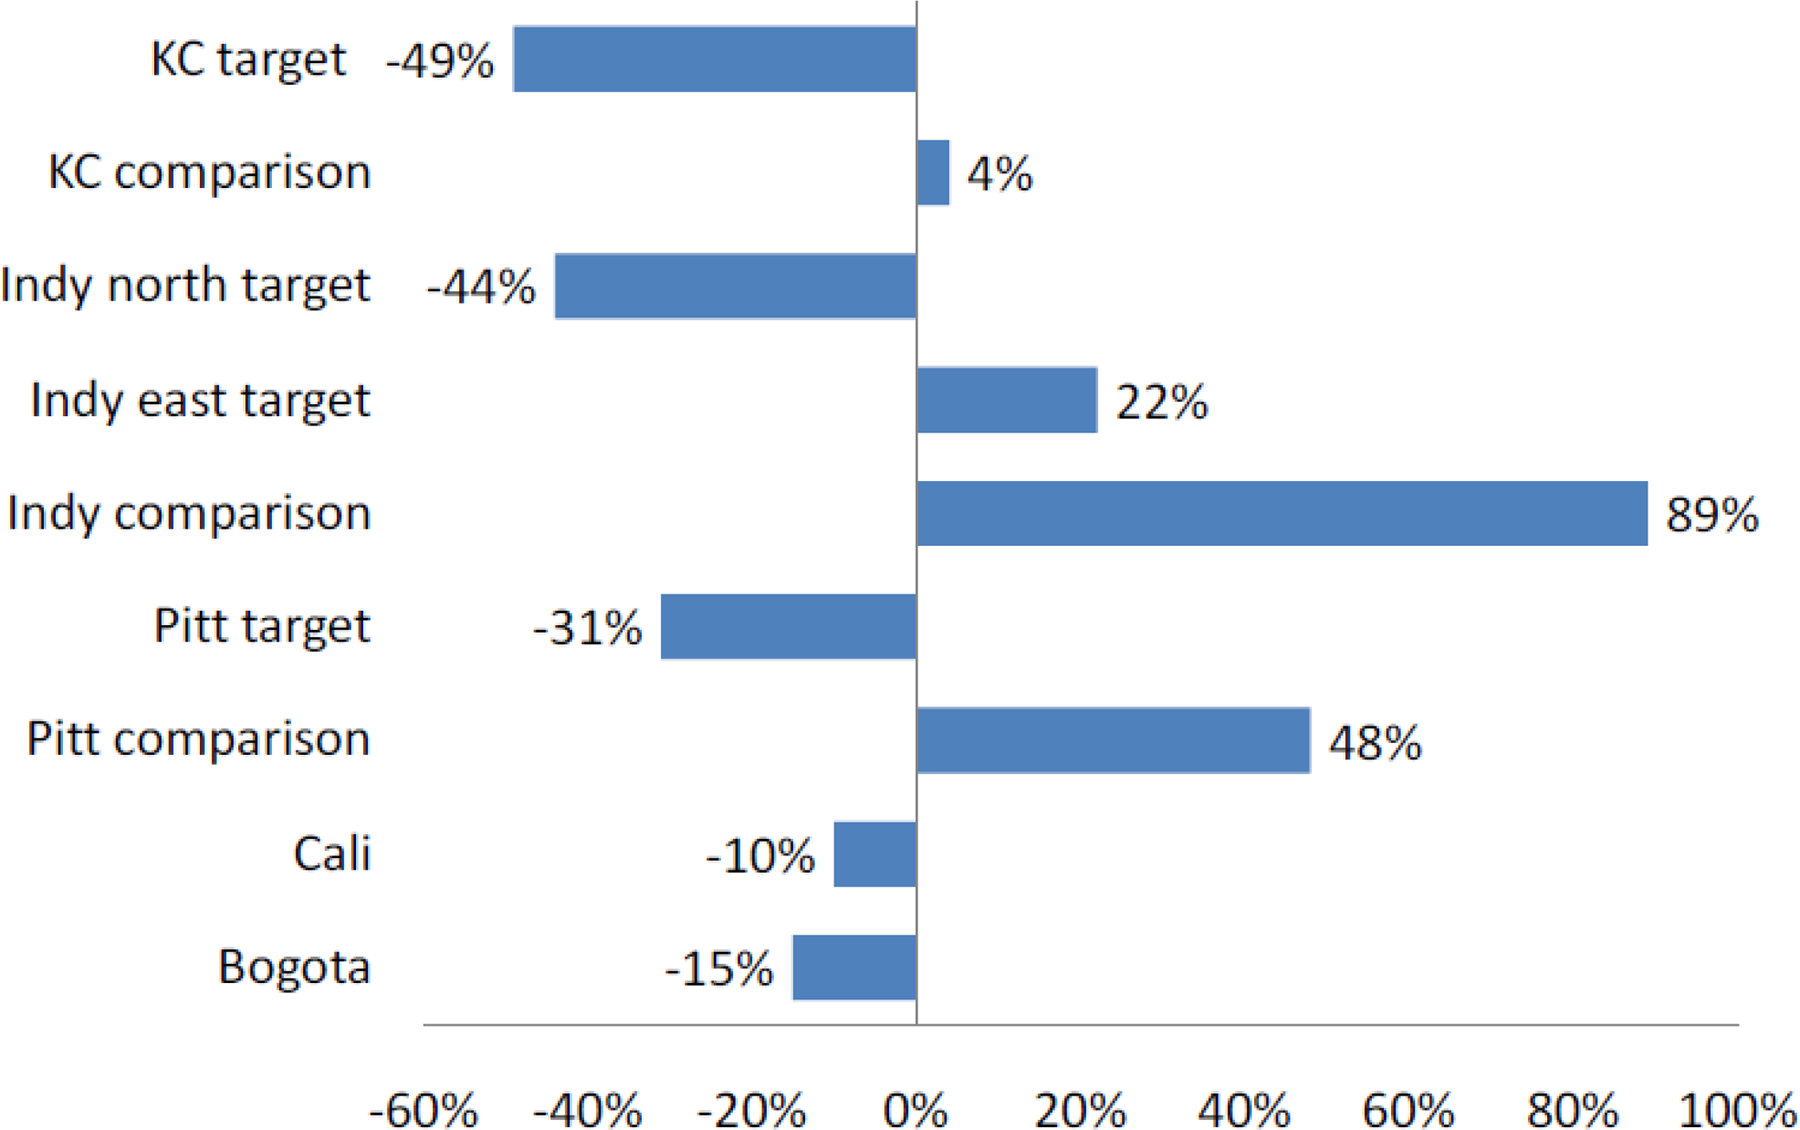
Pre-Post Changes in Gun Crime
6.2 ASSESSING DIFFERENCES IN OUTCOMES ACROSS STUDIES
Comparisons of effect sizes across the studies must be made very cautiously, as the studies differ notably in their contexts, units of analysis, intervention delivery, comparison groups, and statistical techniques to control for bias. Notwithstanding, one obvious contrast is that between the smaller effects in the Colombian studies and the larger ones in the American studies. Differences in the types of areas studied may have been one key factor explaining this divergence. The American studies were based on city patrol areas with as few as 4,500 people. The Colombian studies, in contrast, were based on entire cities with millions of residents. Police may be able to raise apprehension risks (real and perceived) more successfully in small areas like a neighborhood than in larger areas like an entire city (e.g., see Sherman and Weisburd 1995). In this regard, it is also notable that the smallest effects in the American studies were those in Pittsburgh (when focusing on before and after changes in the target area), where the target areas were considerably larger than in Kansas City and Indianapolis. However, the smaller effect sizes in the Colombian studies may also reflect the larger base rates from which they were calculated; the bans did appear to prevent substantial numbers of gun homicides—roughly 79 in Cali and 149 in Bogota (calculated from Villaveces et al. 2000, p. 1208). Other potentially important differences between the American and Colombian studies that may explain differences in their results include legal and cultural differences, differences in implementation and tactics (including the fact that the Colombian bans were implemented only on selected and publicized days), differences in weapon availability, and differences in research design, outcome measures, and statistical techniques.
Connecting effect sizes to intervention dosages and other implementation factors is difficult due to the small number of studies, the poor documentation of some efforts (particularly those in Colombia), and other differences in the types of analyses and areas involved. 37 Further, available activity measures often fail to capture potentially important differences in program delivery. In Kansas City, for example, officers reportedly spent only 27% of their time actually patrolling the target area. The remainder was spent processing arrests and “…performing other patrol-related duties, as well as in patrol work outside the target area” (Sherman and Rogan 1995).
Complementary activities also differed among the trials. These activities included the probation/parole checks in Indianapolis (it was not reported if these resulted in gun seizures), the door-to-door citizen contacts in Kansas City (these sorts of contacts have been evaluated favorably as a policing strategy in other contexts—see Sherman and Eck 2002), and the media announcements in Colombia. How these activities affected the reported results is unclear.
The most extensive and comparable of the studies are those done in Kansas City and Indianapolis, and the authors of the Indianapolis study made extensive comparisons of police effort in the Kansas City and Indianapolis target areas (McGarrell et al. 2000, 2001). Standardizing officer-hours, arrests, and gun seizures by person-weeks and square-mile-weeks, the Kansas City intervention was most intensive, followed by Indianapolis east and Indianapolis north. Yet the apparent outcomes did not correspond to this ranking, as the reported reductions in gun crimes were greatest in Kansas City and Indianapolis north. Similarly, rates of gun detection were highest in the Kansas City and Indianapolis north trials; the Kansas City officers seized one gun per 156 officer-hours, and the Indianapolis north officers seized one per 165 officer-hours. By contrast, in Indianapolis east officers seized one per 223. The authors of the Indianapolis report have suggested that the more patrols focus on high-risk places (as in Kansas City) and persons (as in Indianapolis north), the better the outcomes (McGarrell et al. 2000, 2001).
The Pittsburgh and Colombian studies have little implementation data, but that which is available suggests that dosages were considerably lower in these studies, which may help to explain their lower effect sizes. In comparison to the Kansas City and Indianapolis efforts, Pittsburgh officers were spread over much larger areas, expended fewer hours, made fewer arrests, and seized fewer guns per week. 38 The Colombian bans were in effect for only two to three days at a time on average, and data from Cali suggested a low rate of gun seizures relative to the size and violence levels of the city. However, police efforts in Pittsburgh and Colombia may have been focused on smaller places within the study areas; if so, effects may have been greater (in percentage terms) in those targeted areas.
In short, the results tentatively suggest that crackdowns on gun carrying are more effective and efficient when they are more intensive and focused on high-risk places, times, and people. While we cannot provide further precision to these results through qualitative assessment or meta-analysis, the evidence is generally consistent across studies, so there is little need to improve statistical power or reconcile conflicting results.
7 Discussion
7.1 SUMMARY AND CAVEATS
Our systematic review of research on police strategies to reduce illegal gun possession and carrying revealed four studies with before and after control group or repeated interventions designs that have examined the impact of directed patrols focused on illegal gun carrying. In total, these studies contain seven tests of crackdowns on gun carrying, though these tests were not all independent and none employed a randomized design. We did not find any eligible studies examining other strategies for reducing gun possession and carrying such as monitoring of probationers and parolees, use of weapon reporting hotlines, and use of gun detection devices.
With one exception, the included studies suggest that directed patrols focused on illegal gun carrying reduce gun violence at high-risk places and times. Inferences are limited, however, by the small number of available trials, variability in study design and analytical strategy, and the absence of randomized trials. As discussed in Sections 6.1and 6.2, we can only make very informal and tentative assessments of effect sizes across studies. Further, our narrative synthesis of the studies suggests that, despite careful efforts by the studies' authors, strong conclusions cannot be drawn due to ambiguities in the evidence and confounding factors that have received limited attention. The results of these trials are very promising, but they are more likely to overestimate than underestimate the effects of directed patrols on gun crime. Below, we highlight some key limitations to the evidence, review a number of issues that deserve further attention, and conclude by suggesting directions for future research.
7.2 METHODOLOGICAL LIMITATIONS
Results from these studies should be qualified based on the absence of randomized trials. Results of non-randomized studies often differ systematically from results of randomized trials (e.g., see Deeks et al. 2003), and non-randomized studies of criminal justice interventions in particular are more likely than randomized trials to find favorable results (Weisburd et al. 2001).
Despite the lack of randomized experiments, all of the studies employed relatively rigorous quasi-experimental designs. Each of the American studies employed a multiple interrupted time series design, which is generally regarded as one of the strongest non-randomized designs (Campbell and Stanley 1966), and the Colombian studies employed a variation of the equivalent time samples design. However, the studies had notable weaknesses in their application of these designs. In the American studies, the time series were relatively short. Only the Kansas City study had a full year of both pre-intervention and post-intervention data to control for seasonal effects, and the Pittsburgh analysis was complicated by a particularly short time series. The gun carrying bans in the Colombian studies were applied fairly regularly and predictably rather than randomly, as is optimal for an equivalent time samples design.
Comparisons between intervention and comparison groups (i.e., areas and times) in these studies are also problematic. The intervention areas were chosen for their high and often rising levels of gun crime–levels that were often substantially higher than those in the comparison areas. This makes it likely that gun crimes in the intervention areas would have fallen or followed otherwise different trends from those in the comparison areas, even in the absence of the intervention. In other words, it is unlikely that the interventions were the only important difference between the intervention and comparison conditions, thus undermining the internal validity of the studies.
7.3 EXTERNAL VALIDITY
Findings from these studies may not be widely generalizable. Outcomes included in this review are mostly from trials conducted in the United States. The results may not apply to other countries with different crime problems, gun laws, and systems of justice. Further, all of the trials were conducted in high-crime urban areas and at high-crime times. Even if directed patrols do reduce crime under those conditions, they may not reduce crime in places or at times with lower levels of crime. The long-term effects of this strategy are also unknown.
7.4 IMPLEMENTATION AND INTERMEDIATE OUTCOMES
As discussed in section 6.2, it is difficult to make generalizations about the effects of dosage and implementation from these studies. A related caveat is that the studies did not directly measure changes in gun carrying, which is the presumed mechanism through which the patrols reduced gun crime. For example, they did not examine changes in the number of gun seizures per traffic and pedestrian stop during the interventions, nor did they measure gun carrying using other methods (e.g., offender surveys). Although the inferred link between gun carrying and gun crime has a strong theoretical basis, documenting changes in gun carrying more explicitly would strengthen the evidentiary links between gun patrols, gun carrying, and gun crime.
7.5 CRIME DISPLACEMENT
The included studies did not consistently address crime displacement in its various manifestations (for an extended discussion of displacement and its varieties, see Barr and Pease 1990). The included studies provide limited evidence of crime displacement to nearby areas that was statistically insignificant and not sufficient to offset declines in the target areas. It is difficult, of course, to completely rule out displacement to areas not adjacent to the target areas because the number of crimes that may be displaced in these types of studies is typically small enough to be lost in the normal variability of crime at the city level. However, crime tends to be concentrated at places and times that bring together motivated offenders, suitable targets, and an absence of capable guardians (Cohen and Felson 1979; also see Sherman et al. 1989). To the extent that crime is displaced, therefore, it may move to areas having a similar constellation of these features. Such areas are often in close proximity.
Short-term temporal displacement (e.g., displacement to different times of day or different days of the week) was a potential if not documented problem in the Pittsburgh and Colombian studies. Displacement to crimes without firearms did not appear to occur in Indianapolis north, Cali, or Bogota (it was not addressed elsewhere).
7.6 FUTURE DIRECTIONS
Subject to the caveats we have noted, a small number of non-randomized, quasi-experiments suggest that directed patrols focused on illegal gun carrying prevent gun crimes. 39 Future studies could improve on prior research and answer some of the questions raised above by using better and more control groups, by controlling for confounding variables through randomization, and by carefully measuring variables related to context and program implementation (e.g. officer hours, pedestrian stops, gun seizures, and complementary activities such as probation/parole checks) (Mayo-Wilson 2007) and by reporting a standardized set of outcomes in order to facilitate synthesis. Multi-site randomized trials using numerous patrol beats from several cities, as Sherman (1997) has advocated, appear justified for this strategy. Barring such ambitious efforts, it might be feasible to rotate gun patrol crackdowns at random intervals across a number of high-crime areas in a single city over an extended period (Sherman 1990). Evaluators could improve evidence obtained from all trials, randomized or not, by devoting more formal attention to long-term differences in crime levels and trends between target and intervention areas and by collecting implementation and outcome measures like those used in previous studies to facilitate comparisons across studies.
Even randomized controlled trials, however, will not answer all of the outstanding questions about directed patrols. Studies of offenders (using official records and/or surveys) might tell researchers more about the characteristics of people who illegally carry weapons in gun crime hot spots, including their prior and current offending patterns, areas of residence, and dispositions, all of which could yield useful data about deterrence, incapacitation, displacement, and diffusion effects associated with gun patrols. Such information might also provide insights into how gun patrols could be better structured to reduce crime. As we have discussed elsewhere (Koper and Mayo-Wilson 2006), this strategy of attacking gun crime also raises potential concerns about legality, racial profiling, community relations, and cost effectiveness (e.g., see Gau and Brunson 2010; McGarrell et al. 2000; NRC 2004). The studies reviewed here suggest that programs of this sort can be implemented cost effectively (McGarrell et al. 2000) and without harming police-community relations (McGarrell et al. 2000; Shaw 1995), but these issues warrant continued assessment. For example, qualitative research involving community members, offenders arrested in crackdowns, and other stakeholders could be included in future studies to highlight strategies that individuals living in violent communities believe will reduce crime without harming or alienating the communities meant to benefit.
Finally, there is also a strong need for rigorous research on other police interventions to reduce illegal possession and carrying of firearms. A recent survey of U.S. police agencies serving large cities, for example, shows that the majority make regular or occasional use of several such strategies, including enhanced monitoring of probationers and parolees, weapon reporting hotlines, consent searches at the homes of high-risk juveniles, and checks on gun ownership by people under restraining orders (Koper et al. 2012). However, our review revealed no rigorous studies (and few of any sort) focusing on these strategies. 40
Police interventions are, of course, a limited response to gun violence, and they do not address many of the underlying social conditions that contribute to crime and violence. Yet there is evidence that directed patrols may help break the cycle of gun violence in troubled communities and establish the conditions necessary for long-term improvements. To use a medical analogy, one must stop the bleeding before one can heal the patient.
8 Acknowledgements
This research was supported by grant 2004-DD-BX-0003 from the National Institute of Justice (Office of Justice Programs, U.S. Department of Justice) to the University of Pennsylvania, by funding from the Campbell Collaboration and the Jerry Lee Center of Criminology (University of Pennsylvania), and by funding from the National Policing Improvement Agency (NPIA) of the United Kingdom (through subcontract to George Mason University and the Police Executive Research Forum). Points of view in this document are those of the authors and do not represent the official position of any of the aforementioned organizations. The authors thank Daniel J. Woods and Shannon McFadden for research assistance. They also thank David Wilson, David Weisburd, and external referees for the Campbell Collaboration for helpful comments on earlier versions of this manuscript.
9 Studies included in review
Cohen, J and Ludwig, J. 2003. Policing crime guns. In J Ludwig and PJ Cook (eds.), Evaluating Gun Policy: Effects on Crime and Violence (pp. 217-250). Washington, DC: Brookings Institution Press.
Also see:
Cohen, J. (2002). Effects of Police Gun Suppression Patrols on Shots Fired and Gunshot Injuries: Estimating Impacts of Naturally Occurring Interventions. Draft paper presented to the conference on Evaluating Policies to Reduce Gun Violence: The Effects of Regulation and Enforcement. Washington, DC: Brookings Institution.
McGarrell, EF, Chermak, S, and Weiss, A. (2000). Reducing Firearms Violence Through Directed Patrol: Final Report on the Evaluation of the Indianapolis Police Department's Directed Patrol Project. Report to the National Institute of Justice, US Department of Justice. Indianapolis: Crime Control Policy Center, Hudson Institute.
Also see:
Chermak, S, Weiss, A, and Wilson, J. (2001). Reducing firearms violence through directed police patrol. Criminology and Public Policy 1:119-148.
McGarrell EF, Chermak, S, and Weiss, A. (2002). Reducing Gun Violence: Evaluation of the Indianapolis Police Department's Directed Patrol Project. NCJ-188740. Washington, DC: National Institute of Justice, United States Department of Justice.
Sherman, LW and Rogan, DP. (1995). Effects of gun seizures on gun violence: “Hot spots” patrol in Kansas City. Justice Quarterly 12:673-693.
Also see:
Sherman, LW, Shaw, JW, and Rogan, DP. (1995). The Kansas City Gun Experiment. NCJ-150855. Washington, DC: National Institute of Justice, United States Department of Justice.
Villaveces, A., Cummings, P., Espitia, VE, Koepsell, TD, McKnight, B, and Kellerman, AL. (2000). Effect of a ban on carrying firearms on homicide rates in 2 Colombian cities. JAMA 283:1205-1209.
Footnotes
2
A related intervention is the installation of metal detectors in places like airports, schools, and government buildings. Although the use of metal detectors is intended to discourage weapon carrying, it is arguably a form of target-hardening with limited applicability to general police work, particularly the reduction of street crime. Consequently, the review does not include studies of fixed metal detectors.
3
And government buildings. Although the use of metal detectors is intended to discourage weapon carrying, it is arguably a form of target-hardening with limited applicability to general police work, particularly the reduction of street crime. Consequently, the review does not include studies of fixed metal detectors.
3
For instance, the review does not include evaluations of the U.S. government's Project Safe Neighborhoods program or other similar programs in the United States (such as Project Exile) that have emphasized federal prosecution as a means to enhance penalties for gun offenders (McGarrell et al. 2009; Raphael and Ludwig 2003; Rosenfeld et al. 2005). Other examples include studies of the Bartley-Fox gun carrying law that raised penalties for illegal gun carrying in Massachusetts in the mid-1970s (Deutsch and Alt 1977; Pierce and Bowers 1981) and studies of gun courts (Gendreau and Surridge 1978;  ).
).
4
Statistical controls could include multivariate regressions controlling for factors related to crime (e.g., demographic and other socioeconomic characteristics of the areas) or other methods adjusting for different crime levels and trends in the intervention and comparison areas.
5
Studies that examined “weapons” or “armed” offenses without separate consideration of gun offenses were not included in the review since it is conceivable that a police intervention could reduce non-gun weapon offenses without reducing gun offenses.
6
For Criminal Justice Periodicals, it was also necessary to add terms such as “evaluation”, “study”, and “experiment” to screen out thousands of hits that were not evaluation studies. In conjunction with another project involving one of the authors (Lum et al. 2011), we also searched all but one of these databases (Educational Resources Information Clearinghouse) from 2000 through 2009 for any experimental or quasi-experimental studies looking at the impact of police on crime. This was done by searching for entries with terms for both policing and evaluation (e.g., evaluation and experiment). This second set of searches yielded no additional eligible studies, thus providing some external validation for the first set of searches. The authors thank Cynthia Lum and Cody Telep of George Mason University for assistance with the second set of searches
7
Examples of excluded studies include: a non-experimental, correlational study of weapons arrests and gun homicides in New York City (Fagan and Davies 2003); a study describing national trends in homicides and arrests for possession and carrying of weapons in the United States (Sherman 2000); a process evaluation that described a St. Louis program to search the homes of juveniles suspected of having firearms (Decker and Rosenfeld 2004); a study of probationer surveillance and shootings in Wilmington, Delaware that did not have a comparison group/area (Delaware Statistical Analysis Center 1998); a study of crackdowns on gang crime hot spots in Detroit that also included non-eligible program components (Bynum and Varano 2003); and a series of studies on gun suppression efforts conducted through the Youth Firearms Violence Initiative, a program conducted in a number of U.S. cities, that did not have appropriate or adequately defined comparison areas (some had other features also contributing to ineligibility) (Bynum et al. 1998; Conly et al. 1998; Cordner et al. 1998; Decker et al. 1998; also see ).
9
10
This is thought to occur by raising offenders' real and perceived risks of apprehension.
11
In many countries, police cannot stop vehicles and pedestrians on an arbitrary basis. In the United States, police can stop vehicles and persons when they observe traffic violations or other suspicious activities. Once this occurs, police may find other evidence that justifies a search: they may see guns or other contraband in plain view, find that the stopped person(s) is wanted for other crimes, or observe other signs (e.g., a motorist trying to hide something under the seat) that justify a search of the car and/or a frisk of the individual(s). In some cases, stopped motorists may consent to having their cars searched if asked by police.
12
In Kansas City, the intervention occurred twice in the same area. As discussed below, however, the second intervention was not reported in sufficient detail to be counted as a separate test for this review.
13
The times series estimate of 2.6 fewer gun crimes per week suggests a reduction of 44% relative to the trend-adjusted, pre-intervention level of 5.8 gun crimes per week (, p.686). This is similar to the unadjusted drop of 49% between the 29-week pre and post-intervention periods. Likewise, the time series estimates imply that the patrols prevented about 74 gun crimes during the 29-week intervention period, which is comparable to the unadjusted drop of 83 gun crimes.
14
The change in drive-by shootings in the target area approached statistical significant (p<.1), while the change in homicides was significant (p<.05). Exact numbers were not reported, but a graphic illustration shown in , p. 688) suggests there were roughly seven to 15 drive-by shootings semiannually when the gun patrols were not in operation and roughly two when the patrols were operating. The only reported figures for homicide indicate that the target area had four homicides semiannually during 1991.
15
For this review, we concentrate on gun crime as the outcome of interest and do not review the attitudinal survey results in detail. The survey did not include measures of gun crime victimization.
16
No further details were provided on the specifics of the patrols, such as the number of officers and cars involved or the times of day when the patrols took place.
17
For most analyses, the evaluators contrasted the intervention period with the same 90-day period from the prior year rather than the 90 days just prior to the intervention in order to control for possible seasonal effects. Total gun seizures rose only modestly in the north/targeted offender area in part because routine gun seizures by patrol officers declined during the intervention period.
18
The investigators did not explicitly define the category of all gun crimes, so it is not clear if they included property offenses committed with a gun, as did the investigators in Kansas City.
19
The investigators also compared changes in the target areas to those in the rest of the city. This review generally focuses on results for the two-beat comparison area since it represents a unit more comparable to the target areas. It also focuses on the separate results for each intervention area rather than results combined across the intervention areas.
20
Results were very similar whether defining the post-intervention period as the 13 intervention weeks or as the 13 intervention weeks plus the 13 weeks after the patrols ended. Time series estimates for the north/targeted activities area suggest that the patrols prevented 22 to 25 violent gun crimes during the 13-week intervention period. This reduction cannot be expressed as a percentage because the authors did not present pre-intervention means for the full period covered by the time series analyses. However, there were 6 homicides, gun assaults, and armed robberies per week in the north/targeted activities area during the 90-day pre-intervention period defined earlier. Using this as an approximate baseline, the time series results imply that the patrols reduced weapons violence in this area by 29% to 32%. By comparison, the unadjusted drop in these crimes between the 90-day pre- and post-intervention periods was 34, or 44%.
21
Considering that violent crime had been rising for at least two years in the north area, there is perhaps some lingering concern about a regression artifact in that area. The time series analyses mitigate that problem for the study period (1995 through early 1998), though it is hard to completely rule out the possibility of a regression phenomenon over a longer period without additional data.
22
A comparison of the intervention period to the 90 days just prior to the intervention showed that gun crime declined in the east area while rising in the comparison area. A very similar directed patrols initiative that did not emphasize guns to the same degree took place in the east area for two months in late 1995 and was subsequently maintained at a lower level. The investigators found no indication that the effects of this earlier intervention lasted beyond late 1995.
23
Reductions in total aggravated assaults and robberies were smaller than those observed for gun assaults and armed robberies and were not clearly significant relative to changes in the comparison area (based on changes from the same 90-day period of the prior year). Further breakdowns show that the total number of assaults and robberies without guns in the north area remained the same (64) across the two periods (calculated from McGarrell et al. 2000, Tables 3-8 and -11). Also, burglaries rose by 20% in both target areas while declining 2% in the comparison area.
24
Separate analyses of each adjacent beat reportedly provided very little evidence of increases or decreases in total homicides, aggravated assaults, robberies, burglaries, or vehicle thefts.
25
For this review, we concentrate on gun crime as the outcome of interest and do not review the attitudinal survey results in detail. The survey did not include measures of gun crime victimization. However, one survey item suggested that the perception of shootings as a “major” problem went down in the intervention areas and increased in the comparison area (these changes were not statistically significant) (see , Table 4-6).
26
A sensitivity analysis suggested that differences were more pronounced between the target areas and the three comparison areas that did not include the patrol zone encompassing the central business district.
27
Estimates are calculated by subtracting the change in the comparison areas from the changes in the intervention area.
28
Comparing changes during the program and non-program nights in the intervention zones avoids the potentially confounding effect of differences between the intervention and comparison areas. Examining the same changes in the comparison areas controls for the possibility that the program and non-program days followed different trends throughout the city.
29
Each estimated percentage decline is based on the estimate of crimes prevented divided by the sum of observed crimes and crimes prevented.
30
Another supplemental analysis suggested that accidental gunshot injuries declined in the target areas during the intervention period. This could also signify that the estimated program impact on assault-related injuries was due in part to more general causes insofar as a link between gun patrols and accidental gun injuries is less intuitive than one between gun patrols and criminal gunshot injuries (the investigators also felt that the drop in accidental injuries was unrelated to the program).
31
In 1994, Cali's homicide rate was 124 per 100,000, while Bogota's was 68 per 100,000. By way of comparison, the homicide rates in the Indianapolis north and east target areas in 1996 were 90 and 50 per 100,000, respectively.
32
These deviations were not documented explicitly in the evaluation report.
33
Some of the methods used are not legal in all countries, so inferences should be made cautiously.
34
35
We did not use the results for shots fired calls due to the validity problems reported with that measure.
36
Note that the average before and after change that occurred in the Pittsburgh intervention areas during the portion of the week when the gun patrols were conducted (i.e., Wednesday to Saturday) was 64% as opposed to the 31% change, shown in Figure 1, that is based on all days of the week (calculated from , pp. 235). We focus on the latter, nonetheless, because it minimizes the potential impact of temporal displacement.
37
The latter could include differences in various social characteristics across settings as well as differences in the types of penalties faced by violators.
38
39
40
Although there have been a number of studies examining strategies to reduce gun crime by targeting high-risk probationers and parolees, they have generally featured threats of federal prosecution and offers of social services as key means to reduce gun crime among these groups (e.g., Braga et al. 2001; Chermak 2006; McGarrell et al. 2006; ), which made them ineligible for this review. Other research with probationers and parolees has not been sufficiently rigorous to meet the methodological requirements for this review.