






Abstract
This Campbell systematic review assesses the effects of business support services in low- and middle-income countries on firm performance and economic development. The review summarizes findings from 40 studies.
Included studies examine interventions targeted at SMEs (two to 250 employees) involving tax simplification, exports and access to external markets; support for innovation policies; support to local production systems; training and technical assistance, and SME financing and credit guarantee programmes.
Findings from 40 studies are summarised in the review. These studies present evidence from 18 low- and middle-income countries, with 26 studies analysing programmes in Latin America, six from Asia and five from Africa.
On average, business support to SMEs improves their performance, their ability to create jobs, their labour productivity and their ability to invest. The effects on innovation are unclear.
Matching grants, technical assistance and tax simplification programmes improve firms' performance and job creation; with technical assistance also improving labour productivity. Export promotion and innovation programmes positively affect exports and innovation, but there is no evidence that they improve performance or job creation.
However, the effects of the programmes studied are not very large. Most studies do not include the required data to assess if the programmes are cost effective.
Plain language summary
BUSINESS SUPPORT SERVICES TO SMALL AND MEDIUM ENTERPRISES SEEM TO IMPROVE FIRM PERFORMANCE
The Campbell review in brief
Support to small and medium enterprises (SMEs) can improve their revenue and profits, their ability to create jobs, labour productivity and their ability to invest. But these effects are not large, and the cost effectiveness of the interventions not known. The effects on innovation are unclear.
What is this review about?
Large amounts of funding are going towards programmes to support small and medium enterprises (SMEs) in low- and middle-income countries in order to increase revenue and profits, generate employment, and, so, create economic growth and reduce poverty.
The Campbell review summarizes evidence of the impact of these programmes on measures of SME performance including revenues, profits, and productivity, as well as the firms' ability to generate employment and their labour productivity.
What are the main findings of this review?
What studies are included?
Included studies examine interventions targeted at SMEs (two to 250 employees) involving tax simplification, exports and access to external markets; support for innovation policies; support to local production systems; training and technical assistance, and SME financing and credit guarantee programmes.
This Campbell systematic review assesses the effects of business support services in low- and middle-income countries on firm performance and economic development. The review summarizes findings from 40 studies.
Findings from 40 studies are summarised in the review. These studies present evidence from 18 low- and middle-income countries, with 26 studies analysing programmes in Latin America, six from Asia and five from Africa.
Do business support services work?
On average, business support to SMEs improves their performance, their ability to create jobs, their labour productivity and their ability to invest. The effects on innovation are unclear.
Matching grants, technical assistance and tax simplification programmes improve firms' performance and job creation; with technical assistance also improving labour productivity. Export promotion and innovation programmes positively affect exports and innovation, but there is no evidence that they improve performance or job creation.
However, the effects of the programmes studied are not very large. Most studies do not include the required data to assess if the programmes are cost effective.
What do the results mean?
Overall SME support has a positive impact on various measures of firm performance, but with some caveats. Results for all the interventions studied could not be provided due to a lack of evidence. And the evidence available was mainly about programmes in Latin American countries. There is a likelihood of bias in many studies. Most did not report programme implementation costs, so it is not possible to weigh costs against benefits. Research on these programmes in sub-Saharan Africa in particular should be prioritised, as this would contribute to the understanding of the role that support to small businesses may play in development processes there.
Abstract
BACKGROUND AND OBJECTIVES OF THE REVIEW
Business support interventions in low and middle-income countries (LMICs) direct a large amount of resources to SMEs, with the assumption that institutional constraints impede small and medium-sized enterprises (SMEs) from generating profits and employment at the firm level, which in turn is thought to impede economic growth and poverty reduction. Yet despite this abundance of resources, very little is known about the impact of such interventions. To address this gap, this systematic review analyses evaluations of SME support services in LMICs to help inform policy debates pertaining to SMEs and business support services.
This review examines the available evidence on the effects of SME support services in LMICs on firm-level performance indicators (such as revenues, profits, and productivity), employment generation, and labour productivity.
METHODS
We systematically searched for available literature. To identify relevant papers for this review, we conducted electronic searches on key platforms; snowball sampling of references from relevant papers and book chapters, and suggestions from recognized experts in the field. We focused on LMICs as defined by the World Bank classifications, and on evidence published since the year 2000, so as to include more sophisticated evaluation techniques. The references retrieved for this review are up-to-date as of December 2014.
We included studies that evaluated the effectiveness of business support services on firm level outcomes of SMEs in low- and middle-income countries. We defined SMEs as firms with between two and 250 employees, but also included studies that used annual revenue to classify firms as SMEs instead of employee count. We examined interventions involving tax simplification, exports and access to external markets; support for innovation policies; support to local production systems; training and technical assistance, and SME financing and credit guarantee programmes. We looked at studies documenting the impact of any business support service on SMEs when compared with business as usual. We included studies that report at least one final outcome of interest (such as higher profits, employment generation, and productivity).
We incorporated studies that use experimental and quasi-experimental methods, and other studies purporting to control for selection bias and endogeneity in selection into the programme.
The search results were screened by two review researchers, and the included studies were similarly coded by two researchers. This double-review process was designed to make the selection procedure and coding more rigorous and to screen for mistakes.
We coded the data according to the impacts and characteristics of the studies selected. Standardised mean difference was used to code continuous variable outcomes and risk ratios to code binary variables outcomes. Effect sizes were synthesised and summarised to one effect size per outcome per study. Given the heterogeneity of true effects, we used analyses of random effects models to estimate overall average standardised effects. Moderator analysis was conducted with four additional variables.
RESULTS
The initial search returned 9,475 studies, which after dropping duplicates and applying the selection criteria were reduced to a final sample of 40 studies. These consisted of 37 papers (23 peer reviewed and 20 working papers), and 6 book chapters. All were produced between 2003 and 2014. Four of these studies could not be included in the meta-analysis as incomplete information prevented us from computing standardised measures. The review reports 242 effect sizes (ES), and the meta-analysis is based on 72 ES; 64 continuous and eight binary outcomes.
Overall, our findings indicate that: Business support to SMEs improves firms' performance (average ES of 0.13 standard deviations (SD) and confidence interval (CI) (0.06, 0.20)), helps create jobs (average ES of 0.15 SD and CI (0.08, 0.22)), has a positive effect on labour productivity (average ES of 0.11 SD and CI (0.08, 0.15)), on exports (average ES of 0.04 and CI (0.01, 0.06)) and on firms' investment (average ES of 0.13 SD and CI (0.02, 0.24)). Evidence on their effects on innovation by SMEs is less clear (average ES of 0.05 SD and CI (-0.01, 0.12).
When the analysis is disaggregated by type of intervention, we find that matching grants continue to show a positive impact on firms' performance and employment of similar magnitude and precision once we exclude some outliers. Excluding the outliers, the average ES for these two outcomes are 0.15 SD (with CI (0.08, 0.22)) and 0.14 SD (with CI (0.03, 0.24)) respectively. Even though they are based on only few studies, results from meta-regression indicate that technical assistance programmes have some positive effects on firms' performance, jobs creation and labour productivity, whereas tax simplification programmes seem to improve firm performance and generate jobs. Export promotion and innovation programmes seem to positively affect exports and innovation respectively, but do not seem to have an effect firm performance and employment creation outcomes. The average ES are extremely low and very imprecisely estimated.
IMPLICATIONS FOR POLICY AND RESEARCH
Our findings suggest that, overall, SME support has a positive impact on firm performance indicators. The results of our review should not be interpreted as clear evidence of SME support effectiveness, however, as the meta-analysis was unable to provide results for all types of interventions or for specific countries. There was also significant risk of bias in many studies. Most of the studies found relate to Latin America, and thus cannot be interpreted as being applicable to other regions, including Africa. We recommend further analysis of cost-effectiveness, as most studies do not indicate the cost of implementation.
There remains a paucity of rigorous evaluation studies on SME support programmes in Africa, and Sub-Saharan Africa in particular. Therefore, the generation of more evidence for the African context is paramount to the improved understanding of the role SME support programmes might play in the development process.
Linked article:
1 Background
1.1 THE PROBLEM, CONDITION, OR ISSUE
Small and medium enterprises (SMEs)—defined in this review as businesses with up to 250 employees—are believed to be important contributors to economic growth and a tool to reduce poverty in developing countries. 1 They are responsible for the majority of employment generation in developed as well as in developing countries (Ayyagari et al., 2007). SMEs also play an important role in the formal labour force. Consequently, they play a central role in employment generation policies and economic growth strategies. Ayagari et al. (2007) show that formal SMEs are responsible for most of the private-sector-related employment in developed countries. For instance, SMEs are responsible for around 60 to 70 per cent of employment generation in Germany, Finland, Belgium, and Canada. However, in African countries SMEs are responsible for a smaller share of formal employment generation. For instance, SMEs provide about 20 per cent of employment in Nigeria, Côte d'Ivoire, and Cameroon. The literature also suggests that the SME sector's contribution to employment shows a strong positive correlation with GDP per capita; thus increasing this sector's contribution to employment may generate growth (Ayyagari et al., 2007; Beck et al., 2005). As a result of the above, it is perhaps reasonable to suggest that effective business support services may positively affect GDP per capita. It is important to note that African economies have a lower percentage of formal workers in SMEs due to the fact that these economies have a larger (although less productive) informal sector. The SME sector, through its ability to generate employment, may thus play an important role in the path towards a more formal labour market.
SMEs can further be linked to economic growth through their ability to link knowledge, product commercialisation and total factor productivity (Acs et al., 2009; Solow, 2007). A seminal study using a cross-section of countries to analyse SMEs and economic growth was provided by Beck et al. (2005), who found a positive but not causal relationship between them. An exploration of other available empirical evidence however, shows that while studies that focus on developed nations suggest a positive impact of SMEs and entrepreneurship on economic growth, studies examining developing countries suggest a negative impact (for example, Audretsch and Keilbach, 2004; Mueller, 2007; Cravo 2010; Cravo et al., 2012; Cravo et al., 2014). 2 Acs et al. (2008) have attributed these differences in empirical results to different entrepreneurship responses to institutional arrangements). Moreover, heterogeneity in institutional arrangements is likely to provide different incentives to rent-seeking activities (Baumol, 1990). Thus, the role of SMEs in a given economy can be expected to vary depending on the institutional setting and level of development.
Development agencies provide a considerable amount of targeted assistance to SMEs in low- and middle-income country economies (Beck et al., 2006). For instance, the World Bank devoted US$9.8 billion to SME projects during the period 2006-12 (IEG, 2013). For the same period, the support of the International Finance Corporation (IFC) of the World Bank Group directed to SMEs amounted to US $25 billion.
In the literature, there is limited evidence on the impact of SME support, due to either an insufficient number of studies employing convincing identification strategies to isolate the causal impact of the intervention under consideration, or to there being limited information regarding the mechanisms underlying such interventions. This systematic review draws on economic theory to uncover the channels through which a particular intervention can affect the outcomes of interest (such as firms' performance, employment creation, labour productivity and innovation). We therefore separate reported outcomes into two categories wherever possible, these being intermediate and final, in order to uncover the trajectory of change for each intervention.
1.2 THE INTERVENTION
In developing countries, business support interventions are often based on the assumption that institutional constraints (or failures) impede SMEs from reaching their full potential to generate jobs, profits, economic growth, and poverty alleviation. Thus, the large amount of financial resources allocated to the development of a SME sector by governments and development organisations is designed to address institutional constraints and allow SMEs to operate more efficiently, thus leading to productivity growth (Beck et al., 2005). 3
Various approaches are used to provide support services to SMEs. We have identified the main approaches to SME support as programmes relating to the following: formalisation and the business environment, volume exported (intensive margin), value chains and clusters, training and technical assistance, and finally, SME financing and innovation policy.
This literature can be divided into two distinct themes. The first considers indirect support that addresses the constraints that prevent SMEs from accessing credit, whereas the second addresses the impact of direct business support to SMEs. In the first strand, many studies look at the impact of an indirect type of public support aimed at SMEs, such as tax simplification, which is intended to provide incentives for informal SMEs to formalise. The underlying assumption is that formal firms are less credit-constrained than their informal counterparts and therefore formalisation is an effective way of helping entrepreneurs. Formalised firms are expected (assumed) to have higher economies of scale and consequently be more productive, demand a more skilled labour force, and have higher profits over informal firms. If informal firms are prevented from growing due to credit constraints, then reducing the cost of formalisation should, in theory, indirectly give informal firms an opportunity to escape the informality-low-productivity trap. Such interventions are an indirect form of public support, as they target all firms with annual revenues below some threshold. Moreover, all informal firms are incentivised to formalise through tax simplification. Those that formalise do not directly receive other forms of public support 4 .
The second group of studies addresses the impact of direct business support to SMEs. These generally estimate the impact of a support programme to SMEs within a specific sector in a given country, with the intervention based on the assumption that SMEs face specific constraints (for instance, a limited pool of skilled labour, limited innovation capability, and/or coordination failures). In this view, SMEs need public support to break through specific constraints, and in turn improve their prospects for investment and productivity. A successful intervention may even generate spill-over effects on firms that do not belong to the target group of the programme. These may include firms in other sectors and/or informal firms in the same sector. This kind of support comes in the form of training programmes, support for innovation or value chain and association strategies (for example, clusters), which are intended to address coordination failures. Notice that, unlike the indirect public support programmes, the unit of intervention is the firm itself. Firms are directly targeted with programmes that aim to help them shift from a low equilibrium (small size and scale) to a high equilibrium (bigger scale and dynamism).
As McKenzie (2009) notes, there is a need for more rigorous evaluation of business training policies and related interventions, particularly with respect to unintended and unconventional outcomes. Of course, SME institutional environments are not homogeneous; according to McKenzie (2011), for instance, across Africa policies that aim to support productivity and growth must consider that the number of SMEs is relatively small (and that most firms have just one or two employees) and that there is considerable heterogeneity in their performance.
1.3 HOW THE INTERVENTION MIGHT WORK
Since this review investigated the impact of a diverse array of interventions, presenting a general theory of change was challenging. That said, we do provide a theory of change based on our preliminary search of the literature, yet we do so with the caveat that each type of intervention is based on particular assumptions of an intervention-outcome causal relationship. Therefore our approach to building out this theory of change has involved taking a case-by-case perspective on the assumptions regarding the causal chain of each of the programmes analysed.
However, and as mentioned in Section 1.2, support to SMEs is generally related to the dual goals of productivity growth and employment generation. A general theory of change motivating SME support services is thus linked to the improvement or creation of institutions that allow SMEs to reach their full potential with regards to growth and employment. Figure 1 below provides a more general illustration of a theory of change for the intervention models surveyed in this review.
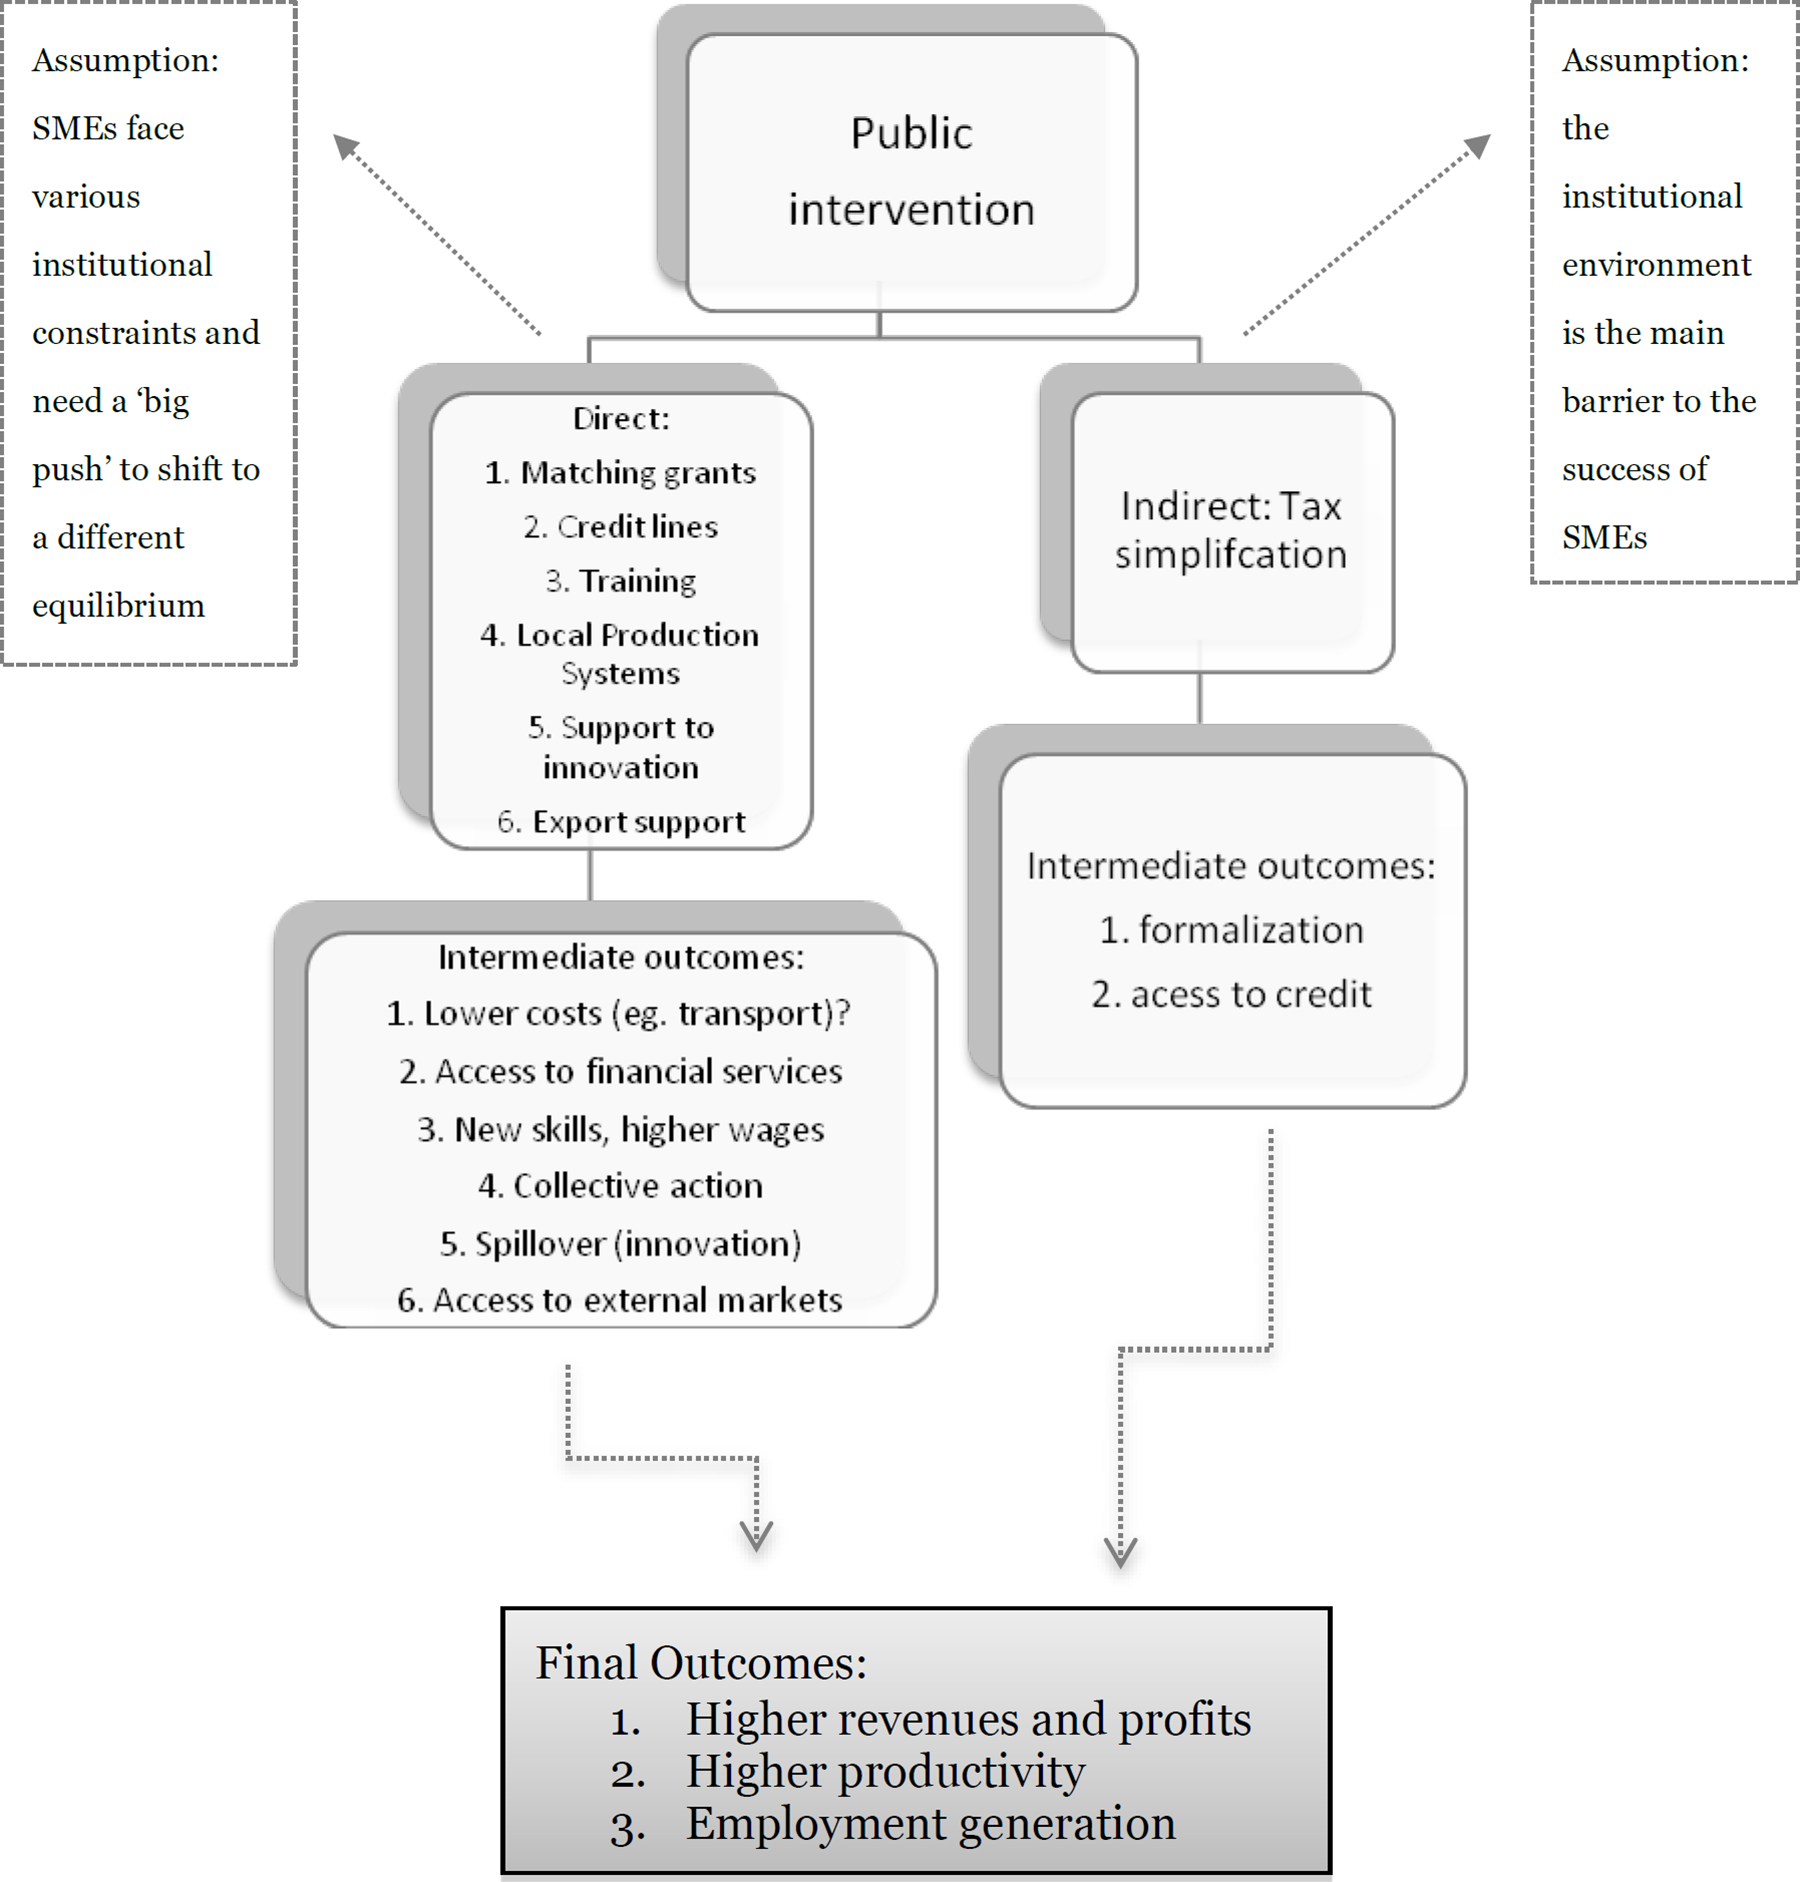
Theory of change
The following paragraphs discuss each channel of intervention shown in Figure 1. Matching grants. According to McKenzie (2011) this is the most widespread intervention in African countries. These programmes consist of a government subsidy with the government reimbursing those costs firms incur with regards to training, marketing, and/or attending a trade fair. This programme is justified on the grounds that these investments have positive externalities, and that on their own firms are likely to invest less than the optimal level (McKenzie, 2011). Credit lines. SME financing programmes are popular and are intended to tackle adverse selection and moral hazard in credit markets, problems that result in financial constraints and limits to SME activities (e.g. Aivazian and Santor, 2008). The availability of credit is thought to allow firms to invest and hire new employees and productive assets. These investments are likely to lead to productivity growth. Training and management programmes. These programmes are provided in the context of LMICs, and are based on the idea that market failures that limit firm growth are related to the lack of skills among the workforce. Thus, skills acquired in specific training programmes should contribute to worker employability and wages, but also to firm productivity (for example, through the adoption of more efficient management practices).
5
Interventions that support local production systems (LPS). These are based on the idea that individual firms benefit from agglomeration externalities and coordination (for example, Schmitz, 1995). For instance, consider a project in a region specialised in a given sector providing incentives for firms to act collectively (such as training, joint purchases, or joint certifications). Economic theory suggests that formal firms might act together to capture collective externalities, experience mutual growth, and impact local economic performance. A successful project that allows firms to benefit from positive externalities generated by collective actions would affect outcomes such as employment and regional growth through: 1) the establishment of collective agreements, and 2) specific outputs from collective action. The resulting causal chain is as follows: firms will organise around a common goal, enabling them to capture positive externalities from collective actions. Collective actions are expected to generate intermediate outputs that allow firms to achieve higher levels of productivity and employment, and in turn positively impact regional economic performance. Interventions related to agglomeration economies also relate to value chains, networks or clusters
6
. Support for innovation policies. These involve funding for improving processes (Lagace and Bourgault, 2003), and are intended to capture externalities stemming from an innovation. Innovation programmes aimed at SMEs might support innovation transfer, R&D programmes, and certifications related to innovations (for example, process innovation and/or product differentiation). The rationale is that innovation will impact the productivity and growth of the firm, which in aggregate contributes positively to regional and national growth. Public intervention supporting access to external markets. Such interventions seek to tackle information asymmetries that prevent firms from accessing external markets, and involve the provision of training, courses, and counselling. The identification and adaptation to external markets generates exports that may lead to increases in production, which in turn are thought to impact firm profit and employment creation. Tax simplification. These initiatives are a form of indirect business support to SMEs, and are aimed at improving firm performance through the channel of formalisation. Economic theory suggests that formal firms will be able to grow by accessing credit markets and by taking advantage of economies of scale. A tax simplification programme could affect outcomes such as employment and profit through two intermediate outcomes: a) formalisation rate, and b) access to credit. The causal chain could be simplified as following: the necessary conditions for a tax simplification programme shifts informal entrepreneurs from an equilibrium characterised by low productivity and profits, to another where they face fewer constraints to growth (as a result of formalization). Plenty of studies concentrate only on final outcomes, and thus shed little light on the mechanisms associated with tax simplification/formalization (and consequently offer little policy guidance). The underlying assumption is that formal firms are less credit-constrained than their informal counterparts, and therefore formalisation is an effective way to help entrepreneurs. Indirect support to SMEs may include policies regarding business registration, property registration and regulatory frameworks (Fajnzylber et al., 2011; Monteiro and Assungao, 2012; McKenzie, 2013).
1.4 WHY THE REVIEW IS IMPORTANT
Given the amount of resources and attention governments, development agencies and organisations around the world dedicate towards SMEs to spur firm performance, innovation, productivity, exports, and employment generation, this review has high policy relevance. In addition to the diverse array of policy goals tied to the support of SMEs, a number of broader impacts on society and economy are seen as by-products of support interventions, including higher wages and poverty reduction (Beck et al., 2006).
Yet despite their worldwide prevalence, too little is known about the impact of SME support interventions. In a recent survey on SME policies in African countries, McKenzie (2011) shows that African firms are generally small (with up to 10 employees), but very heterogeneous in terms of employment, sales, and access to external markets. Moreover, McKenzie (2011) notes that that although SMEs are supported in several ways across Africa, rigorous evaluation of such policies and their associated interventions is scant. Further, Bruhn and McKenzie (2013) show that despite interventions to promote registration and formalization, a majority of SMEs remain informal. These results are surprising, given that the SME sector is one of the main targets of international and national aid agencies (Cravo et al., 2014). This research fills part of this gap through a systematic summarizing of all available rigorous evaluations of SME support services, and communicating their results to policymakers working on SME-related issues worldwide. The report considers as rigorous evaluations the studies that used experimental and quasi-experimental approaches.
The policy relevance of this review is further enhanced by a focus on Africa-relevant evidence, which should be of particular interest to policymakers and donor organisations. Among the Africa-specific issues we examine the question of SMEs' potentially limited contribution to employment in African countries relative to other regions, and, in contrast, their potentially greater contribution for poverty reduction.
The literature evaluating on the impact of indirect business support services has been receiving growing attention in recent years. Studies analysing the effect of a tax simplification programme on formalisation and firms' performance are particularly interesting as they are closely related to the development of the institutional setting related to the private sector.
In the context of low- and middle-income countries, a considerable amount of evidence is available for different types of direct support to SMEs, especially in Latin America. For instance, the effect of value chain support, process and innovation support, credit programmes and training programmes are some examples of direct support to SMEs. This review contributes to provide an account on the effect of different types of direct support on firms' performance. Also, it assesses the effect of indirect support to SMEs in the form of tax simplification interventions. Such evidence might be very useful to design more effective support for SMEs.
Though most of the papers cited above indicate a positive effect for SME support programmes on selected outcomes, there is a need to systematically review and synthesise the evidence to provide an unbiased account of the impact of these programmes on firm performance. As the evidence appears to be predominantly from Latin America, its applicability to African countries, or any other context for that matter, is not straightforward. This is due to lack of external validity associated with these studies. A comprehensive understanding of the mechanisms underlying the causal chain of an SME intervention is therefore crucial if one is interested in designing SME interventions for different contexts. Therefore, as part of this review we aim to shed light on the impact of various programmes, as well as on the mechanisms that can help policymakers understand why similar programmes succeed in some countries or contexts but fail in others.
This review has some similarities with another Campbell-registered review, by Grimm and Paffhausen (2013). Theirs, however, focuses on employment creation and business creation and not on firm performance outcomes such as productivity, revenues, profits, innovation, formalization, and access to credit—all of which are the main outcomes of interest of our review.
2 Objectives
This review examines evidence on whether the provision of various SME support services impact firm performance, and how these may result in better performance indicators of firms (such as revenues, profits, productivity), employment generation and labour productivity with focus on low- and middle-income countries (LMICs). The analysis is based on the search of literature relevant to the impact of business support services for SMEs. The following questions are explored: What are the effects of business support services to SMEs on firm-level outcomes? (Review question i.) How do intervention-outcome effects differ per type of SME business support interventions (e.g. tax simplification, access to finance, training, and so on)? (Review question ii.) What are the most effective business support interventions for achieving different outcomes? (Review question iii.) Is the effectiveness of an intervention context-specific? If so, what specific institutional mechanisms (or ‘rules of game‘) facilitate or attenuate intervention effectiveness?
7
(Review question iv.)
In answering these questions, the research examined intermediate outcomes (such as access to credit, training, formalization and access to external markets), final outcomes (such as higher profits, employment generation, productivity), and also any context-specific variables for explicating the causal chain of an intervention. Thus, a key objective for this review is to explore moderator variables that may link to the institutional settings and levels of development in each respective study context.
3 Methods
3.1 CRITERIA FOR CONSIDERING STUDIES FOR THIS REVIEW
3.1.1 Types of studies
The review draws on a broad search to identify studies that relate to the interventions aimed at SMEs in LMICs.
To address the review questions (i.e. review questions i. through iv.), the review focused on quantitative analysis and included only studies that used rigorous impact evaluation in the form of experimental (randomised controlled trials, or RCTs) and quasi-experimental methods – such as regression discontinuity design (RDD), instrumental variables (IV), difference-in-differences (DID), matching on covariates, or propensity score matching (PSM), and any other studies that purported to control for selection bias (for example, Heckman two-step estimator). 8 Studies selected must have reported controls for the endogeneity of programme placement or self-selection into the programme. Experimental and quasi-experimental methods are widely seen as the best tools when the main objective is to estimate the causal impact of an intervention or policy (for example, see Duflo et al., 2008). When an intervention is carefully designed or the identification strategy of an observational study convincing enough, the findings on the impact of the programme or intervention are said to have internal validity, that is, one can claim that the difference in the outcomes between treatment and control groups was caused by the intervention. 9
This review thus only considered those studies that assessed the impact of an intervention comparing the treatment (or eligible) and the control (or comparison) groups at one or more points in time. In cases where more than two treatment phases were considered, the estimates involved comparison of the two treatments. 10 The studies considered are therefore drawn from cross-sectional and panel data datasets. Quasi-experimental studies that relied on observation data must have shown balance tests or use a matching method to control for imbalances in observed characteristics to warrant inclusion. Moreover, studies using matching methods needed to clearly state the eligibility criteria of the programme to make the case that the problem of selection bias was (mostly) due to observed characteristics. Most importantly, the studies included documented the impact of any business support service on SMEs compared to business as usual. In addition, and as noted prior, the review compared the impact of different types of business support service on firm performance.
As discussed in Waddington et al. (2012b), focusing exclusively on studies that use experimental and quasi-experimental methods may significantly restrict the studies that can be included in a review. Although this is a legitimate concern particularly if one is interested in comparing different interventions, we accepted this trade-off based on the idea that findings that do not control for selection biases may be misleading in terms of policy relevance.
3.1.2 Types of participants
This review only focuses on studies that evaluate policies aimed at supporting SMEs in LMICs (as defined by the World Bank's classification). The focus on LMICs is justified firstly because private firms in these countries tend to be more labour intensive and less innovative, and consequently are a main employer for a large proportion of the labour force (e.g. Acz and Amoros, 2008; Cravo et al., 2012). Secondly, restricting the scope to LMICs helps to identify the binding constraints that SMEs might face in similar institutional contexts, such as in a number of African settings. The term SME covers a wide range of definitions and measures that vary depending on country context and reporting methods. Some of the commonly used criteria to define and measure SMEs are the number of employees, total net assets, sales, and investment level (Ayyagari et al., 2007). The most common criterion used to classify SMEs is based on employment information, often due to data availability. The cut-off used to define SMEs is usually 250 employees. 11
This review draws on this definition and considered SMEs to be firms that have up to 250 employees. We also included studies that do not provide the number of employees but use annual revenue to classify firms as SMEs instead 12 . Other types of interventions, such as those aimed only at supporting entrepreneurship and the creation of microenterprises (for instance, microfinance 13 ) are not considered for this research. We make this distinction because self-employed and micro-entrepreneurs are thought to have a different nature in comparison to SMEs. 14 The former, especially in LMICs, are comprised of less productive or informal enterprises of few employees in the fringe of markets. Furthermore, these enterprises are often ineligible for those public interventions covered in this review. Thus, the common definition of SME based on number of employees fits our purpose of covering a broad set of interventions and potential relevance for African countries. 15
Though the literature recommends that synthesis is informed by the theory of change embedded in the design of an intervention (see Waddington et al., 2012b), our focus extends beyond the outcomes directly anticipated by an intervention to include unanticipated outcomes also.
3.1.3 Types of interventions
Support to SMEs is related to the dual goals of productivity growth and employment generation; the theory of change that motivates SME support services is linked to fostering institutions that enable SMEs to grow in these goals. Figure 1 provides a general illustration of the theory of change for the interventions surveyed in this review, which are detailed in Table 1.
Following the discussion in Section 1, we include the following interventions in our review: 16
Tax simplification; might be seen as an institutional improvement. The support to SMEs in this case is usually accompanied by actions that support formalisation of SMEs. Therefore, tax simplification is intended to provide incentives for informal SMEs to formalise. For instance, new legislations might establish that SMEs pay taxes based on a fixed percentage of gross revenue, usually reducing the tax burden paid by firms (e.g. Fajnzylber et al, 2011). Tax simplification incentives can also be coupled with strategies that streamlining the process of opening a business (e.g. Bruhn and Mckenzie, 2013).
Exports/Access to External Markets; defined as interventions that correct market failures such as information externalities and help SMEs overcome obstacles to exporting (Volpe and Carballo, 2010; Volpe et al., 2010; World Bank, 2010). As suggested in Section 1, this type of intervention is related to information asymmetries that prevent firms from having access to external markets. Institutions that promote exports usually offers support through the creation of export consortiums, trade promotion in international business fairs, market research, trademark development, and trade information. For instance, Weiss et al (2011) describes a public policy instruments for export promotion in Chile called Export Marketing Assistance (EMA). This initiative provides participant SMEs knowledge about external markets, specialised information and allow firms to participate in international fairs.
Support for innovation policies is based on the idea that social returns to innovation exceed private returns (Lundvall and Borras, 2005; Acs and Audretsch, 1988). Interventions designed to support innovation vary. This review will consider different types of innovation support subsidies and tax incentives, as identified in the preliminary search.
Matching grants are interventions that provide a government subsidy related to those costs firms incur with regards to training, marketing, and/or attending a trade fair.
Local production systems: defined as interventions that help individual firms benefit from agglomeration externalities and overcome the coordination failures that prevent SMEs from capturing these externalities (Schmitz 1995; Schmitz and Nadvi 1999; Giuliani et al., 2005). Arraiz et al (2013) describes a Supplier Development Program in Chile where collective action aims at establishing a long-term commercial relationships between large buying firms and their small and medium enterprise (SME) suppliers to increase competitiveness. The objective is to collectively form a mutually beneficial relationship to help firms compete more effectively in the marketplace.
Training and technical assistance: defined as interventions that provide support for employee training and technical assistance, based on the idea that skills improve employability and wages of workers and contribute to firm productivity (Attanasio et al., 2011; Rosholm et al., 2007). This type of intervention also includes consulting services and management practices such as those considered by the World Bank (2010), Bruhn et al. (2013) and Bloom et al. (2013).
SME Financing/Credit Guarantee: adverse selection and moral hazard in credit markets generate financial constraints, which in turn restrain SME activities (Beck and Demirguc-Kunt, 2006; Michelacci and Silva, 2007; Canton et al., 2012). The review will consider in this line of support, interventions that provide loans or insurance services to SMEs, such as those noted in World Bank (2010) for credit and in Oh et al. (2009) for credit guarantee schemes.
It is important to note that various sub-components of business support interventions may overlap in the review/analysis. To avoid this we developed a conceptual model to categorize interventions as accurately as possible. Whenever possible sensitivity analyses are conducted using moderator factors and/or excluding studies with high risk of bias.
3.1.4 Eligible comparison groups
Most of the papers included in this review investigating the impact of a public policy targeting SMEs compare a treated (or eligible) group with a control group (or comparison group in the case of quasi-experimental design). However, we distinguish studies that compare treatment and control (or comparison) groups from those studies that have more than two treatment arms, and further separate evidence according to intervention design. In the case of RCTs, for instance, an intervention can use a phase-in design, an encouragement design, cluster (or block) randomisation, or pure randomisation (see Duflo et al., 2008). Different designs have two implications: (1) they almost always identify different parameters - intention to treat (ITT), average treatment effect (ATE), average treatment effect on the treated (ATT), local average treatment effect (LATE) and so on; and (2) they almost always differ in terms of data collected (different take-up rates, different attrition rate, different risk of contamination bias and so on).
3.1.5 Types of outcome measures
Our review covers studies that looked at both intermediate (or secondary) outcomes (such as access to credit, formalisation and access to external markets) and final (or primary) outcomes (such as profits, employment generation, and productivity). To be included in the review the study had to report estimates to at least one final outcome. Studies that reported estimates for secondary outcomes only were excluded. 17 To understand the causal chain of each intervention, this review looked for context-specific variables that can help explain either the failure or success of an intervention.
For the purposes of this review, we defined firm performance impacts as referring to objective indicators such as revenues, profits, job creation, innovation, formalisation, number of workers trained, and access to credit. Only factual/objective measures of firm performance impacts are included: subjective measures on beliefs and perceptions are excluded.
Primary outcomes
Primary outcomes of SME support revolve around better firm performance and growth and therefore can be categorised as: firm performance (e.g. revenues and profits), employment, productivity, and labour productivity. The following are examples of studies looking at these outcomes, which we include in the review: Mano et al.'s (2012) experiment in Ghana to analyse the effect of an SME training programme on sales and profit; Benavente and Crespi's (2003) study of the effects of an association strategy on productivity in Chile; Arraiz et al.'s (2012) assessment of the effect of value chain support on sales, employment and exports in Chile; Tan's (2009) evaluation of different Chilean SMEs programmes for technical assistance, cluster programmes, technology programmes and credit programmes on sales, output, employment, wage, productivity, and exports; and Castillo et al.'s (2011) study of the effects of process and innovation support on exporting, employment, wages, and survival in Argentina.
Secondary outcomes
Secondary outcomes vary according to the type of programme, but can be broadly defined as: innovation, exports, investment, and access to credit, formalisation, and management practices.
Programmes that provide access to credit ultimately aim to increase firm resilience and survival (for instance, allowing firms to endure an economic recession) and/or seek to encourage investment. The primary intention of these interventions is thus firm survival and increases in productivity. Similarly, with SME support related to innovation, training, and the value chain, underlying assumptions hold that innovative practices, more skilled workers, and a better coordination will result in higher productivity, employment generation, and access to foreign markets. For instance, Ibarraran et al. (2009) focus on how interventions such as training programmes, access to credit, product innovation, and certification affect the productivity of SMEs in Latin American countries.
3.2 SEARCH METHODS FOR IDENTIFICATION OF STUDIES
3.2.1 Electronic searches
The generalised search strategy covered as comprehensive a set of published and unpublished sources as was feasible within the period allocated. We prioritised electronic searches since regarding the interventions of interest, it was most likely that sources available electronically were reported in the formal literature on SMEs, or in the ‘grey literature’ from national and international organisations.
The first stage of the review involved a search of all published and unpublished studies likely to be relevant to our study objectives. To be included, they had to: Report on SME support interventions of the kind detailed in the section on interventions; Focus on LMICs, as defined by the World Bank classification; and, Have occurred since the year 2000, since the review would cover studies that used impact evaluation techniques that have evolved since that period.
18
Given the variety of interventions covered in this research, reference ‘snowballing’ was an effective strategy for beginning our search (Hammerstrøm et al. 2009; cited in Waddington et al., 2012). Reference snowballing consists of using existing reviews, papers, and reports to identify the set of studies to be reviewed. Our search strategy therefore drew on a first set of important studies already identified (see References, section 10). We then proceeded to conduct the electronic search as laid out in the next section.
3.2.1 Electronic searches
Databases:
3ie database of impact evaluations: http://www.3ieimpact.org
EconLit (Ovid)
ABI/INFORM Global (ProQuest)
PAIS International
Sociological Abst
Worldwide Political Science Abst (WPSA)
ASSIA
Web of Science ie ‘Web of Science – Social Sciences Citation Index‘
Business Source Premier (Ebsco)
Academic Search Complete (Ebsco)
Scopus
DAC (OECD) 19
Google Scholar: http//scholar.google.com
Journals:
Informaworld Taylor & Francis Journals Complete
Ingentaconnect.com (Ingenta)
JSTOR (All Collections)
Periodicals Archive Online (ProQuest)
Royal Society Journals
SAGE Journals Online
ScienceDirect
SpringerLink (MetaPress)
Wiley InterScience
Portals:
World Bank: http://www.worldbank.org/html/extdr/thematic.htm
IDB:
AFDB:
ADB:
UNDP: http://www.undp-povertycentre.org/
DFID: http://r4d.dfid.gov.uk/
CIDA: http://www.acdi-cida.gc.ca/reports
Table 1 provides the list of basic search terms used to identify studies in the systematic review. Based on these terms, a detailed search strategy was set up to account for US and British English spelling, to seek for the most relevant studies and to restrict the search to LMICs. The details of the search strategies are provided in Appendix A. The search strategy was developed using the Social Science Citation Index (ISI) and Econlit databases, two of the most important databases in economics. These search strategies were adapted for other databases that allow the users to construct detailed strings of search terms that are provided in the appendix. For the 3ie database and Google, we used the search terms provided in Table 1. 20 All searches strategies performed are provided in the appendices.
Types of intervention and related search terms
3.2.2 Searching other resources
Along with database searches, three research assistants undertook manual back searches in bibliographies of studies and journals identified as relevant to the review. 21 Given that the search focuses on LMICs, we also contacted experts in the field for recommendations on studies as well as addressing under-researched aspects of the interventions of interest. In addition, we contacted authors to obtain more information pertaining to the interventions they studied. The review covers studies published in English, Spanish, and Portuguese. 22
3.3 DATA COLLECTION AND ANALYSIS
3.3.1 Selection of studies
The selection of studies followed the search method described above. The search and selection of studies were done as follows: Two Principal Investigators (Pis), with support of John Eyers of 3ie, searched all the relevant electronic platforms and downloaded 9,475 papers using a RefWorks account. Additionally, the two PIs snowballed papers and books and downloaded a further 17 papers. After dropping duplicates, the list was reduced to 5,785 papers. Three research assistants contributed to the process of reviewing abstracts. Working independently, all abstracts were read by two research assistants who identified a list of 63 papers that met all the inclusion criteria, disagreements were resolved by a third member of the team.
23
The list dropped to 42 after the exclusion of 21 studies that covered microenterprises only. The papers were then divided into folders according to methods used, titled “quasi-experimental methods” and “experimental methods” respectively. Papers without an abstract, those unclear about the method used, and those without basic characteristics of the firms studied were saved in a miscellaneous folder titled “maybe”. The two PIs read the abstracts and methodology sections of the remaining 42 papers to decide whether they should be selected or not. The PIs decided to exclude studies that looked exclusively at intermediate outcomes – such as formalisation rates and numbers of new firms - and different versions of the same study. In the end, they came up with a list of 36 papers that could be assessed in the meta-analysis.
Whenever necessary, the PIs discussed and agreed on which papers to drop based on the detailed ‘filters’ outlined in the protocol.
3.3.2 Data extraction and management
The list of information extracted from the papers is shown in the study protocol (Gonzalez et al. 2014). The papers were tabulated in an Excel sheet and all relevant data were then uploaded to and analysed in Stata.
3.3.3 Assessment of risk of bias in included studies
To assess risk of bias in RCTs and quasi-experimental studies we used the 3ie risk of bias tool. Three researchers contributed to the risk of bias assessment. Two researchers worked on the extraction of the data and decisions on risk of bias, with disagreements resolved by the PI. Appendix B presents the criteria used to check whether the studies addressed risk of bias. To rank the studies we followed the same approach used by Baird et al. (2013) based on Hombrados and Waddington (2012), who divided studies into three groups: Low, Medium, and High risk of bias. The criteria used are simple and consist of answering YES, UNCLEAR, or NO for key questions in five categories that could bias results: Low Risk of Bias: If ‘YES’ for at least four issues listed under potential sources of bias. Medium Risk of Bias: If YES' for three issues listed under potential sources of bias. High Risk of Bias: If ‘YES’ for up to two issues listed under potential sources of bias.
The five categories are as follows:
Selection bias and confounding: This has to do with the identification strategy used in the study. In other words, we checked whether the identification strategy employed in the study convincingly addressed sources of selection bias. This category is classified in each paper as ‘NO’, ‘UNCLEAR’ or YES' depending on the method of analysis as described in Hombrados and Waddington (2012) and Baird et al. (2013).
Spill-overs and contamination: Here the main concern is with risk of contamination or imperfect compliance (e.g. when individuals in the control groups get treated). We answered YES', ‘NO’ and ‘UNCLEAR’ according to Hombrados and Waddington (2012) and Baird et al. (2013).
Outcomes reporting: The concern with reporting is when a study refers to set of outcomes, yet only presents estimates for those in which the treatment has an impact. Thus we answered ‘NO’ when ‘fishing’ is clearly identified, ‘UNCLEAR’ when fishing cannot be easily identified and YES' when results are reported for all outcomes.
Analysis reporting: If the study credibly shows attribution it was coded as YES'. Otherwise, it was coded as ‘NO’. If enough detail regarding attribution methods are omitted, the study was coded as ‘UNCLEAR’.
Other risks of bias: Other sources of bias risk could involve the problems of attrition, unreliable instrumental variables, lack of over identifying tests when the data allows for it (that is, when there are more instruments than endogenous variables), unreliable comparison group used in a DID analysis (no parallel trends before treatment), and/or absent discussion of pre-treatment trends when data allows for such, and so on. We answered YES', ‘NO’ and ‘UNCLEAR according to Hombrados and Waddington (2012) and Baird et al. (2013).
The results for the risk of bias assessment are provided in Section 4.2.
3.3.4 Measures of treatment effect
The treatment variables test the effect of a particular intervention, such as a component of a more comprehensive programme, the effect of a package composed of multiple components (for instance, matching grants programmes can include subsidised credit for technology adoption or upgrade, and some type of technical assistance) or the effect of one programme against other. For cases testing a particular intervention, the test compares the treatment group against (presumably) a pure control whereas for packages the test was made either against a pure control (effect of the package), or against a control group that were offered access to some components of the package (for instance, package against technical assistance), or similarly, comparisons of two separate interventions.
The effect of the interventions were tested on primary and secondary outcomes.
Primary Outcomes: Employment creation Labour productivity Firm performance
Secondary Outcomes Access to credit Exports Formalisation rate Innovation Investment Survival rate
Under ‘firm performance’ we grouped various outcomes such as sales, sales growth profits, production, value added, assets, and total factor productivity. 24 For ‘employment’ we grouped paid workers, new workers, workers recruited, and employment rate. ‘Innovation’ encompasses all types of investments for research and development (R&D), new products, and patents. Our measure of labour productivity grouped studies that reported sales per worker, profit per worker, revenue per worker, and R&D per worker.
To compare effect sizes across studies we used two standardised measures. For binary outcome variables we computed risk ratio (RR), and for continuous variables we used standardised mean differences (SMD). In most of the cases, the standard deviation of the whole sample (pooled standard deviation or ‘pooled_sd‘) was not reported and we therefore made some assumptions in order to compute the SMD and its standard error (SE). For instance, in a couple of studies that reported the effects of different interventions in a long set of intermediary and final outcomes, the descriptive statistics showed the comparison of means between treated and comparison groups, yet only the difference in means and the t-statistic for the difference was noted. The means and standard deviation for each group were not reported. In this case, we made the assumption that the standard deviation is the same in the treatment and control samples and that the covariance of the outcome variable Y between both groups is zero. 25
Although this assumption might be considered plausible in RCTs where the randomisation is at individual level and sample sizes are similar for the treatment and control groups, it is stronger in the context of quasi-experimental studies, particularly where sample size is relatively small and numbers of observations differ sharply between treated and comparison groups. In these cases, we assumed that the standard deviation was the same regardless of the selection process and the sample size in each group.
Whenever studies provided the sample size for the treatment and control groups at the baseline, SMD was computed using the following formulae: 
For cases where pooled_sd is not available we used the following:
For studies that used small samples we corrected SMD using the following correction (see Waddington et al. 2012):
27

We computed RR as follows (see Waddington et al. 2012):
The computation of SE of the effect sizes also requires some assumptions, particularly for RR. As discussed in Waddington et al. (2012), the SE of the error term in the regression model is the preferred option to compute RR (or SMD). In most cases this was not available, thus we used the standard deviation of the outcome among control units at the baseline. We used the following formulae to compute SE(SMD) and SE(RR):
Finally, we made an assumption regarding sample size when this was not provided for each group separately. In cases where only the whole sample was reported, we arbitrarily split the sample equally between treated and control units.
3.3.5 Unit of analysis issues
Most of the studies use data at firm level with the great majority coming from administrative data, such as census data about formal firms or large samples of firms. 28 In one study where the intervention took place at municipal level, authors clustered SE accordingly.
3.3.6 Dealing with dependent effect sizes
For our meta-analyses, the unit of analysis was the study. Nonetheless, several studies performed more than one estimate for the same outcome. For example, in some cases studies report on different interventions, and in others different specifications are tested and therefore there is a need to synthesise several estimates for the same intervention (say, matching grant) and outcomes (say, employment). When a study covered more than one treatment (say, matching grants and technical assistance), and provided estimates for each treatment separately and also for what some studies defined as ‘any programme’ – in this case the treatment dummy is defined as one if a firm is supported by at least one of the two interventions (either matching grants or technical assistance) and zero otherwise (as in Hong Tan, 2011; Lopez-Acevedo et al., 2011) –, we used the latter estimates to compute overall effect size across different interventions. 29
When such ‘synthetic effect’ is not provided, we determined it by taking a simple average of the ES across different interventions per outcome per study (Lipsey and Wilson, 2001). In such cases, the variance of different effect sizes was computed assuming zero covariance because in most cases overlap was limited, that is, firms either participated into a programme or another. 30 Averaging out across standardised ES provided in the same study was necessary to generate one overall ES per outcome per study so we could carry out meta-analysis pooling together different business support programmes.
We estimated synthetic effects in two other cases. First, because the outcome ‘firm performance’ encompasses different measures such as revenue, sales and profits, and in some cases there estimates are provided for each separately in the same study, we had to compute a synthetic effect for those cases as well. Second, some studies reported average effects in different points in time (e.g. short and medium run effects). We computed the synthetic effect for those cases, averaging the effects across time. In both cases, we assumed covariance equals to zero. 31
We also performed subgroup analysis looking at some interventions separately. Our review reports on a relatively high number of studies looking at the effect of matching grants on firms' outcomes. In cases where the same study tested the impact of more than one intervention (for example, matching grants and technical assistance), we first averaged the ES for matching grants and technical assistance separately and then took a simple average to obtain an overall ES per outcome per study. As before, this was made to estimate an overall standardized ES across different intervention and again we computed the variance assuming covariance between effect sizes as zero 32 . For interventions covering for at least two studies, standardised ES are reported separately as well as each programme or intervention being analysed- in this case, matching grants and technical assistance.
When sample sizes and treatment effects for subgroups are available, we computed summary effects as a weighted average of the effects sizes. As before, we also computed the variance by assuming covariance between the ES equals zero because this seems to be a plausible assumption for cases where there overlap between subgroups is inexistent or small, that is, where the ES are plausibly independent.
3.3.7 Dealing with missing data
We contacted study authors to ask for missing information, such as descriptive statistics at the baseline (mean, standard deviation and sample size and intra-cluster correlation when it applies), and received quick feedback in most cases. Unfortunately, the quality of data presented varies considerably across studies. In many cases, we had to make assumptions in order to compute SMD, RR, and the SE, for instance
33
: When sample size was not provided for the treatment and control groups separately, we arbitrarily split the sample equally; When pooled standard deviation was not reported we used the standard deviation of the control group to compute SE(SMD) and the t-statistic of the treatment effect coefficient to compute the SMD; When a study used a cluster of firms at municipality level but did not report the number of firms, we used the number of clusters (municipalities) to compute the standardised effects and SE; If there was no available information on the sample size, mean and standard deviation, the study was excluded; In cases where the baseline data was reported for the pooled sample of firms but estimates were provided for sub-groups of firms according to firm size, we split the sample equally among the subgroups and used the same means for subgroups as for the pooled sample. Some studies reported the p-values rather than the SE or t-statistics. To convert p-values into t-statistics, we used a conservative approach and used the lower value of t for cases where the coefficient was statistically significant. For instance, for cases where the p-value was between 0.051 and 0.10 we used a t-statistic of 1.65. For cases where the p-value was between 0.011 and 0.05 we used a t-statistic of 1.96, and for p-values below 0.01 we used a t-statistic of 2.58; Where t-statistics were not available to compute SMD, we computed the pooled standard deviation using the standard deviations of the treatment and control groups and assumed a covariance between outcomes in both groups of 0.5.
3.3.8 Assessment of heterogeneity
We reported forest plot and heterogeneity measures, such as the Chi-squared test for heterogeneity (which captures within-study variance), the I-squared statistic, which we interpret as the proportion of total variance across the observed effects explained by between study variance, and τ2, an estimate for the variance of the ‘true effect size’ (see Borenstein et al. 2009). 34
We also considered the factors explaining heterogeneity through moderator analysis in the meta-regressions that include intervention design parameters as independent variables. To address the likelihood of limited evidence on intervention design, the review collected data on all final and intermediate outcomes, although it was restricted to studies which reported final outcomes, because this enabled us to better analyse the causal chain.
3.3.9 Assessment of reporting biases
To check for publication bias, we obtain the funnel plots using the metafunnel and metabias commands in Stata as well as Egger's (1997) simple meta-regression test.
3.3.10 Data synthesis
Most of our studies use quasi-experimental methods to estimate the causal effect of a programme. Most estimate the average treatment effect on the treated (ATT), but few estimate the LATE instead. As discussed in Duvendack et al. (2012), there is not a consensus of whether meta-analysis should be performed for quasi-experimental studies. In this review we decided to use meta-analysis to have the ‘big picture’ of the impact of interventions aimed at SMEs. However, in face of the challenges in practice and decisions made, we argue that these results should be treated with care.
After obtaining the effect sizes and their respective SE per outcome per study, we computed forest plots using the Stata command metan. The overall effect was computed assuming a random effects (RE) model. A RE model assumes there might be different ES underlying different studies and interventions, and that the total variance for these should account for between-studies variance (see Borenstein et al. 2009). We also report the confidence interval for each overall estimate and its p-value to assess statistical significance.
3.3.11 Subgroup analysis and investigation of heterogeneity
We provide synthesised ES for three primary outcomes – (1) firm performance; (2) employment; and (3) labour productivity. For four secondary outcomes – (a) exports, (b) investment, (c) innovation, and (d) formalisation rate – we show the forest plots with individual estimates since we did not systematised review studies looking specifically at those outcomes. This analysis is complemented with meta-regressions (metareg command in Stata) controlling for some moderating factors, such as region fixed effects, firm size, and risk of bias. 35 These moderator variables were identified in the study protocol (Gonzalez et al. 2014). We decided to present forest plots only for outcomes that had at least four ES. For outcomes with two or three observations we present random effects estimates using bivariate meta-regression only.
3.3.12 Sensitivity analysis
Given the relatively small number of studies that looked at the impact of the same (or similar) intervention on the same outcomes and the low number of studies with low risk of bias, we conducted the sensitivity analysis dropping studies that stand out visually as clear outliers and, whenever possible, looking at the effects of interventions separately. In the meta-regression analysis we were able to explore moderator factors, including risk of bias and study design, more successfully and provide estimates for individual interventions. 36
3.4 DEVIATIONS FROM PROTOCOL
During the conduct of this review, we made changes to the inclusion criteria and analysis which represent deviations from the Campbell Collaboration protocol (Gonzalez et al. 2014). These are outlined in more detail below.
Five databases included in the protocol were not used in the electronic search for the review. These are: NBER Working Papers, IDEAS/RePEc, BLDS
Following this, the study type inclusion criteria to address question iv., and the question on applicability to African countries, originally listed as review question v. in the protocol (and addressed in Appendix C) were amended. To address these questions, we originally intended to include background programme documentation or ‘sibling studies’ (Snilstveit, 2012) on the interventions in question provided they: 1) related to the interventions included in the effectiveness review; 2) reported on primary data collected from beneficiaries, programme staff, local authorities and experts; 3) contained analysis of the context and mechanisms that facilitate or negate firm performance impacts; and 4) described their methodology adequately for the purposes of this review (meaning they provided information regarding their sampling strategy, data collection procedures, type of data analysis, methodology, and methods or research techniques). Due to time and resource constraints, we were not able to conduct the search and analysis of these additional documents. Our analysis of the evidence on these two questions thus solely relies on evidence reported in the included quantitative effectiveness studies whose inclusion criteria are outlined above. We acknowledge that this limits the ability of this review to comprehensively address these review questions). 37
Another deviation from protocol relates to a change in outcome inclusion criteria. The protocol states that studies had to report at least one impact to do with firm-related outcomes, either intermediary or final to be included. However, in the review, we excluded studies that focused only on intermediary outcomes because they do not show whether the intervention improved firms' outputs or not. This decision led to the exclusion of only two studies, however, with no implications for African countries since both looked at the impact of tax simplification policies on the formalisation rates of firms, in Brazil and Bangladesh respectively.
Another deviation from protocol was a change in the definition of SMEs that we used as population inclusion criterion. In the protocol we stated that we would work with firms that have between five and 250 employees and would use that definition during the screening stage. In the review, we expanded this definition to include firms that have between one and 250 employees. 38 We also included studies that do not provide the number of employees but use annual revenue to classify firms as SMEs instead.
It is also important to make clear that the approach to sensitivity analysis followed in this review differs from what is in the protocol. In the protocol we stated we would assess sensitivity of findings to the use of experimental and quasi-experimental in the included studies. The idea would be to check how sensitive the overall effect sizes are after excluding the studies with high risk of bias and whether the impact evaluation method matters for the overall effect size. Unfortunately, the great majority of the studies used quasi-experimental methods and had moderate and high risk of bias. As a result, as mentioned above, given the relatively small number of studies that looked at the impact of the same (or similar) intervention on the same outcomes and the low number of studies with low risk of bias, we conducted these sensitivity analyses in meta-regression. We dropped studies that stood out visually as clear outliers and, whenever possible, looked at the effects of interventions separately.
4 Results
4.1 DESCRIPTION OF STUDIES
4.1.1 Results of the search
The initial search retrieved 9,475 studies. After dropping duplicates, the list dropped to 5,785 papers. The systematic review approach used detailed search codes to retrieve papers analysing the effect of SME support programmes from the following platforms: ISI, ECONLIT, ABI, PROQUEST and SCOPUS. In addition to searching online platforms, the two Pis snowballed key papers and books and added other 17 studies to the list. Although this review covers only studies that used experimental or quasi-experimental methods, our search strategy did not filter them according to the methods used.
The final list of studies from searching online platform was therefore examined with all filters outlined in the review protocol, which assessed the impact of an SME intervention using rigorous evaluation methods. With that in mind, three research assistants double-screened abstracts of 5,785 studies. A preliminary final list had 63 studies. It was noted that the great majority either did not use quantitative methods to assess the impact of an intervention, did not use a rigorous method to address selection problems, or looked at interventions targeting micro-entrepreneurs (21 cases). The PIs decided to exclude six studies that looked exclusively at intermediate outcomes – such as formalisation rate and number of new firms – and different versions of the same study and unpublished versions of published studies.
In the end, the team came up with a list of 40 studies (23 from the search in the online platforms and 17 from snowballing). Figure 2 illustrates this procedure. For the meta analysis we had to exclude four studies because we were unable to compute a standardised effect size and/or its standard error. The empirical analysis therefore included 36 studies and 72 ES per intervention-outcome combination. The large number of ES is due to the fact that a few studies tested the impact of several interventions together and then separately on the same outcomes, and some randomised controlled trials tested the effect of more than one treatment arm.
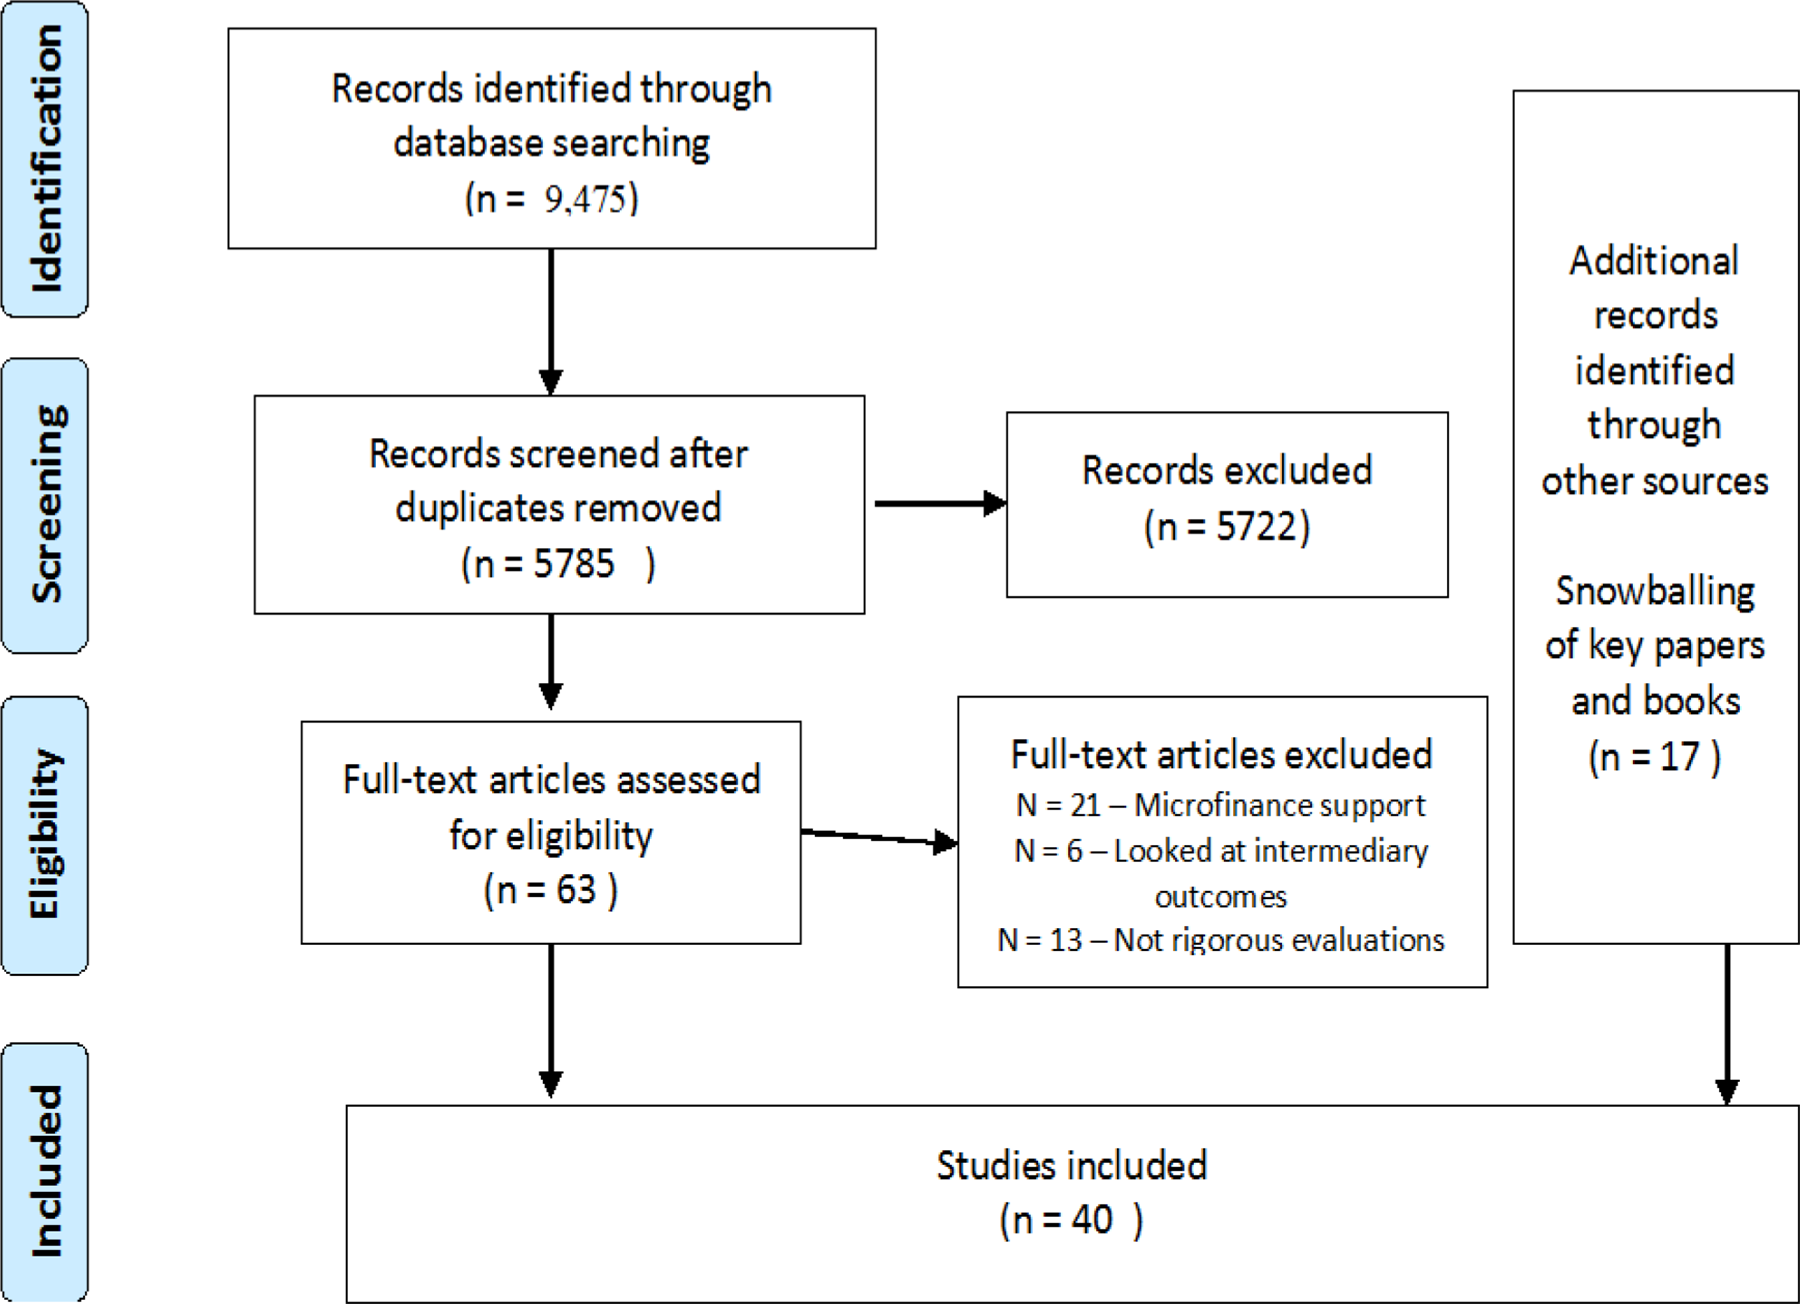
- PRISMA flow diagram showing study selection
4.1.2 Included studies
This review investigates the impact of a diverse array of SME support, as discussed in Section 1.3. The types of support include: matching grants/credit, innovation support, support to exports, tax simplification, training, and local production systems. Most of the papers included in this review measured the impact of a SME support intervention by more than one outcome at firm and employee levels (Figure 3). This section presents a brief analysis of each paper included in this review to provide qualitative discussion of specific results by each type of intervention.
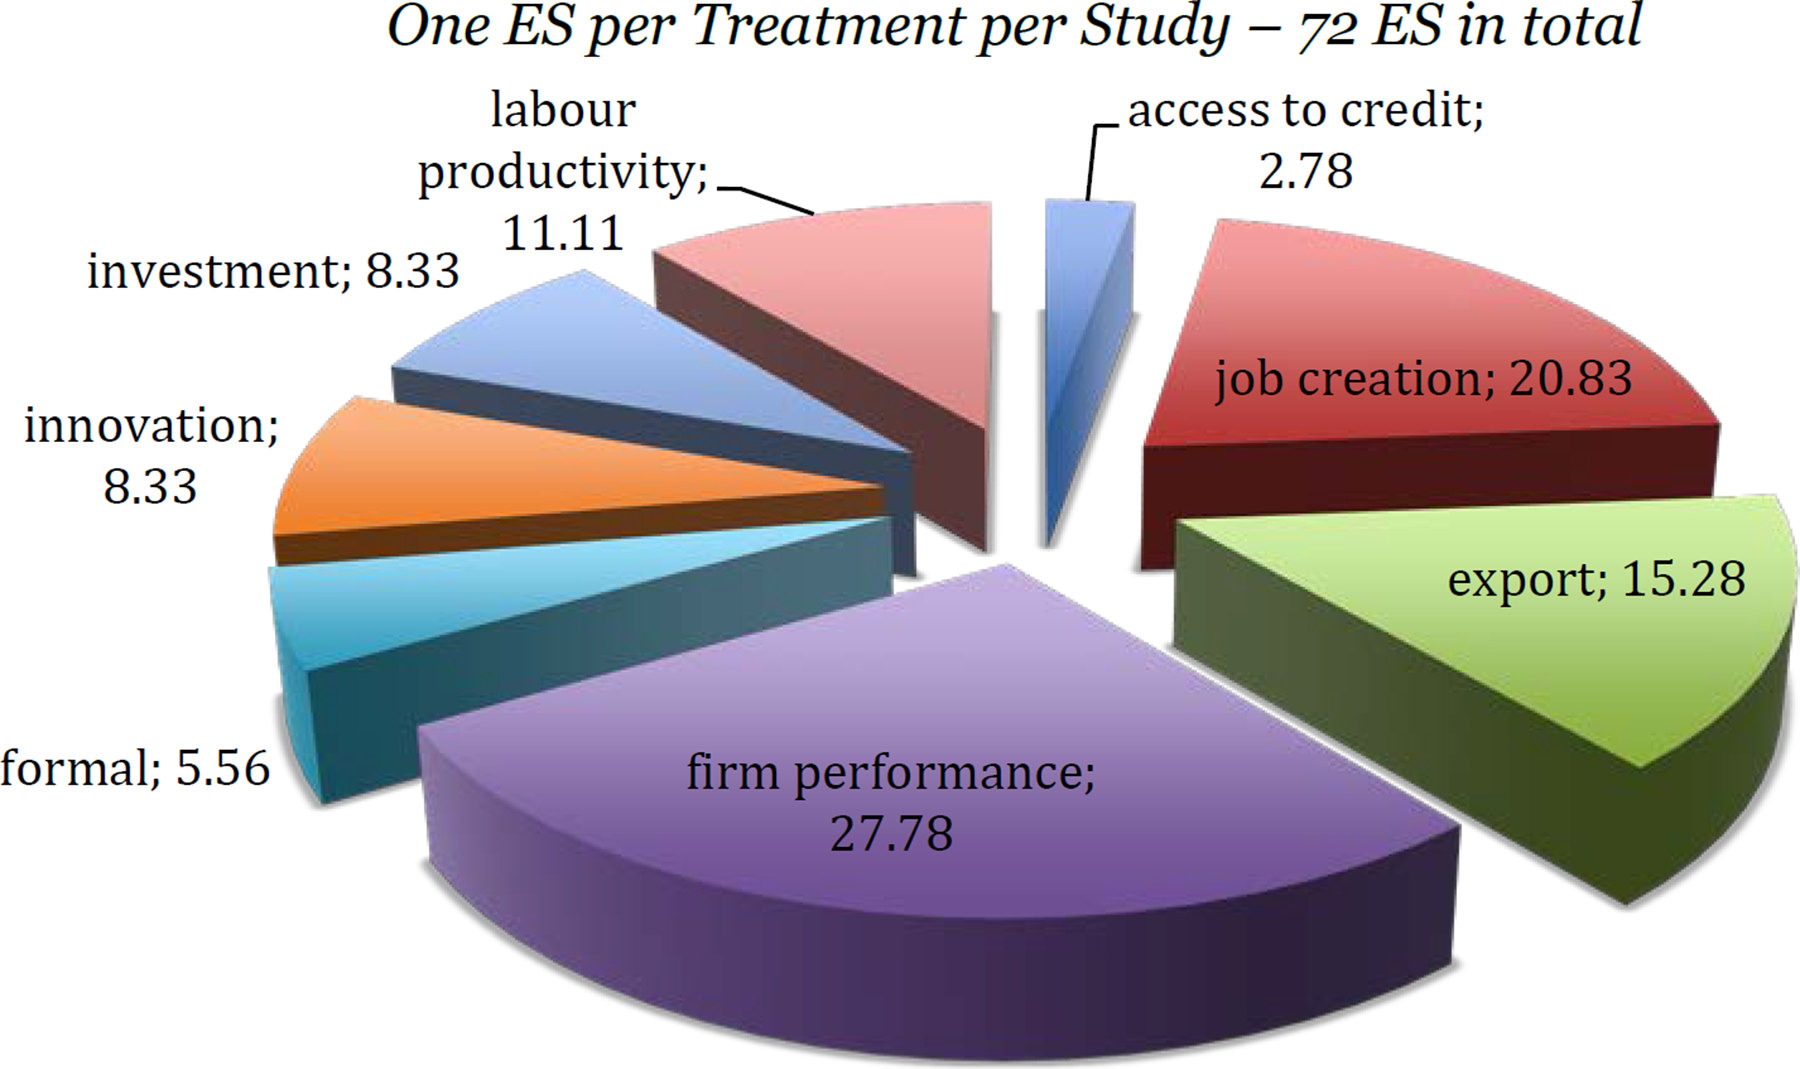
– Percentage of Reported Outcomes
According to Figure 3, five outcomes stand out: firm performance (27.8 per cent of the ES), employment (20.1 per cent of the ES), exports (15.3 per cent of ES), labour productivity (11.1 per cent of the ES), and investment and innovation (8.3 per cent of the ES each). The firm performance outcome groups the following individual variables: sales, sales growth profits, production, value added, assets, and total factor productivity. Because few studies report on the same type of outcome (e.g. profits) we took the decision to group these outcomes, which arguably measure similar constructs, together to maximise statistical power. 39
Figure 4 shows the cumulative number of studies produced between 2003 and 2014.
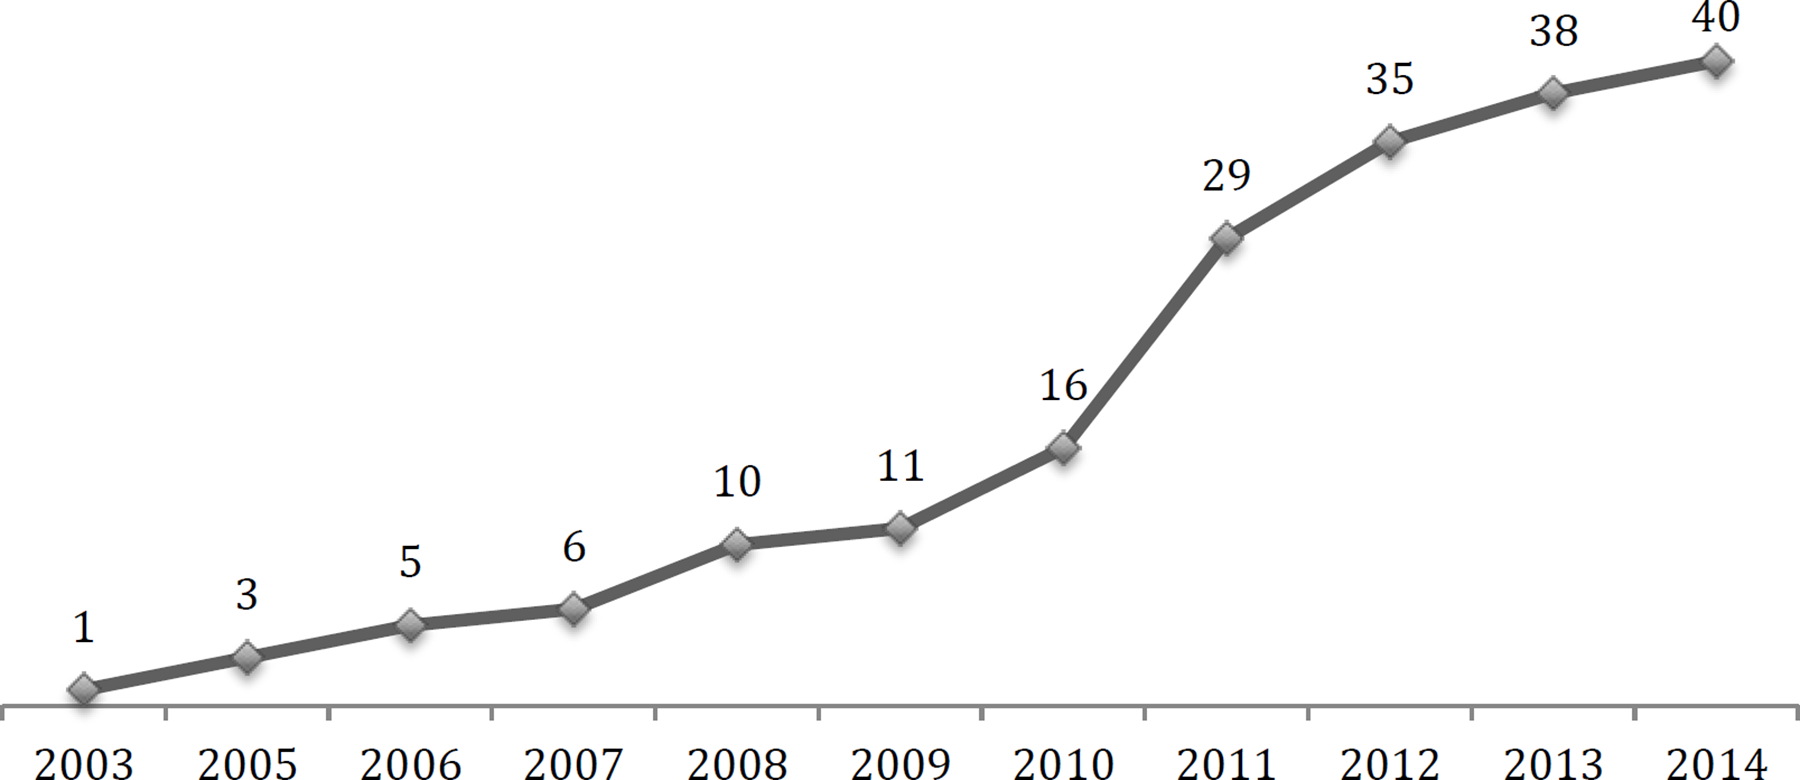
– Cumulative number of studies per year
Between 2003 and 2010 there were only 16 studies using experimental or quasi-experimental techniques to assess the impact of different business support to SMEs. Between 2011 and 2014 that number more than doubled. As noted in Figure 5, the evidence comes from 18 countries, most of which are in the Latin American region and five are in African countries.
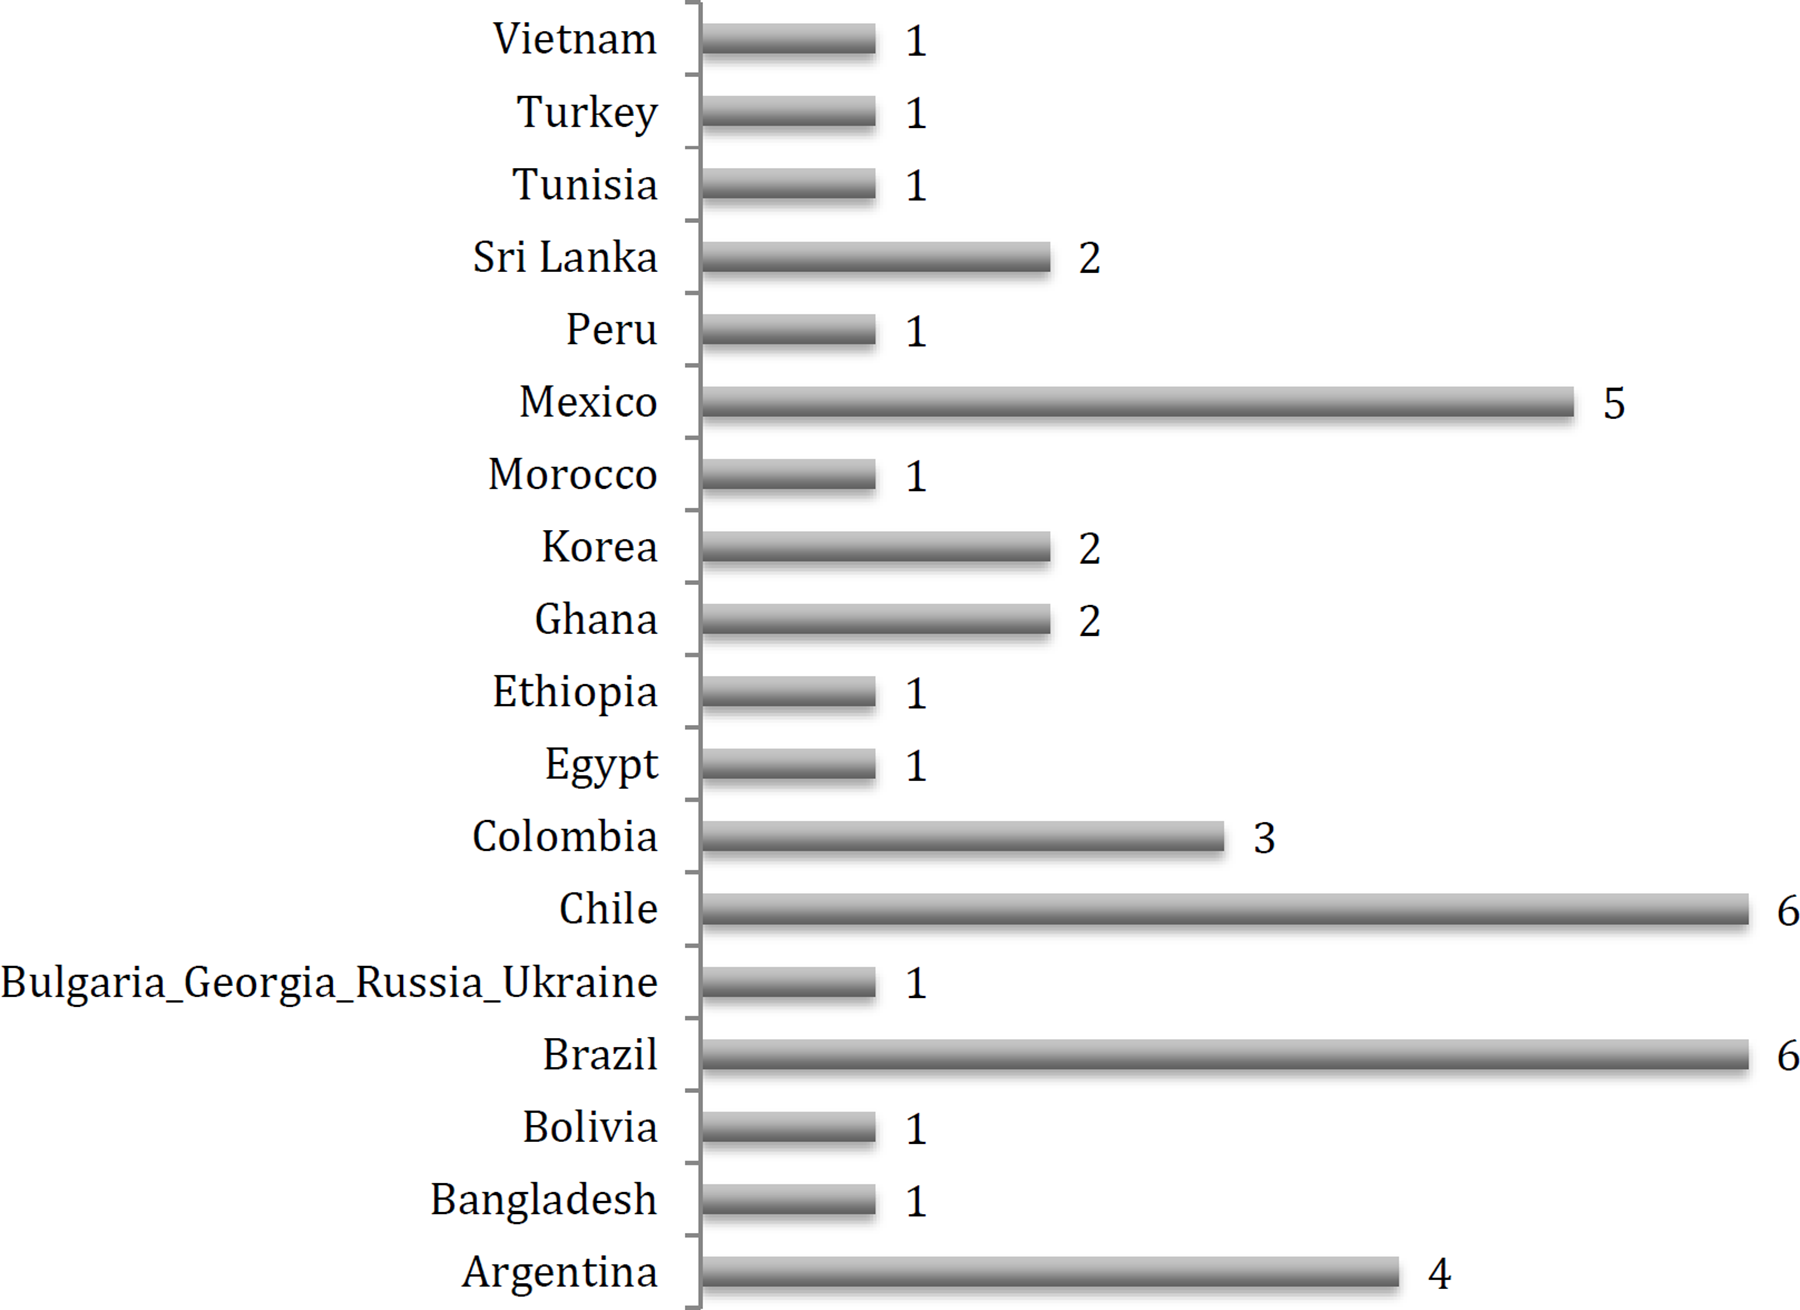
– Number of studies per country
Table 2 summarises the findings for each study (which are presented in detail in Appendix D). Most of studies use quasi-experimental methods and seven studies use experimental design (Atkin et al., 2014; Bruhn et al., 2012; de Giorgi and Rahman, 2013; Karlan et al., 2014; de Mel et al., 2012; McKenzie and Sakho, 2007), including one which was excluded from the meta-analysis because we were unable to calculate the effect size (Mano et al., 2012). The most commonly evaluated intervention category was matching grants (8 studies) and export promotion (8 studies), followed by innovation programmes (7 studies), tax simplification (6 studies) and training interventions (6 studies). Some of the less researched interventions include access to credit (4 studies), local productive systems (3 studies) and formalisation (3 studies). Two studies report on clusters of interventions. Fifteen studies focused on the manufacturing sector, while thirteen included all sectors and the remaining twelve focused on other sectors (agriculture, construction, textile, tailoring) or a combination of sectors. The studies display a large range of sample sizes; as low as 167 total observations from a managerial training programme in Ghana (Mano et al., 2012), to over 1.6 million observations from data assessing business registration regulations in Mexico (Bruhn, 2011).
Overview of characteristics of included studies
4.1.3 Excluded studies
The papers selected from those retrieved by the search codes were carefully screened based on their abstracts and selected to be included in the systematic review. The full revision of these selected papers deemed 21 studies ineligible as they looked at interventions targeting microentreprises, which are not included in our review, for example: De Mel et al. (2009, 2010, 2012, 2013a, 2013b), Fafchamps et al. (2011), Valdivia (2011) and Stewart et al. (2012). The review excluded studies that looked at the impact of an intervention only on intermediary outcomes (such as formalisation rate): Monteiro and Assuncao (JDE, 2012) and Andrade, Bruhn and McKenzie (2013). Studies that looked at impact of programmes that we did not consider a public intervention targeted exclusively to SMEs were dropped (Bah et al., 2011). Studies that looked at the impact of export zones, such as Cirera et al. (2011) and Cirera et al. (2013), were dropped. Finally, studies (RCTs) that did not clearly test a public policy and that was conducted with rural firms only such as Gine and Mansuri (2011) were not included in the review.
4.2 RISK OF BIAS IN INCLUDED STUDIES
4.2.1 Results of the risk of bias assessment
The assessment of the risk of bias is important to identify issues that might influence the estimated coefficient of studies and thus might have an impact on the results of this systematic review. This report uses the risk of bias tool, based on Hombrados and Waddington (2012), as described in section 3.3 to rank the studies and check whether they addressed the risk of bias. Additionally, we followed the strategy used by Baird et al. (2013) and provide an additional aggregated classification of risk of bias.
Table 3 presents the summary of aggregated results from the risk of bias assessment. The risk of bias results for each paper is presented in Appendix C.
Selection bias and confounders: Only 2 out of the 40 reports (5.0 per cent) completely address this issue. This is partly due to the fact that for some categories of quasi-experimental design (PSM, OLS, DID) the best possible ranking is “unclear” for selection bias and confounders, and most of the papers' approaches correspond to these methodologies.
Spill-overs, cross-overs and contamination: Seven reports (17.5 per cent) did not adequately address this issue. Moreover, since most of the programmes were implemented at the national or city level, and many others in one specific sector, some sort of contamination was always possible. Yet this issue was not sufficiently addressed, not even in the experimental approaches. This was especially difficult in quasi-experimental approaches, since data were collected previously by external institutions without taking into account possible spill-over effects within sectors or communities. Moreover, some papers report the existence of other simultaneous interventions likely to affect the outcomes. Since in this kind of research it is not common to separate participants and non-participants geographically and/or socially, the classification of the papers for the spill-overs, cross-overs and contamination most of the times fall into “unclear”.
Outcome reporting: All but three papers adequately address the issue of outcome reporting, and there is no evidence of selective reporting.
Analysis reporting: Twenty-two papers take an appropriate approach when conducting the analysis. The main reason a report was deemed of higher risk of bias for this category was the failure to report the necessary tests for quasi-experimental methods, especially Rosenbaum test for propensity score matching and Hausmann test for exogeneity in the case of instrumental variables.
Other risks of bias: The reasons why other risks of bias show up are heterogeneous, including violation of orthogonality of instruments, incentives of surveyed firms to overstate outcomes, data on the baseline collected retrospectively, among others.
Following Baird et al. (2013), using the above categories, we categorise the reports as low, medium or high risk of bias in Part B of Table 3. Only five per cent of the reports (2 studies) are categorized as low risk, 33 per cent (13 studies) as medium risk and 65 per cent (25 studies) as high risk. Since most of the reports presented quasi-experimental designs, it was especially challenging to find those that discuss all relevant features of the approach. This was especially true for the PSM methods, for which the most challenging requirement was the Rosenbaum test for hidden bias (which was not presented by any of the papers), followed by the lack of a test for equality in means of covariates between treatment and control groups after matching.
The overall results indicate that there is a huge heterogeneity in the potential for bias but most papers are classified as medium risk of bias. This result is hugely influenced by the assessment of the spill-overs, cross-overs and contamination category of the risk of bias tool. From the 40 reviewed, given the characteristics of SME support, most studies were unable to ensure that there is no spill-over or contamination of the treatment. As all SMEs are part of the whole economy in a particular region, general equilibrium effects are likely. The individual firm-level treatment is likely to produce spill-overs within the economy which are not controlled for.
Summary of Risk of Bias in Included Studies
Note: Part A of the table reports counts and Part B reports the counts in the first row followed by the respective percentage in the second row.
4.3 SYNTHESIS OF RESULTS
4.3.1 Quantitative synthesis40
This section discusses the meta-analysis and meta-regression estimates. Forest plots are provided for interventions investigated in at least 4 studies. We complement this analysis discussing meta-regression estimates for individual interventions. 41 Because the business support interventions analysed in this review were envisaged to improve firms' indicators, positive average effect sizes therefore represents positive effects. Thus, average overall ES that lies on the right hand side of a zero solid line in the forest plots indicates positive effect on both primary and secondary outcomes.
Primary Outcomes
1. Firm performance
We found that several studies looked at a myriad of outcomes related to firm performance such as profits, revenues, sales, assets, and so on. We thus grouped them under an outcome named ‘firm performance’ to be able to say something about the impact of different interventions on firms.
Our review found 20 ES related to firm performance (see Figure 6 below) across different interventions. Although the interventions may consider different group of firms (e.g. sector and size) and aim to tackle different market failures, we believe that providing an overall picture of the interventions covered in the review can still be relevant for high-level policy making. 42 Figure 6 reports the standardised ES (SMD) of each study and the overall average across interventions.
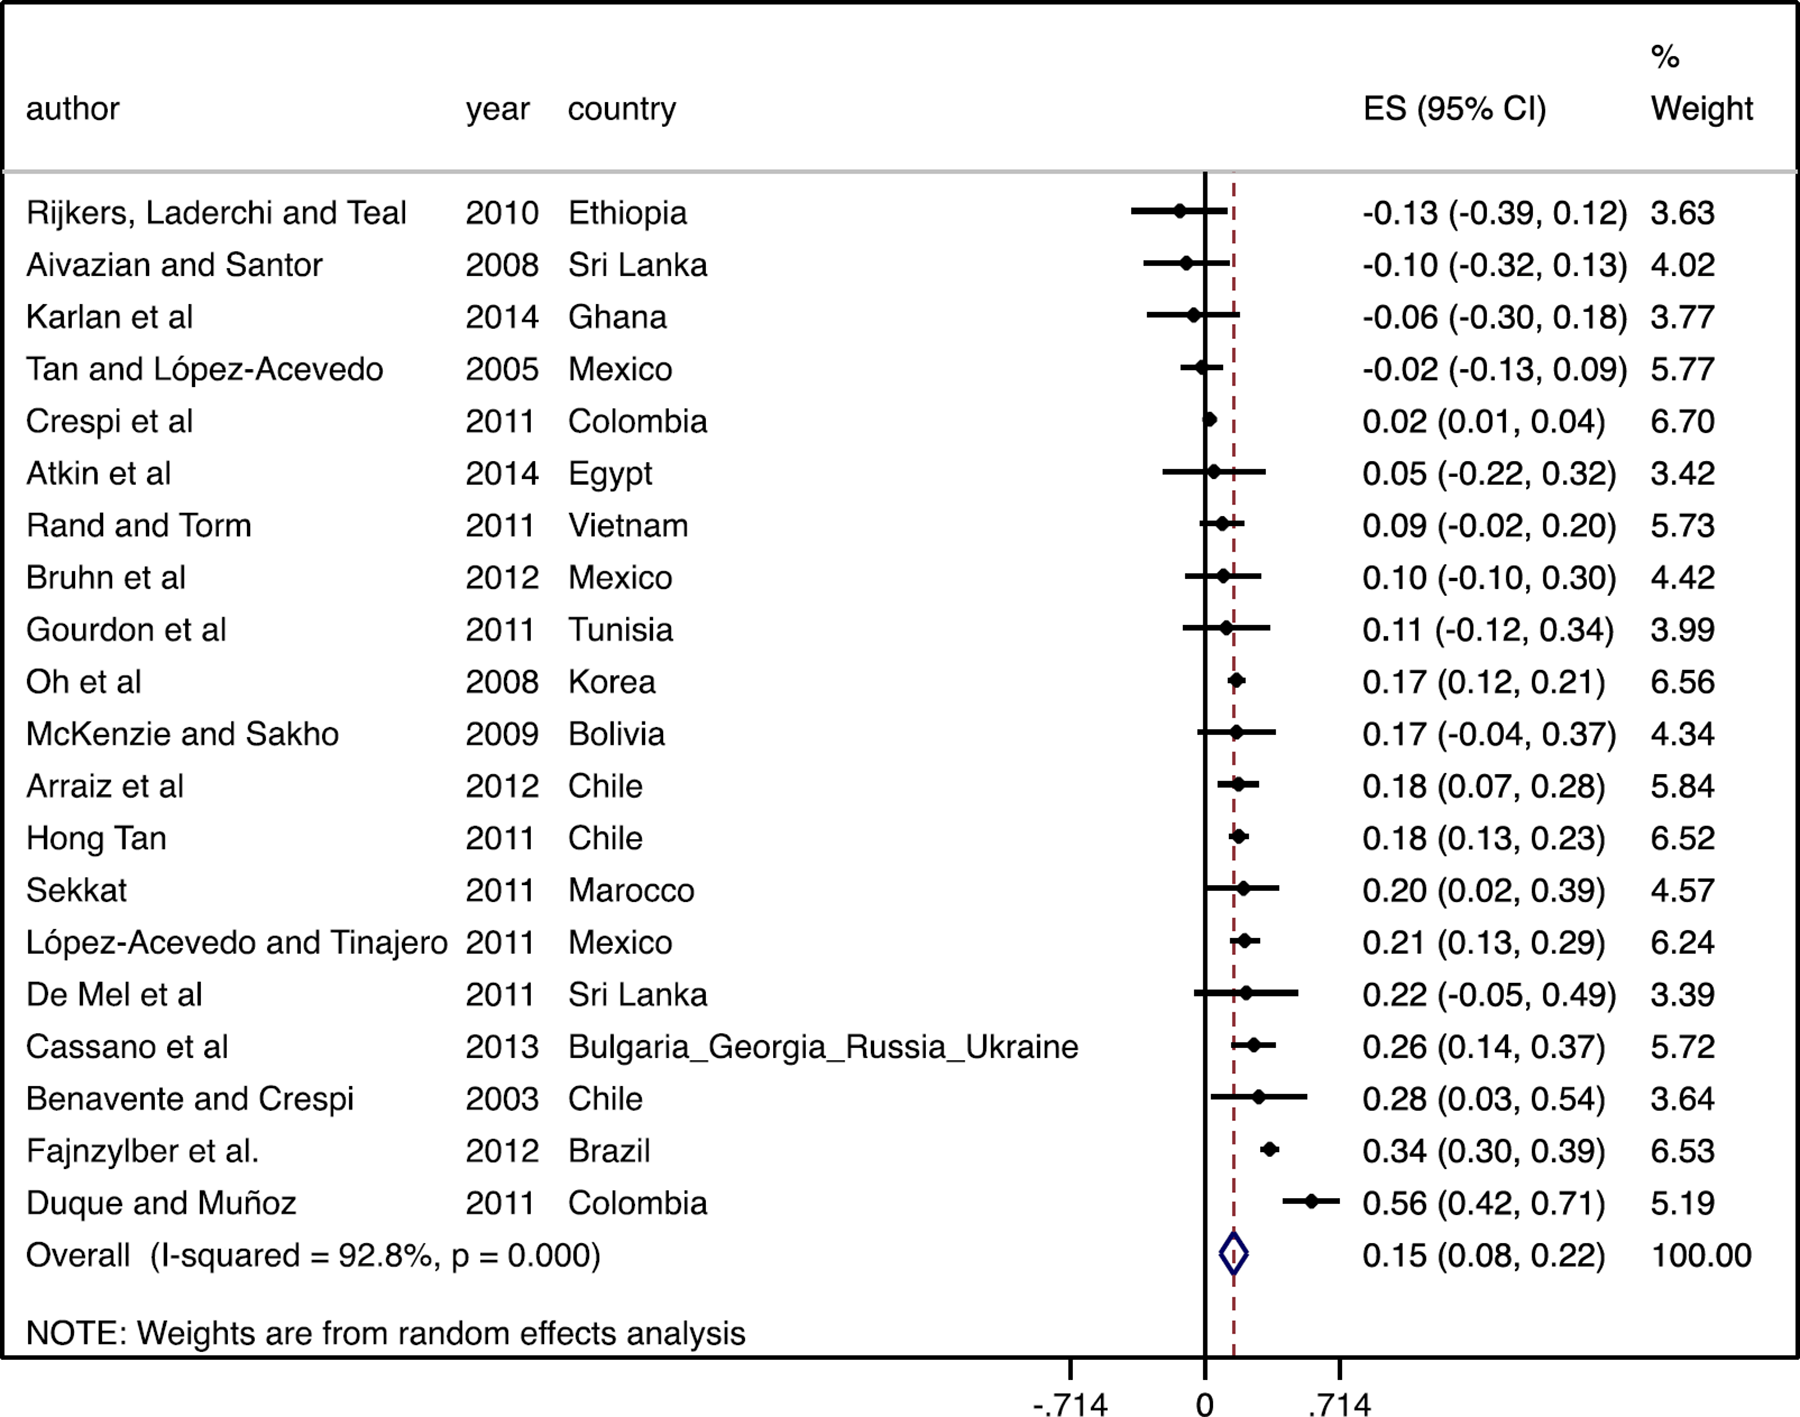
– Forest Plot – All interventions: Firm Performance
On average, interventions aimed at improving firm performance had a positive effect of 0.15 standard deviations. The effect is statistically significant at 1 per cent (p-value = 0.000) with a 95 per cent confidence interval (95% CI) of (0.08, 0.22). It is worth noting that most of the estimates (10 out of 20) come from interventions that took place in Latin American countries. Five estimates are from African countries. Also interesting is the relatively small heterogeneity between studies. As indicated by the homogeneity test statistics (I-squared = 92.8%, tau-squared = 0.0196) there is an indication of high heterogeneity across studies. This measure captures the degree of inconsistency in the studies' results (Higgins et al. 2003).
Since our review included 13 studies that examined the impact of matching grants programmes and nine that investigated the impact of export promotion programmes, our data allows us to look at the effect of these two interventions on firms' performance in isolation. Figure 7 shows that the effect of MG on firm performance is similar but not significant in statistical terms (SMD = 0.13, 95% CI of (-0.04, 0.30). The assessment of homogeneity suggest a large degree of heterogeneity across studies (I-squared = 96.5%, tau-squared = 0.064). However, as discussed below, the effect becomes identical to that obtained with all interventions pooled together once we drop one outlier study from the analysis. For support to exports programmes, we found zero effect on firm performance with the 95 per cent CI of (-0.08, 0.09) as shown in Figure 8. The assessment of homogeneity suggests that there is no between-study heterogeneity (I-squared = 0.0%, tau-squared = 0.000).
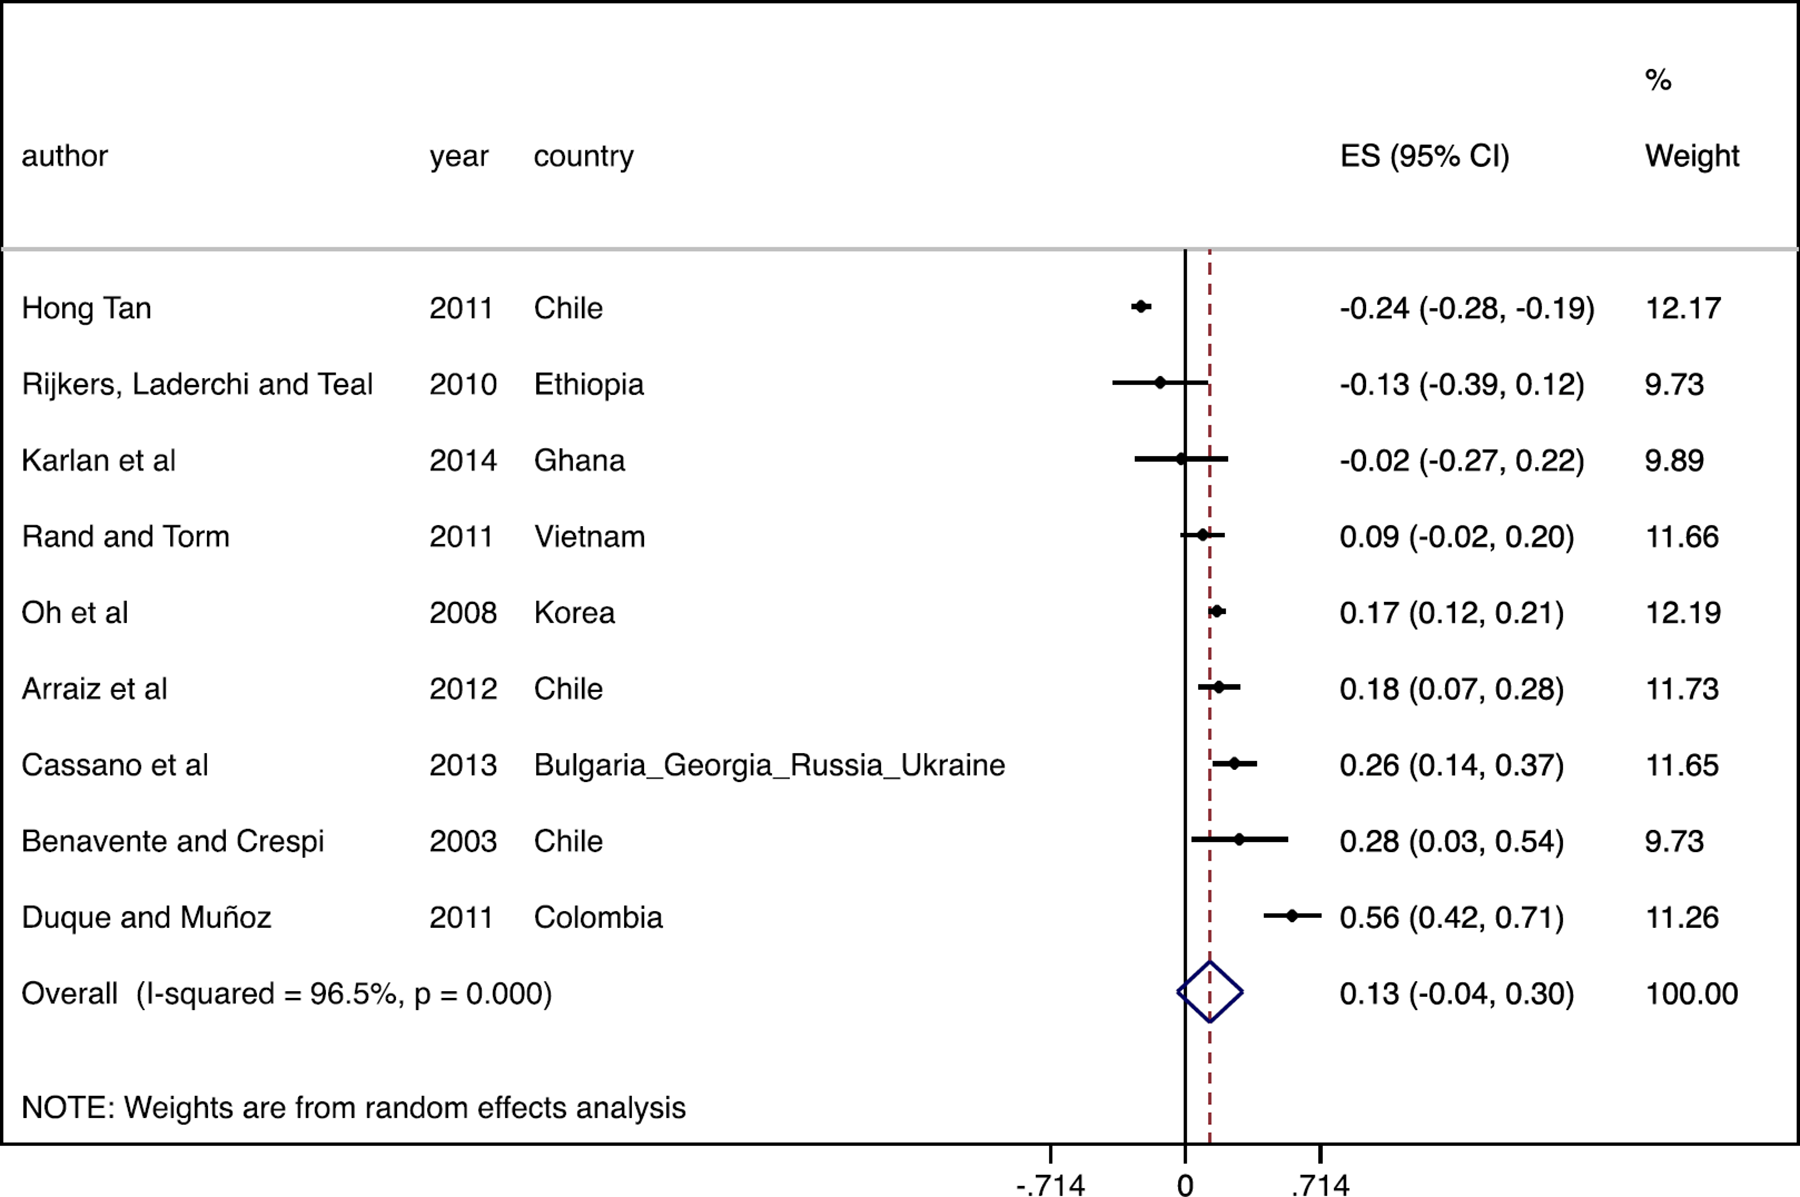
– Forest Plot – Matching Grants: Firm Performance
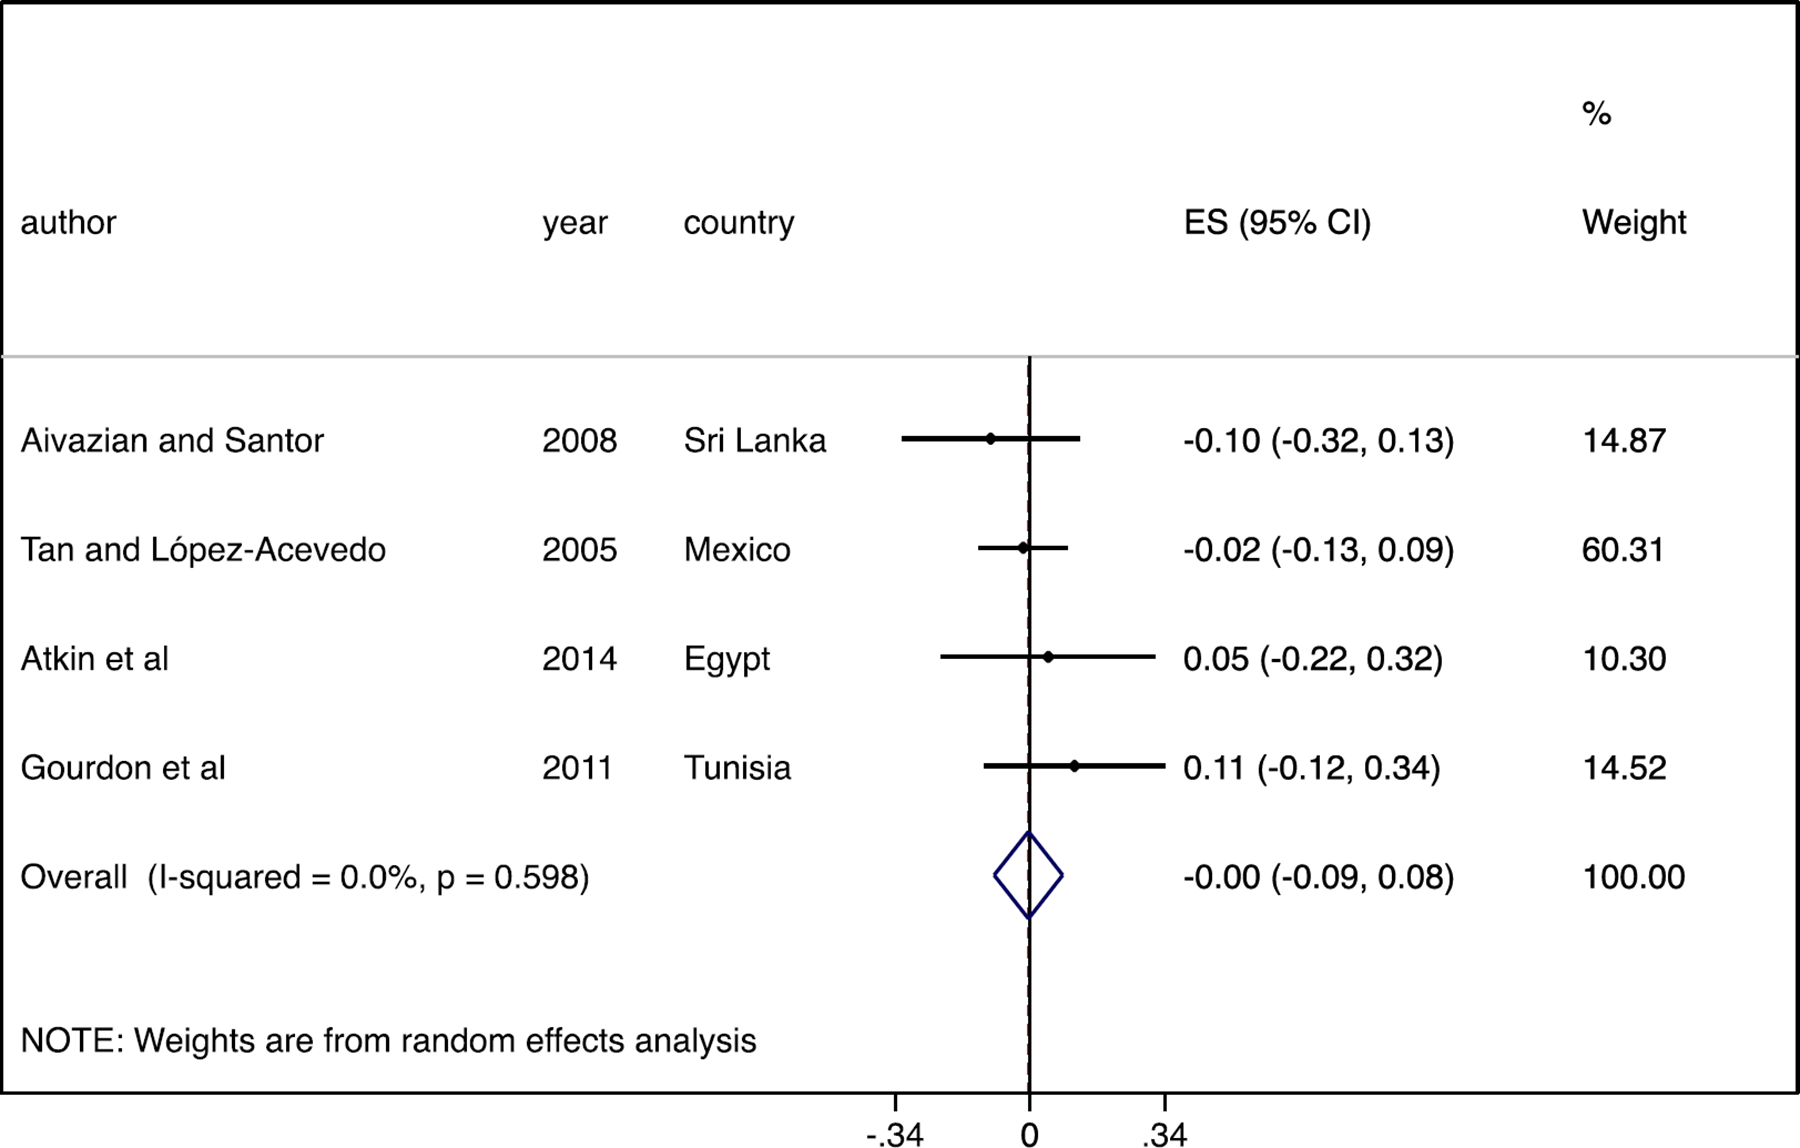
– Forest Plot –Support to export programmes: Firm Performance
The impact of MG on firm performance is interesting and could have at least two possible interpretations. First, it could be argued that business support of any sort works as subsidies (‘free money’) that end up favouring firms that would actually be able to carry on without any injection of public resources, i.e. a picking the winners argument. On the other hand, one could take this result as an indication that SME interventions of any sort are key to SMEs needing a ‘nudge’ to increase performance (or survive). In order to shed light on these two competing views, in the section below we look at the effect of MG on secondary outcomes, such as investment. In the meta-regression analysis we also approach this issue indirectly by looking at whether firm size influences the result.
As mentioned in section 5.4, some studies were not included in the meta-analysis as we were unable to compute either the standardised effect sizes or the adjusted standard errors. Despite the fact that standardised effect sizes or the adjusted standard errors could not be calculated, these studies also provided results on the impact of SME support programmes on firm performance and indicated the same effect of SME support programmes on firm performance as suggested in Figure 6. Mano et al. (2012) studies the impact of business consulting in the form of basic managerial training by doing an RCT in Suame Magazine, an industrial area consisting of metal workshops and enterprises in Kumasi, the second largest city in Ghana. The data collected comprised 167 firms, 60 in the control group (of which 53 were randomly selected; the other seven had been promised a place in the programme) between November 2007 and November 2008. The study collected data related to outcomes such as sales revenue, value added and gross profit. The results suggest that participation in the programme improves gross profit and value added of the firms that participated in the experiment. Another study not included in the meta-analysis and provide results on firm performance is Benavente et al. (2007). They analyse the effectiveness of the Chilean Technology Development Fund (TDF), the FONTEC programme. The authors adopt difference-in-differences and results suggest that the programme found a positive impact on sales.
2. Employment
The meta-analysis for employment outcomes included 15 effect sizes (see Figure 9 below). Although most of the evidence comes from Latin America, the figure suggests that different types of business support for SMEs help create jobs in almost all the countries considered. On average, programmes targeted at SMEs tend to help with employment creation. The overall effect is equal to 0.15 standard deviations (average SMD = 0.15). The effect is significant at 6 per cent (p-value = 0.057) with 95 per cent CI of (-0.00, 0.30). The values of I-squared statistic (99.2%) and tau-squared (0.081), though, indicates a high estimated between-study variability. This result is consistent with the common-sense view that SMEs may be an important source for job creation but the study also highlights that there is considerable variation in the effectiveness of different SME-support programmes on employment generation.
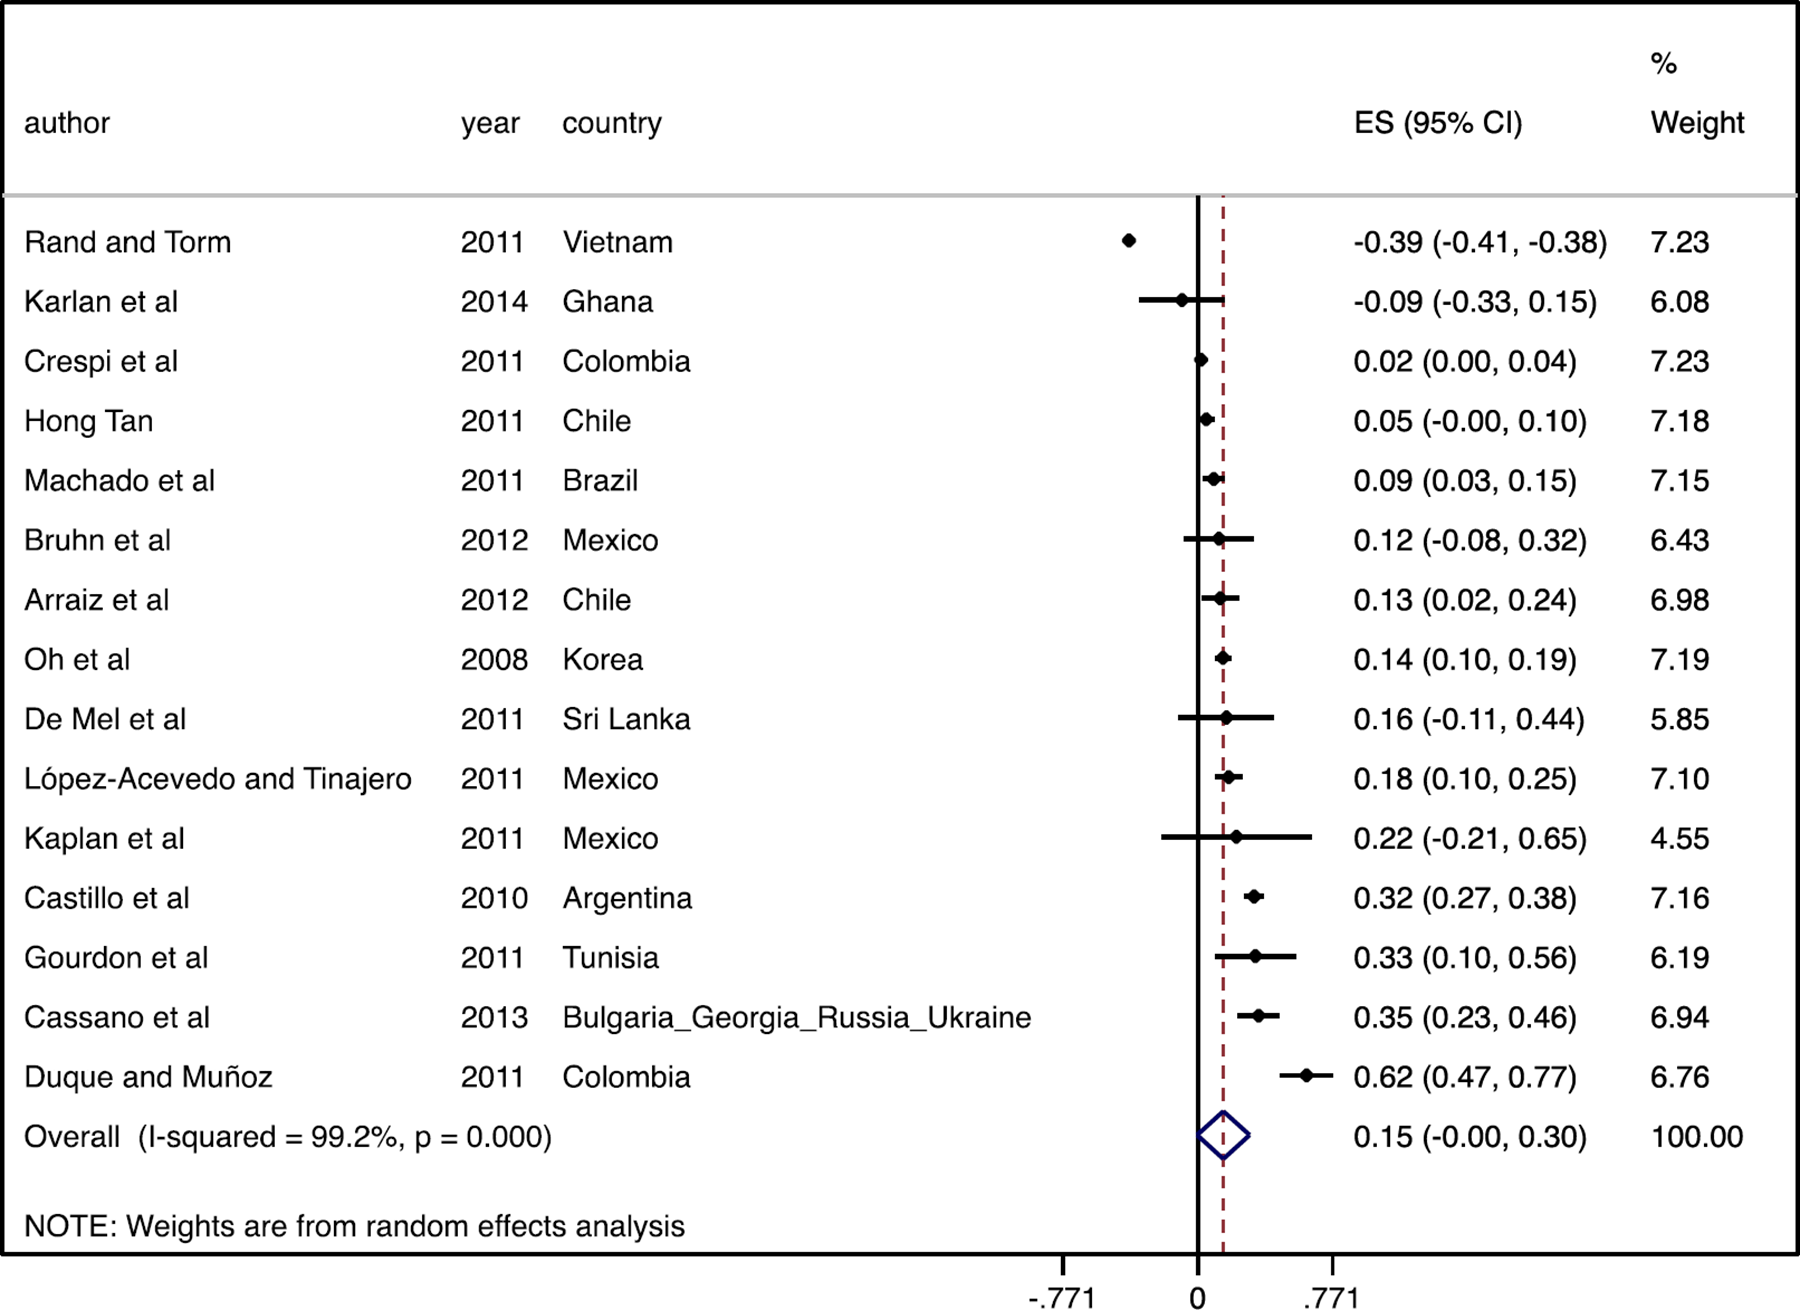
– Forest Plot – All interventions: Employment Creation
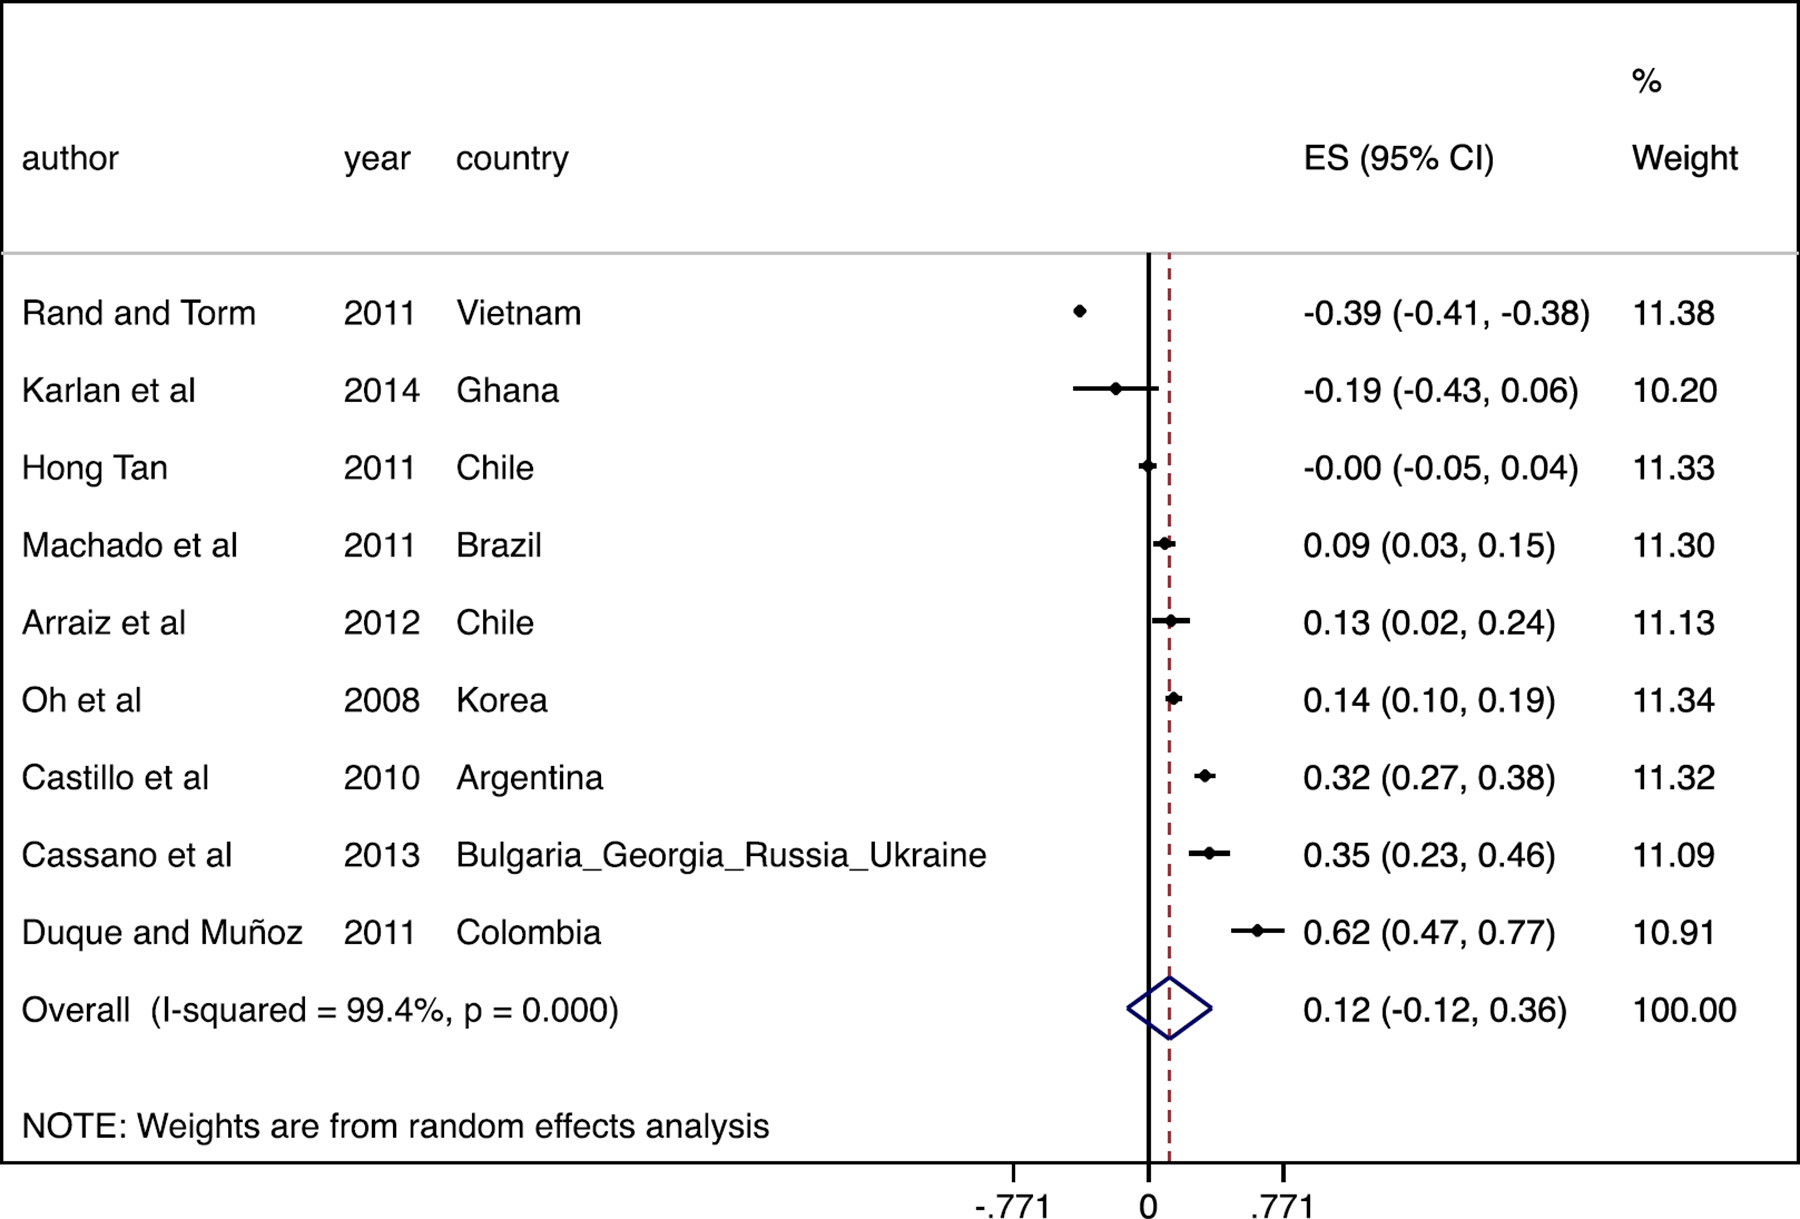
– Forest Plot – Matching grants: Employment Creation
Some of the studies that were not included in the meta-analysis because we were unable to compute either the standardised effect sizes or the adjusted standard errors present results on employment. Benavente et al. (2007) that uses difference-in-differences to analyse the FONTEC programme found a positive impact on employment. Corseuil and de Moura (2011) uses regression discontinuity design to assess the effect of the introduction of the SIMPLES legislation on manufacturing employment generation and the results show that SIMPLES has a positive impact on the creation of new manufacturing jobs in Brazil. Similarly, Kalume et al. (2013) evaluate the impact of Super Simples Nacional using the difference-in-difference estimator, the results indicate that the programme contributed to the definitive restart of activities for the inactive ones or the opening of new firms, thus generating jobs.
3. Labour productivity
The meta-analysis for labour productivity includes eight effect sizes. The evidence comes almost exclusively from countries in Latin America (see Figure 11). The overall effect size is 0.04, but it is statistically insignificant (p-value = 0.36) with a CI of (-0.05, 0.13). The assessment of homogeneity indicates a large degree of between-study variability (I-squared statistic = 88.7%, tau-squared = 0.0117), indicating that the pooled effect estimate needs to be interpreted with caution. The meta-analysis includes one study with a negative statistically significant effect, two studies with statistically insignificant effects and 5 studies with positive statistically significant effects indicating the potential for business support services to be both successful and to have potentially adverse effects on labour productivity. When we look at the effect of matching grants only we find a small negative effect that is not statistically different from zero (-0.02 SD, 95% CI = -0.15, 0.10) – see Figure 12. Again, the assessment of homogeneity indicates a large degree of between-study variability (I-squared = 94.1%, tau-squared = 0.02).
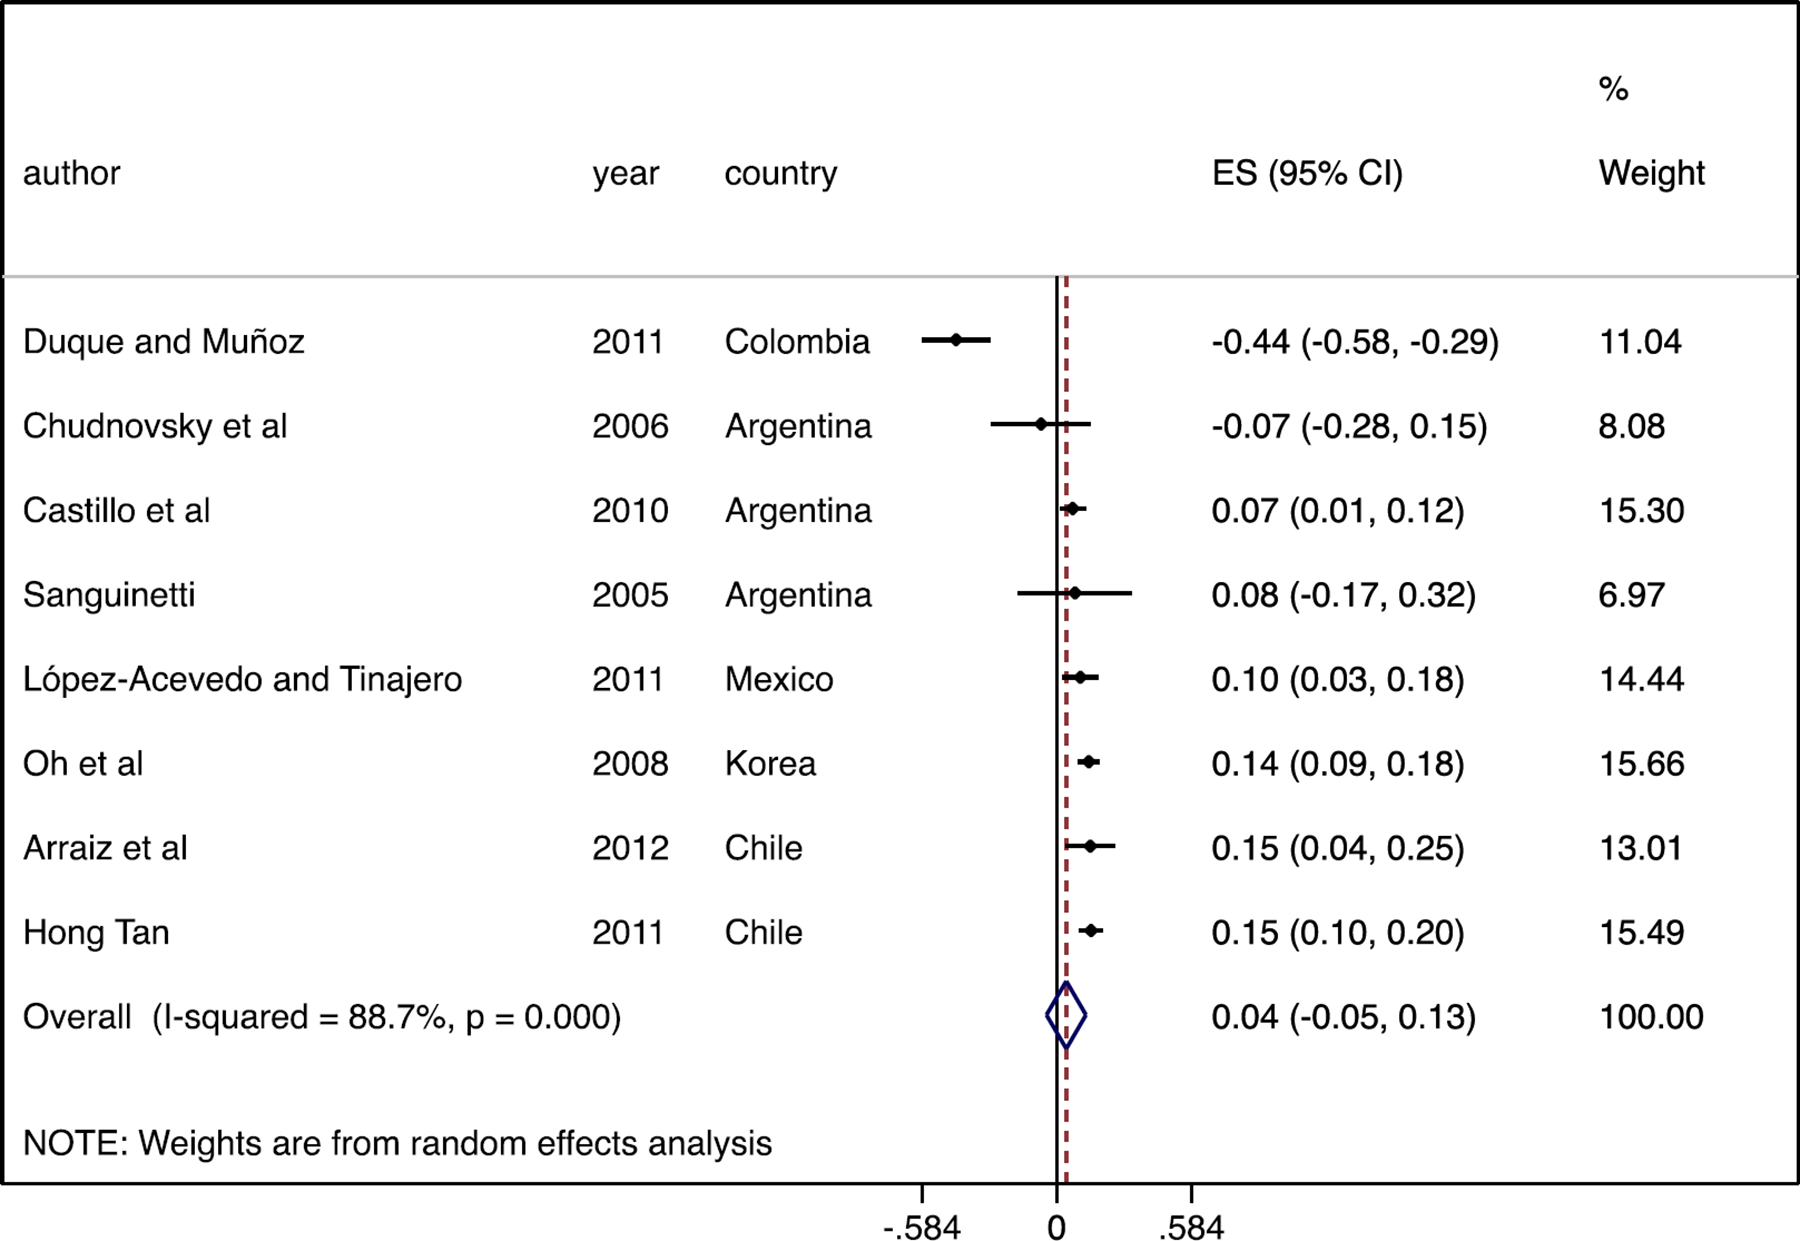
– Forest Plot – All interventions: Labour Productivity
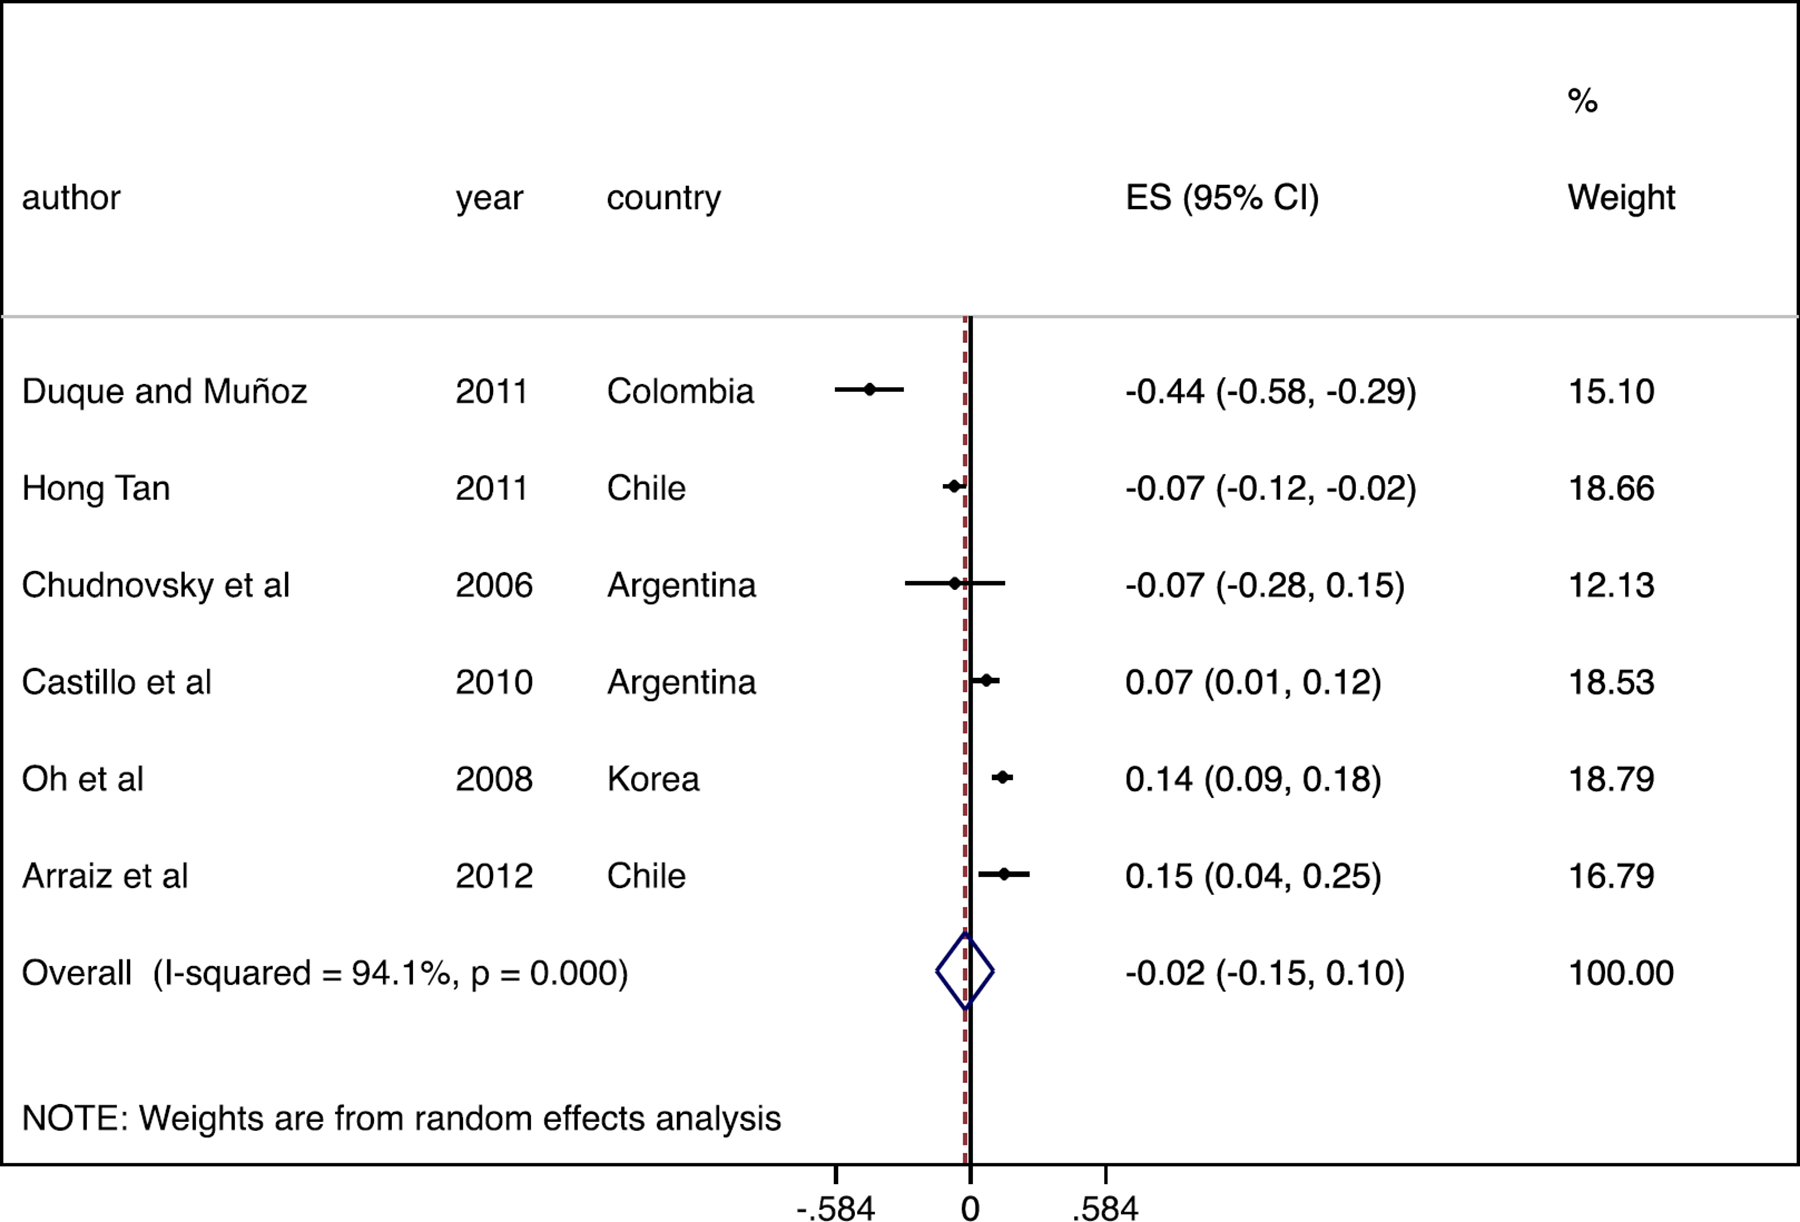
– Forest Plot – Matching grants: Labour Productivity
Secondary Outcomes
I. Exports
Figure 13 shows the distribution of SMDs of interventions that, among other things, aimed to help firms access external markets (exports). These interventions include export promotion programmes as well as matching grants that were envisaged to help firms access external markets. Most of the studies show a small and statistically insignificant effect, ranging from SMD = 0.02 (95% CI = 0.00, 0.04) to SMD = 0.037 (95% CI = -0.15, 0.89), with an outlier evaluation of a programme in Chile reporting an SMD of 4.4 (95% CI = 4.3, 4.4). Figure 14 shows that the effects of programmes conceived with the purpose to spur exports. Again, there are some positive but very small non-statistically significant effects on exports, ranging from 0.02 (95% CI = 0.00, 0.04) to 0.037 (95% CI - -0.015, 0.89).
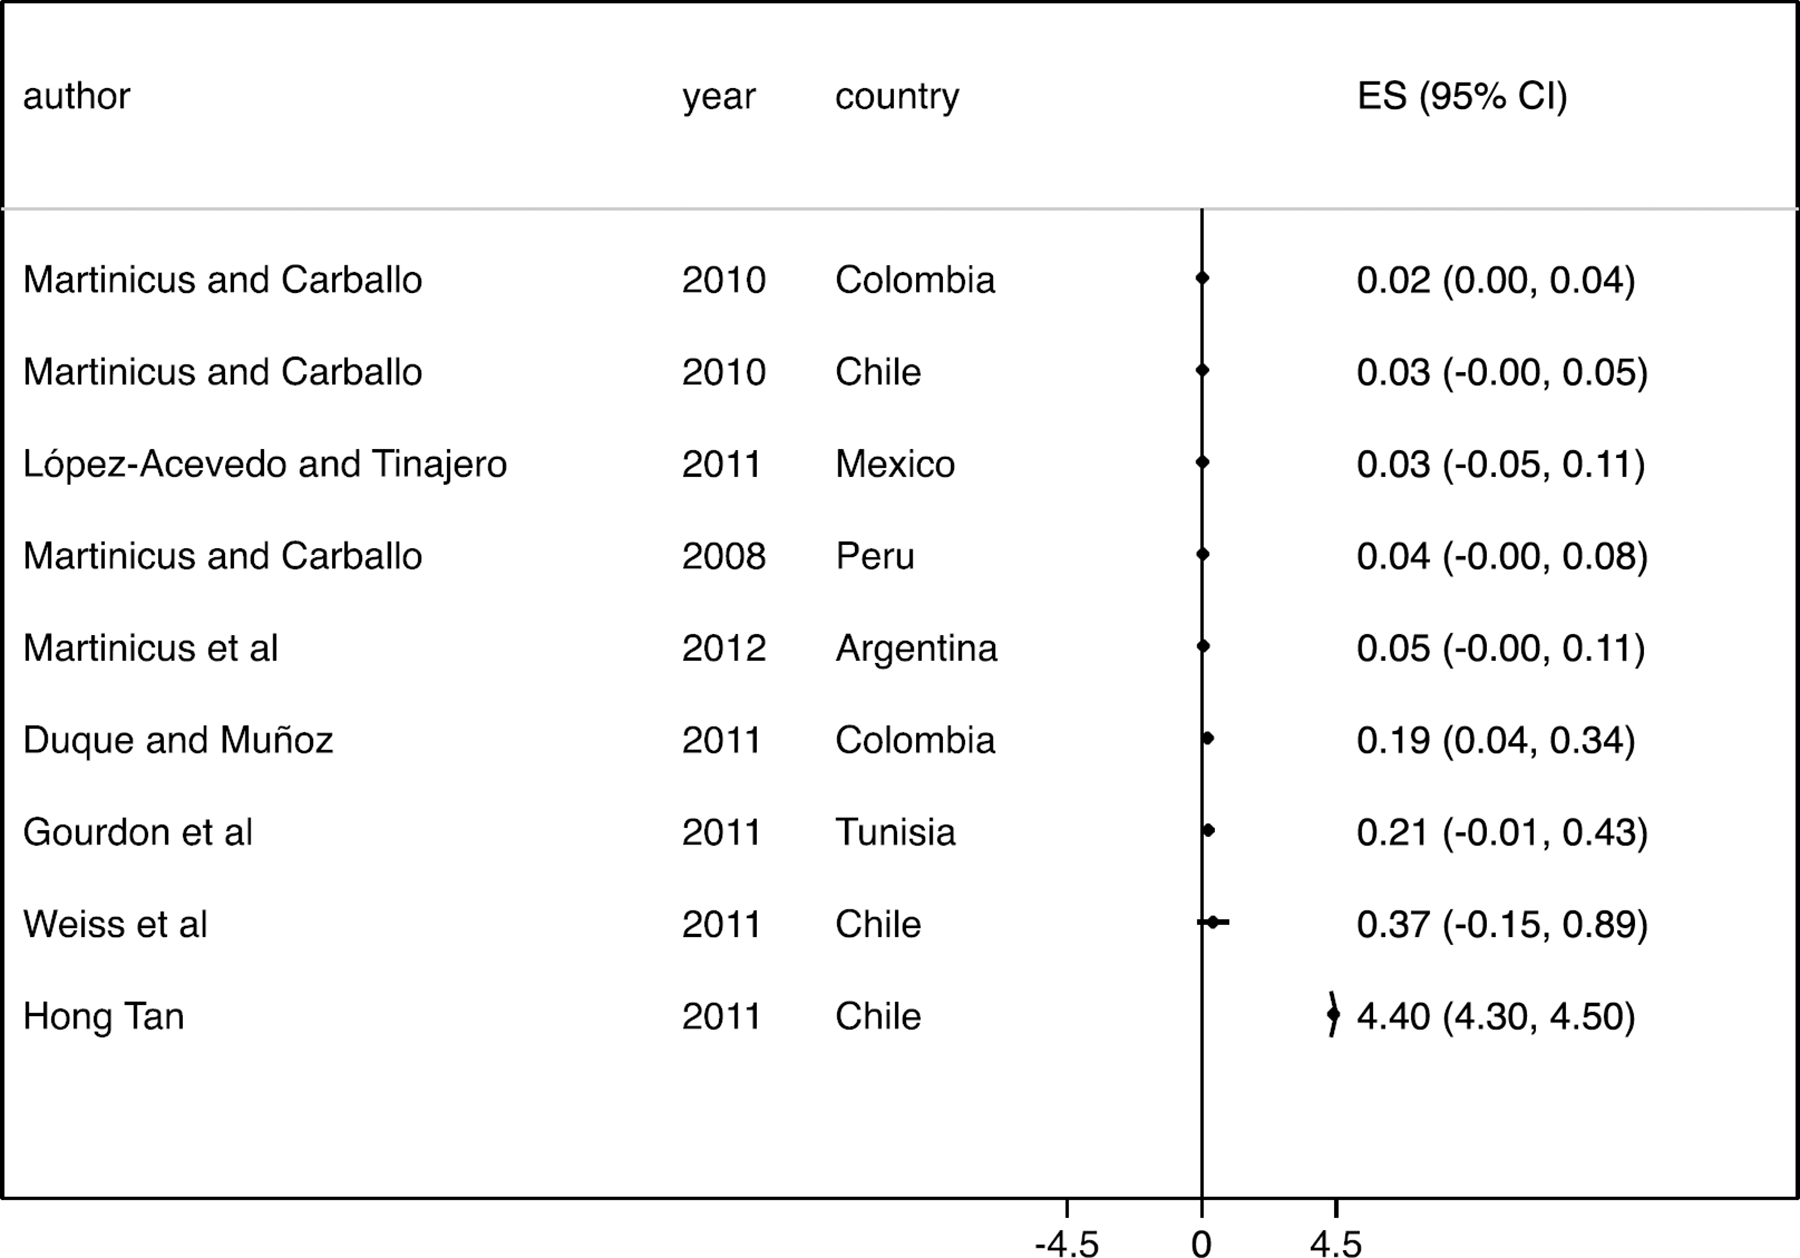
– Forest Plot – All interventions: Exports
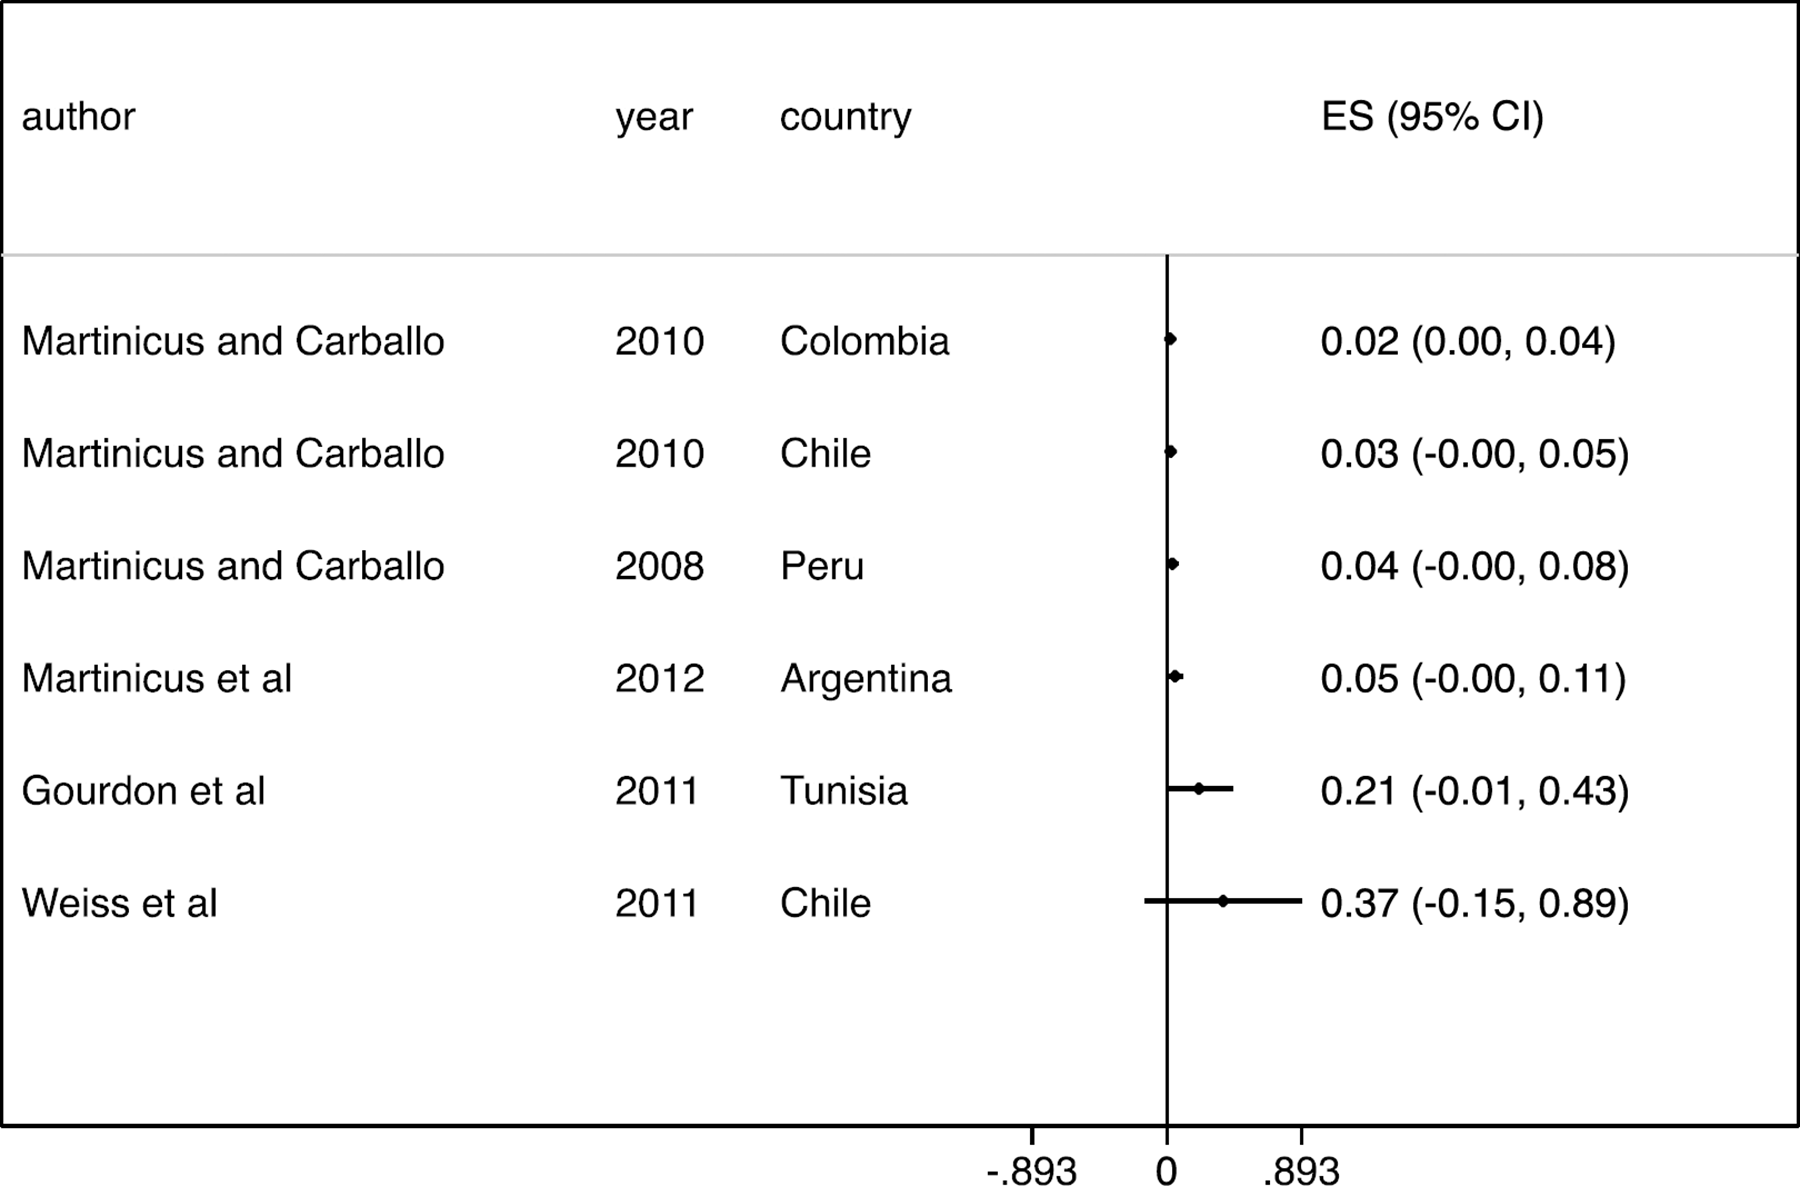
– Forest Plot – Support to export programmes: Exports
II. Innovation
Figure 15 shows the forest plot for innovation supports. The review found six ES for interventions aimed at helping SMEs to innovate. The effect sizes range from SMD = 0.00 (95% CI = -0.02, 0.02) to SMD = 0.45 (95% CI = 0.16, 0.75). Most of the studies find very small effects and those that found positive effects are imprecisely estimated. This result may go against a prevalent view that argues that SMEs do not innovate. It is also important to bear in mind that we are pooling together different programmes envisaged as helping SMEs to expand their production frontier through innovation. Thus, one should read this result carefully. This is especially important given that the overall estimates synthesise studies that use different definitions and measurements of innovation, different firm sizes, and study different country/institutional contexts.
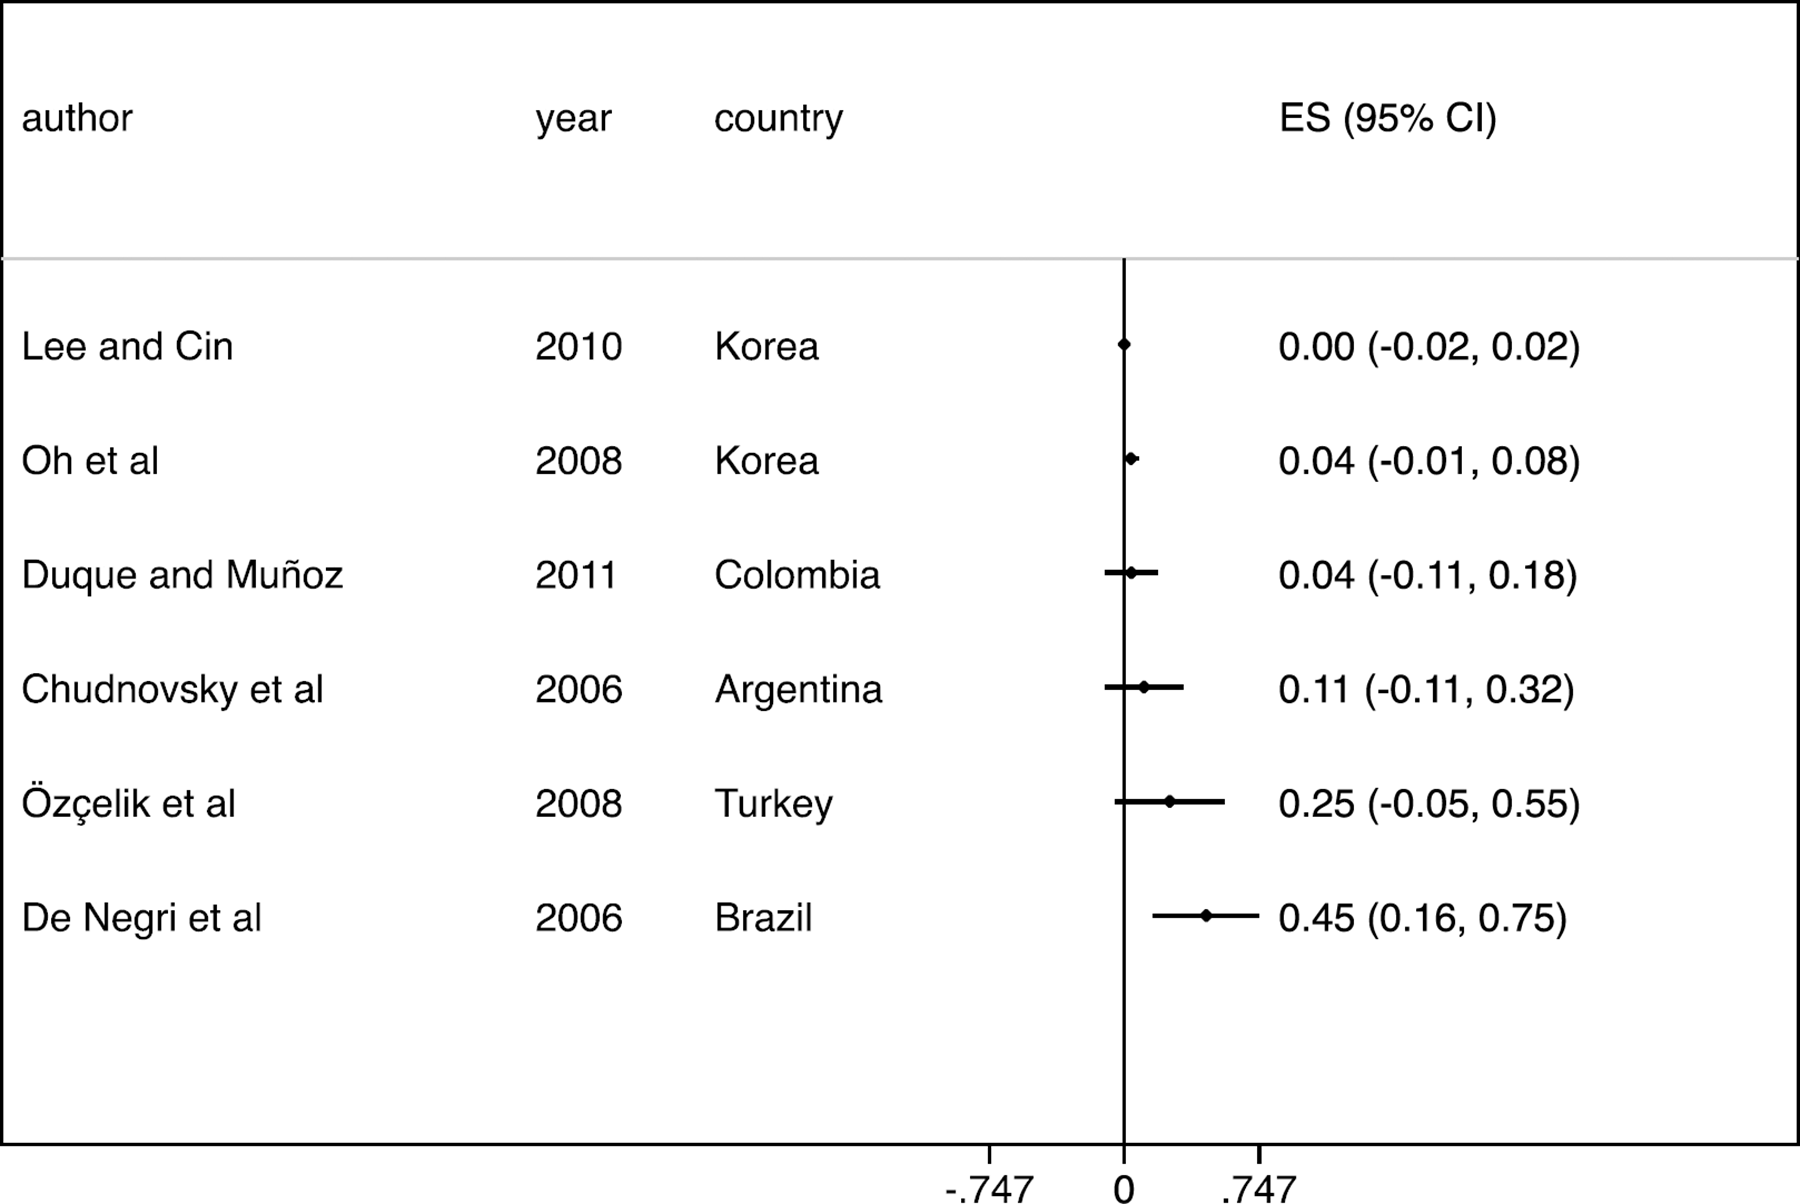
– Forest Plot – All interventions: Innovation
When attention is turned to MG interventions only, Figure 16 shows a similar pattern, that is, no effect on innovation across most included studies, with effect sizes ranging from SMD = 0.00 (95% CI: -0.02, 0.02) to SMD = 0.11 (95% CI: -0.11, 0.35).
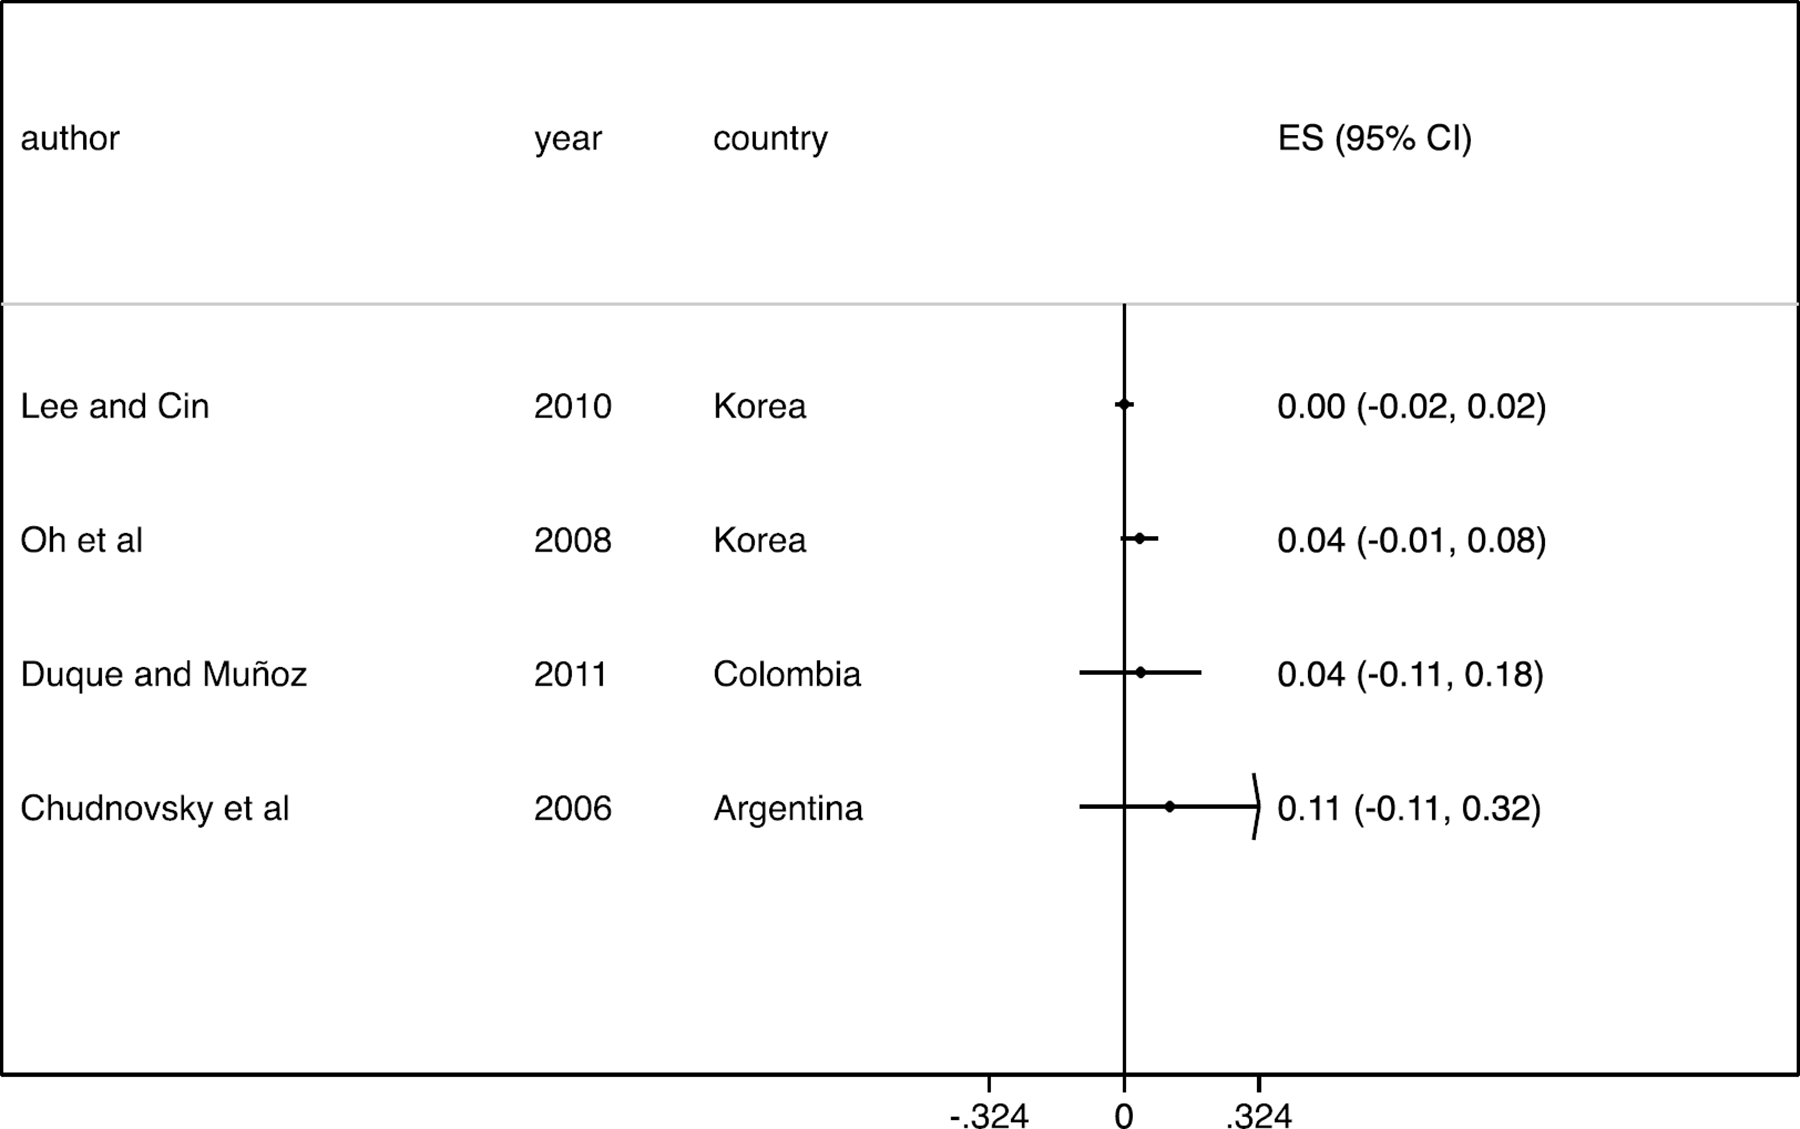
– Forest Plot – Matching grants: Innovation
The study of Benavente et al. (2007), not included in the meta-analysis because we were unable to compute either the standardised effect sizes or the adjusted standard errors present results on employment, evaluated the Chilean Technology Development Fund (TDF), the FONTEC programme. It suggests that that FONTEC's subsides promote technological upgrades and process innovations, rather than radical product innovations.
III. Investment
The average effects of business support on firms' investment are shown in Figure 17. Again, most of the effects are small and not statistically significant, while two studies showing positive and statistically significant effects for innovation programmes in Mexico (SMD = 0.22, 95% CI = 0.14, 0.29) and Vietnam (SMD = 0.23, 95% CI = 0.20, 0.25).
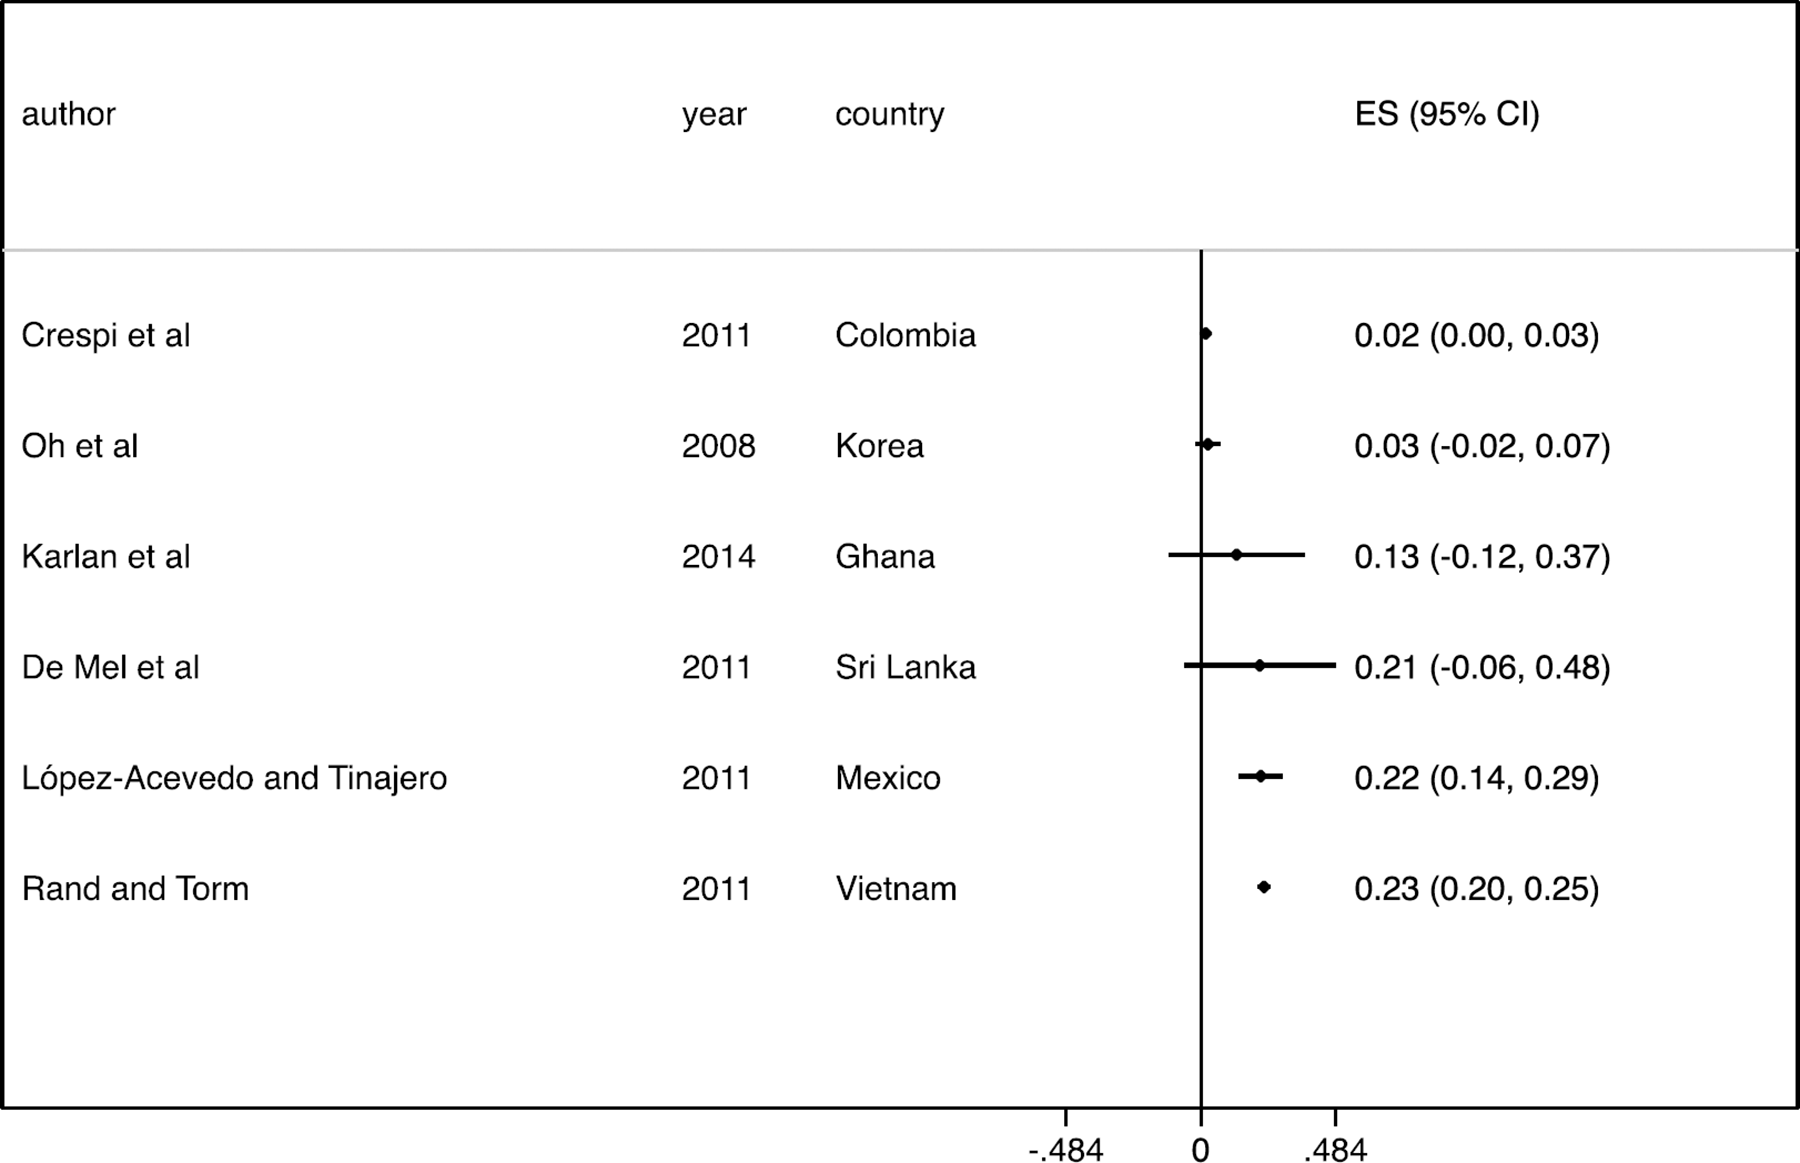
– Forest Plot – All interventions: Investment
Figure 18 shows the forest plot for MG only. Two studies have a positive but not statistically significant effect and one study has a positive statistically effect with SMD = 0.23 (95% CI = 0.20, 0.25).
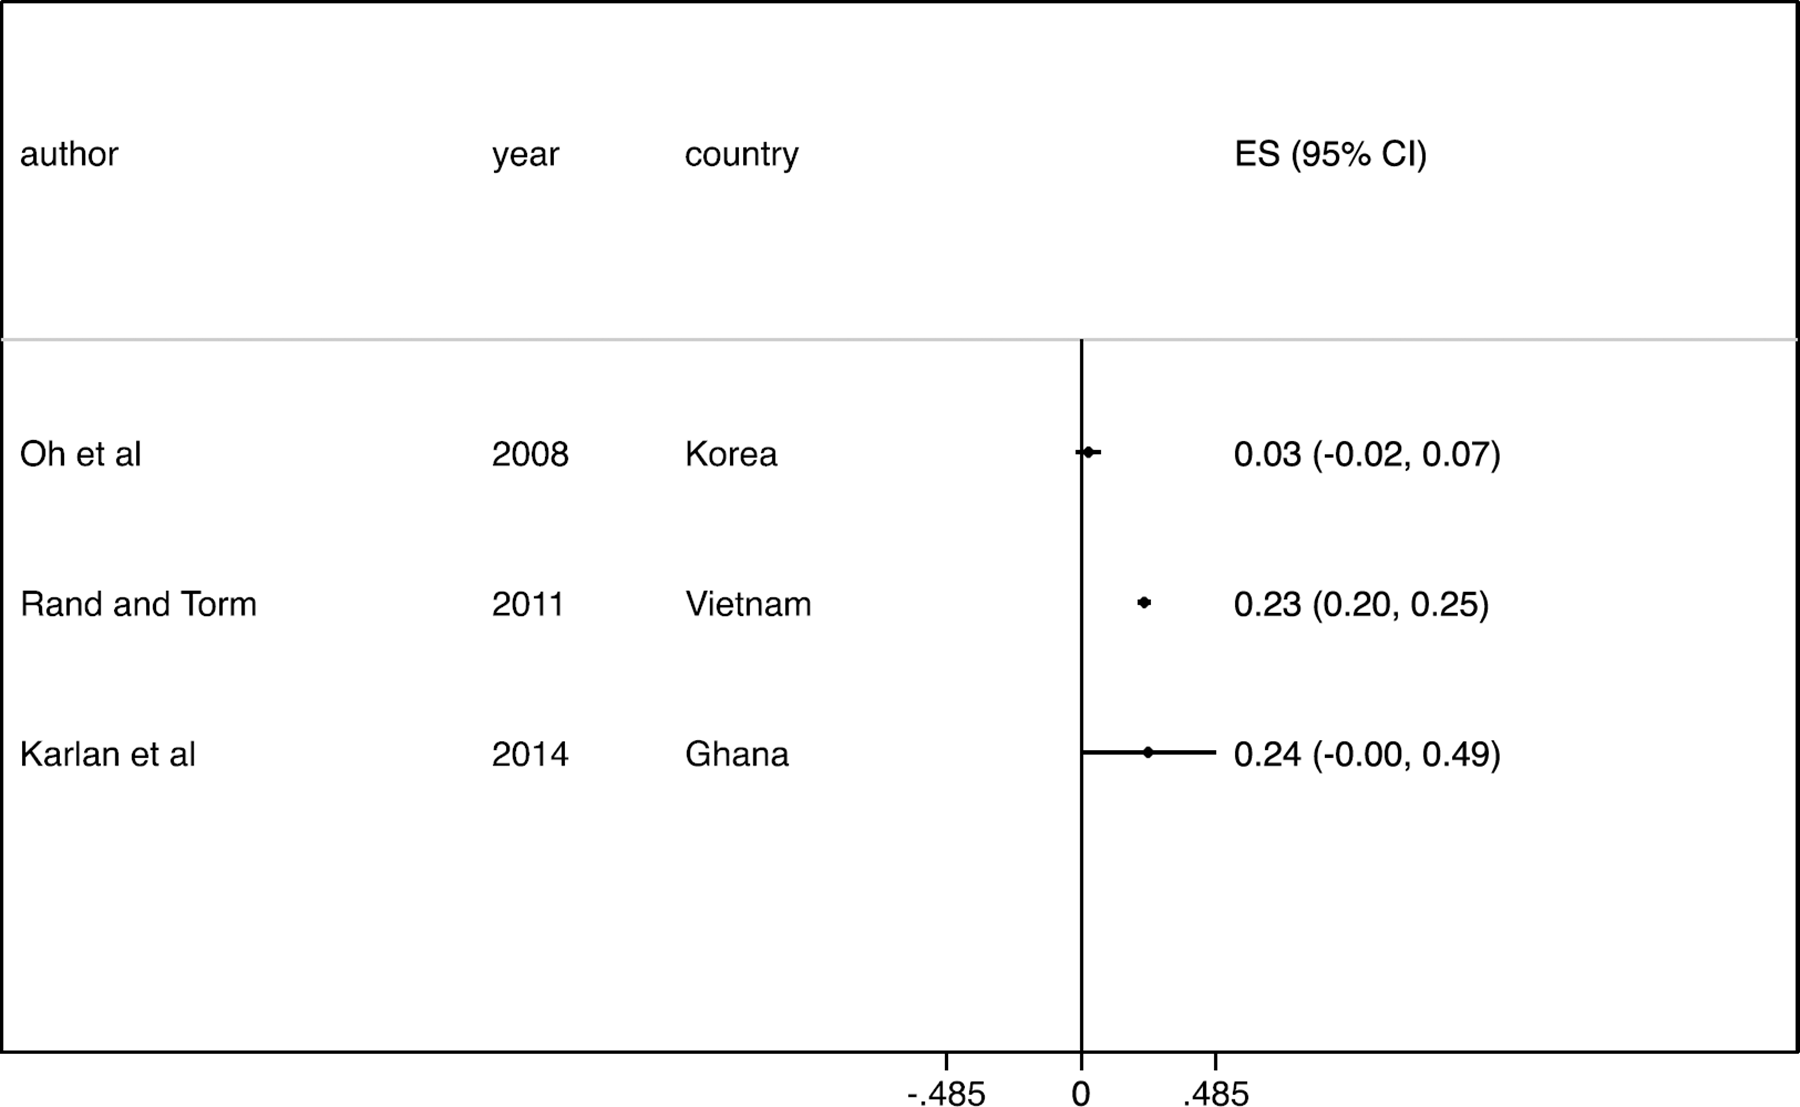
– Forest Plot – Matching grants: Investment
4.3.2 Sensitivity Analysis
This section first reports the effects for primary outcomes dropping studies that stand out as clear outliers in the forest plots based on a pre-determined definition discussed above (see footnote 35), then provides meta-regression with the following moderator variables: a dummy variable identifying Latin American countries (LAC), a dummy variable identifying African countries (Africa), a continuous variable that inform the size of a firm in terms of number of employees, a dummy variable for moderate or high risk of bias (RoB), a binary indicator for the method used (1 if RCT and *** if quasi-experimental - QE), and the secondary (intermediary) outcomes – investment, innovation and exports.
Forest Plots
A. Primary Outcomes
Figures 19 to 21 show the forest plots for primary outcomes firms' performance, employment and labour productivity respectively. Dropping the study by Duque and Muñoz (2011) reduces the magnitude of the overall effect size on firms' performance to 0.13 SD. The 95 per cent CI of (0.06, 0.20) remains almost the same. Excluding the outlier improves I-squared statistics only slightly (from 92.8% to 92.1%).
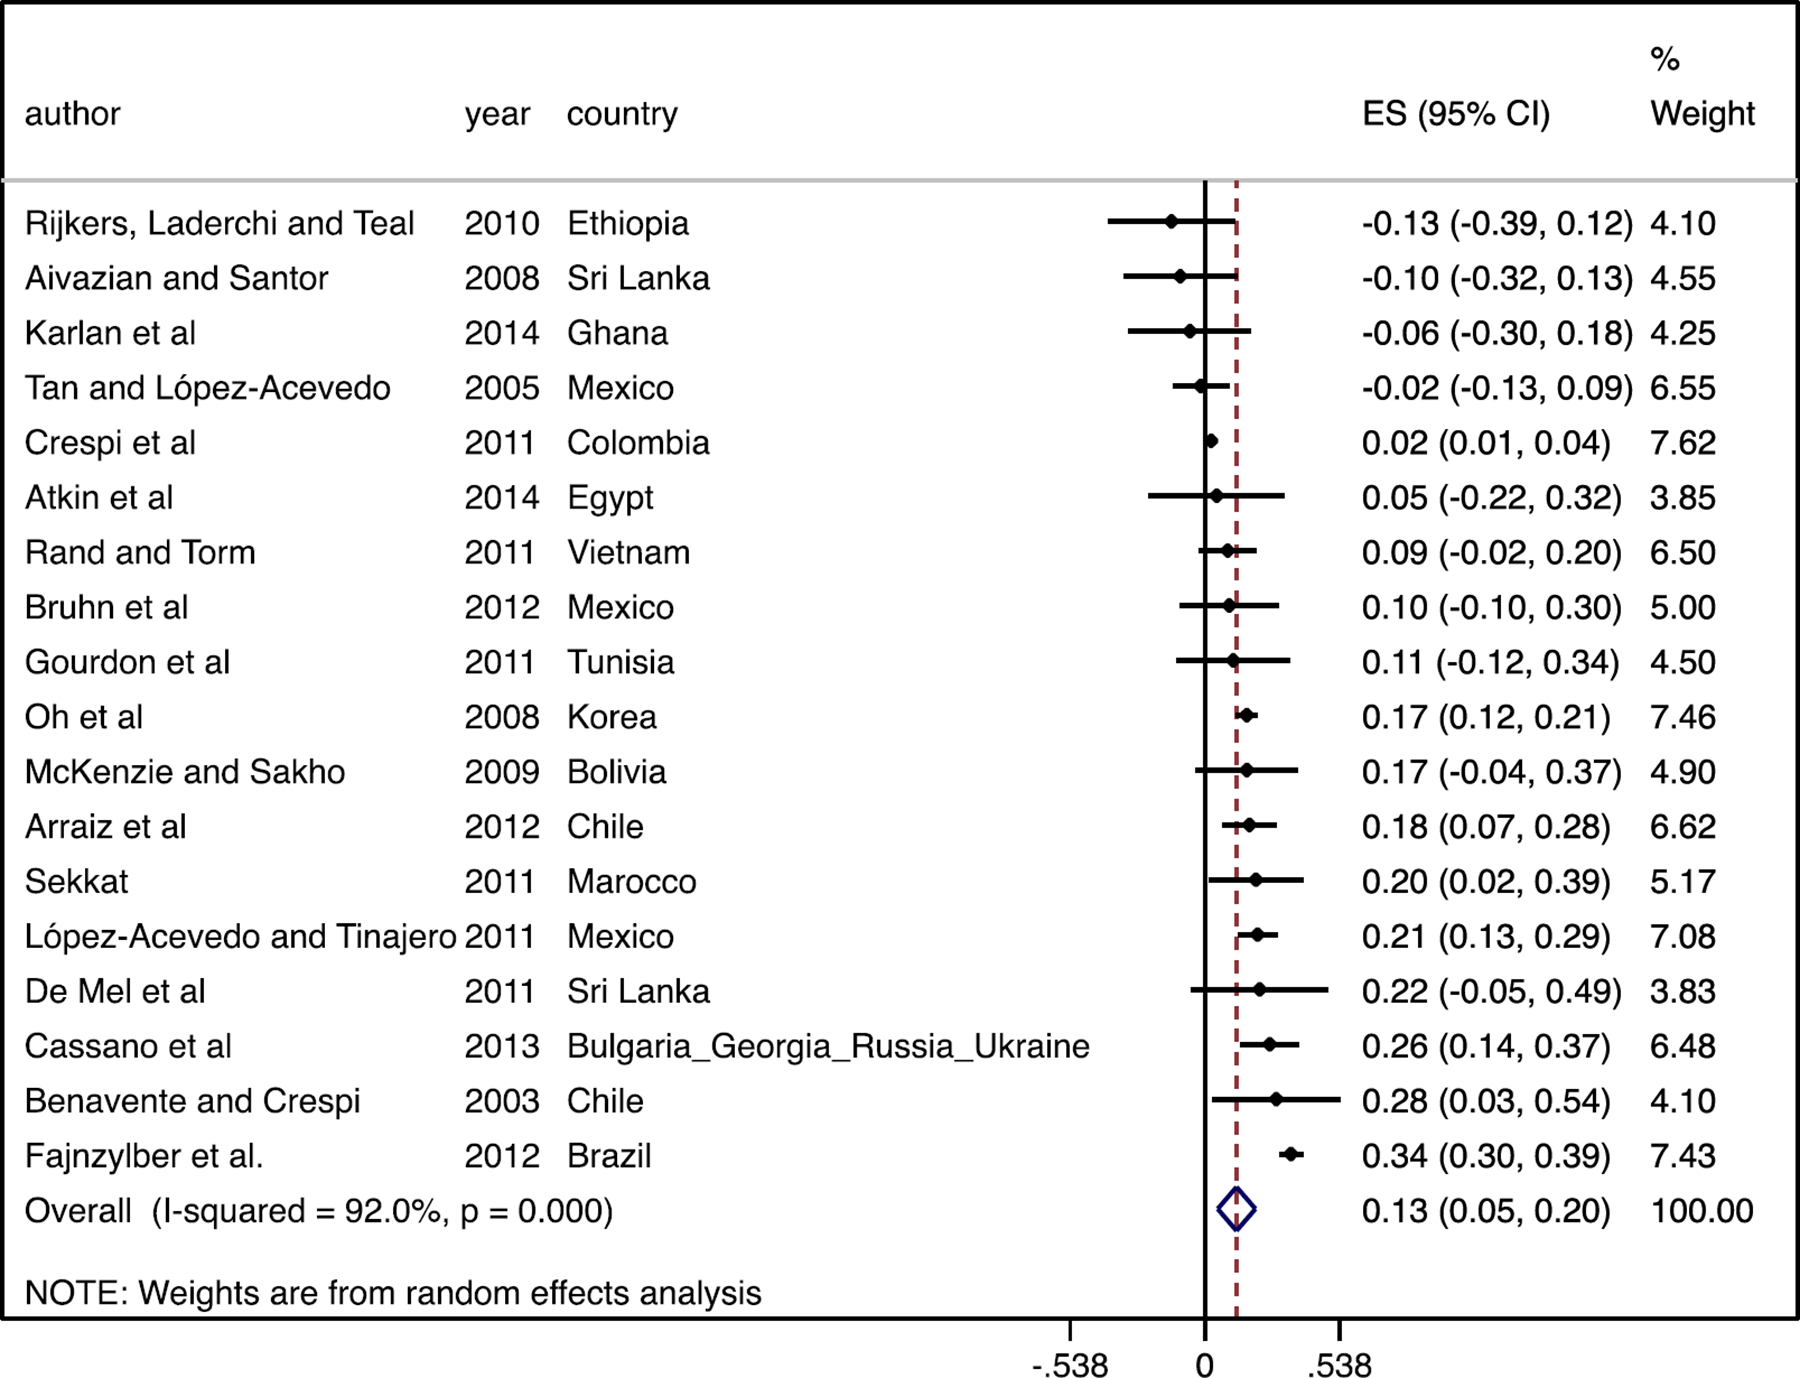
– Forest Plot – All interventions: Firm Performance – Dropping outliers
Figure 20 shows that the overall effect of business support on employment after the exclusion of Duque and Mufioz (2011). The average effect size is 0.15 SD (with 95% CI of 0.08, 0.22). The result is now highly statistically significant (p-value = 0.000). With the exclusion of the outliers there is also a gain in terms of consistency between studies' findings. Despite still being relatively high, the I-squared statistic drops from 99.1 per cent to 92.8 per cent. The Tau-squared statistic also reduces sharply to 0.013 (compared to 0.081).
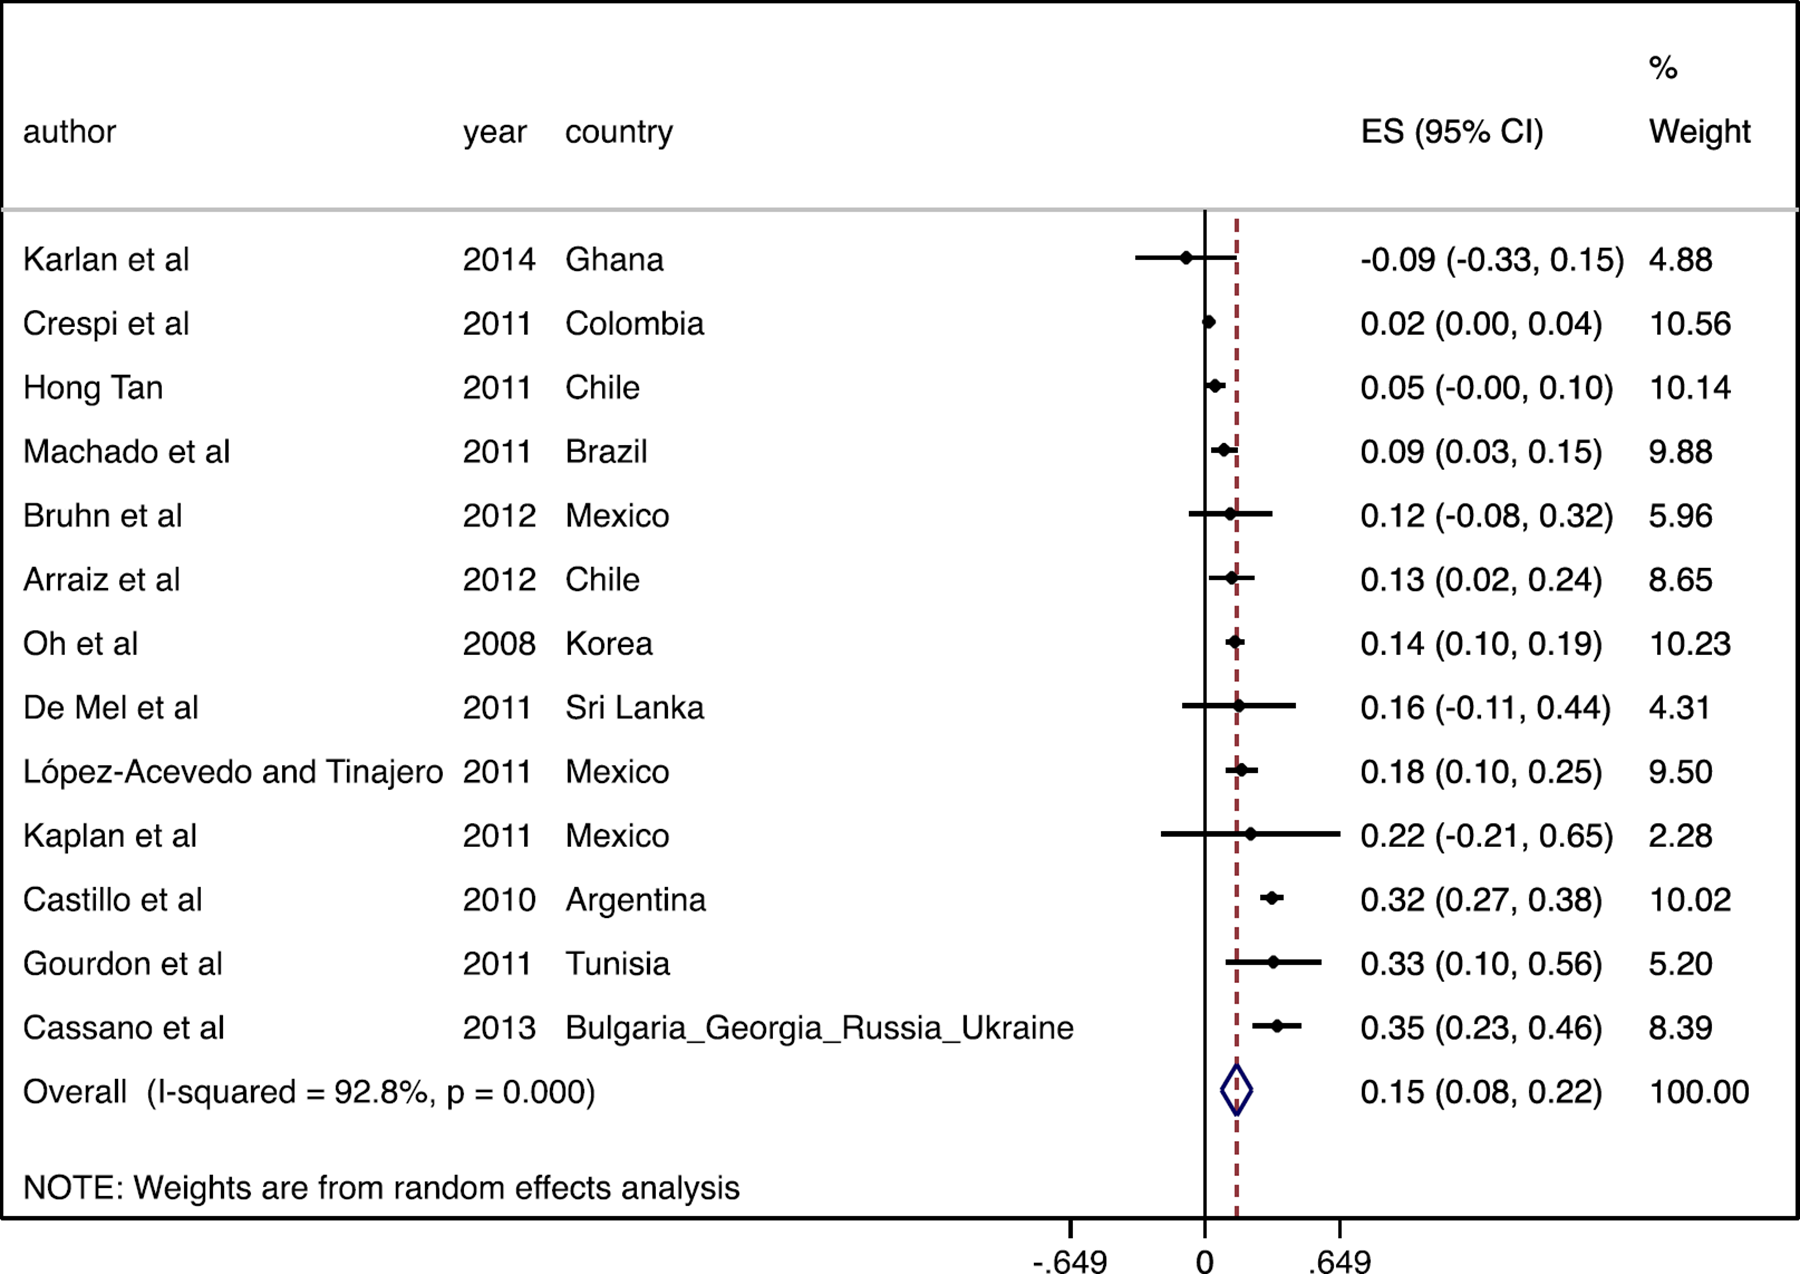
– Forest Plot – All interventions: Employment Creation – Dropping outliers
Figure 21 shows an overall standardised effect size of 0.11 with a 95 per cent CI of (0.08 and 0.15) for labour productivity once the study of Duque and Mufioz (2011) is excluded. The difference is huge compared with the previous result showed in Figure 11. It is worth noting the gain in precision due to the fall in between studies variance (Tau-squared statistic of 0.0006, I-squared of 31.3%).
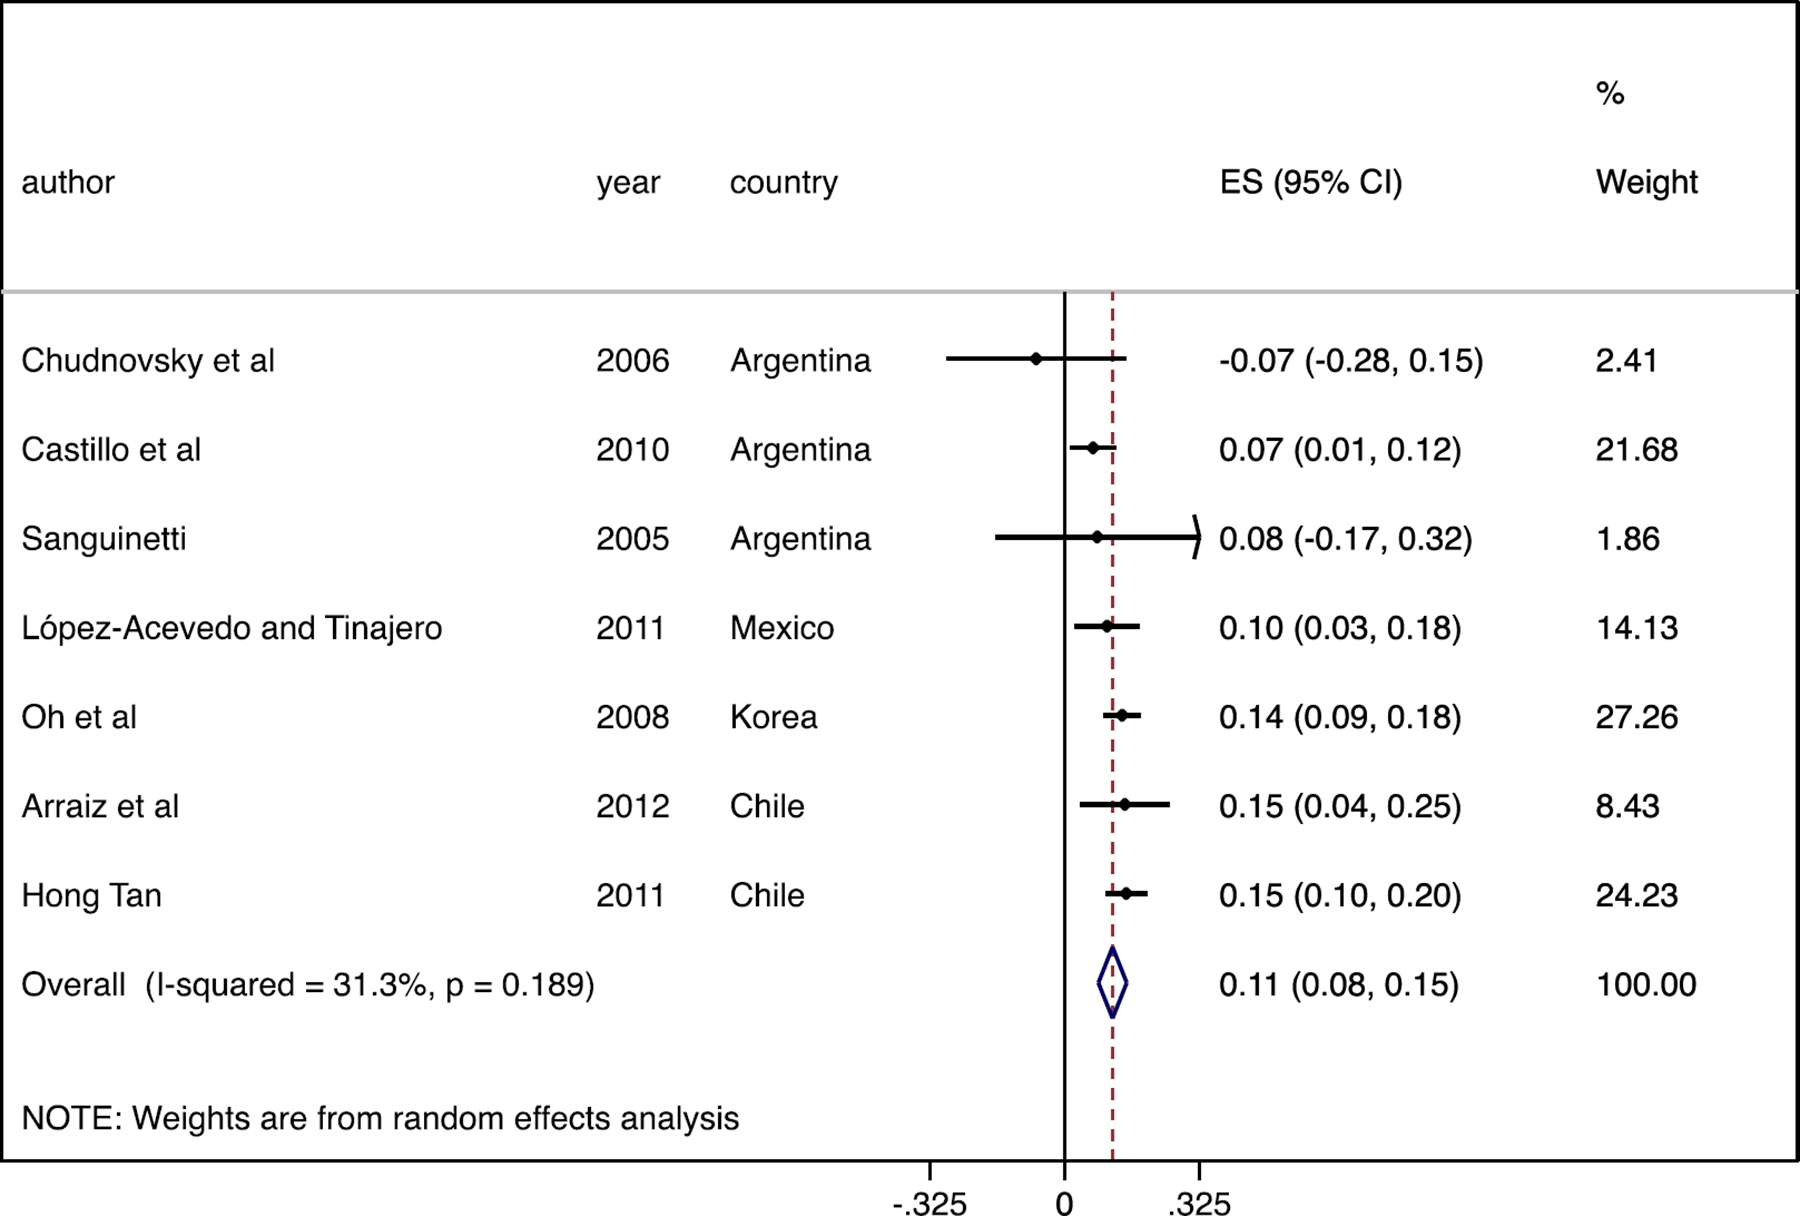
– Forest Plot – All interventions: Labour Productivity - Dropping outliers
Figure 22 shows that excluding the outlier studies – Duque and Munoz (2011) and Hong Tan (2011) – results in a positive and statistically significant (p-value = 0.000) effect of MG on firms' performance. The standardised average effect is 0.15 (95% CI = 0.08, 0.22). The heterogeneity is remains moderate with the I-squared statistic of 52.8 per cent and the Tau-squared statistic close to zero (0.004).
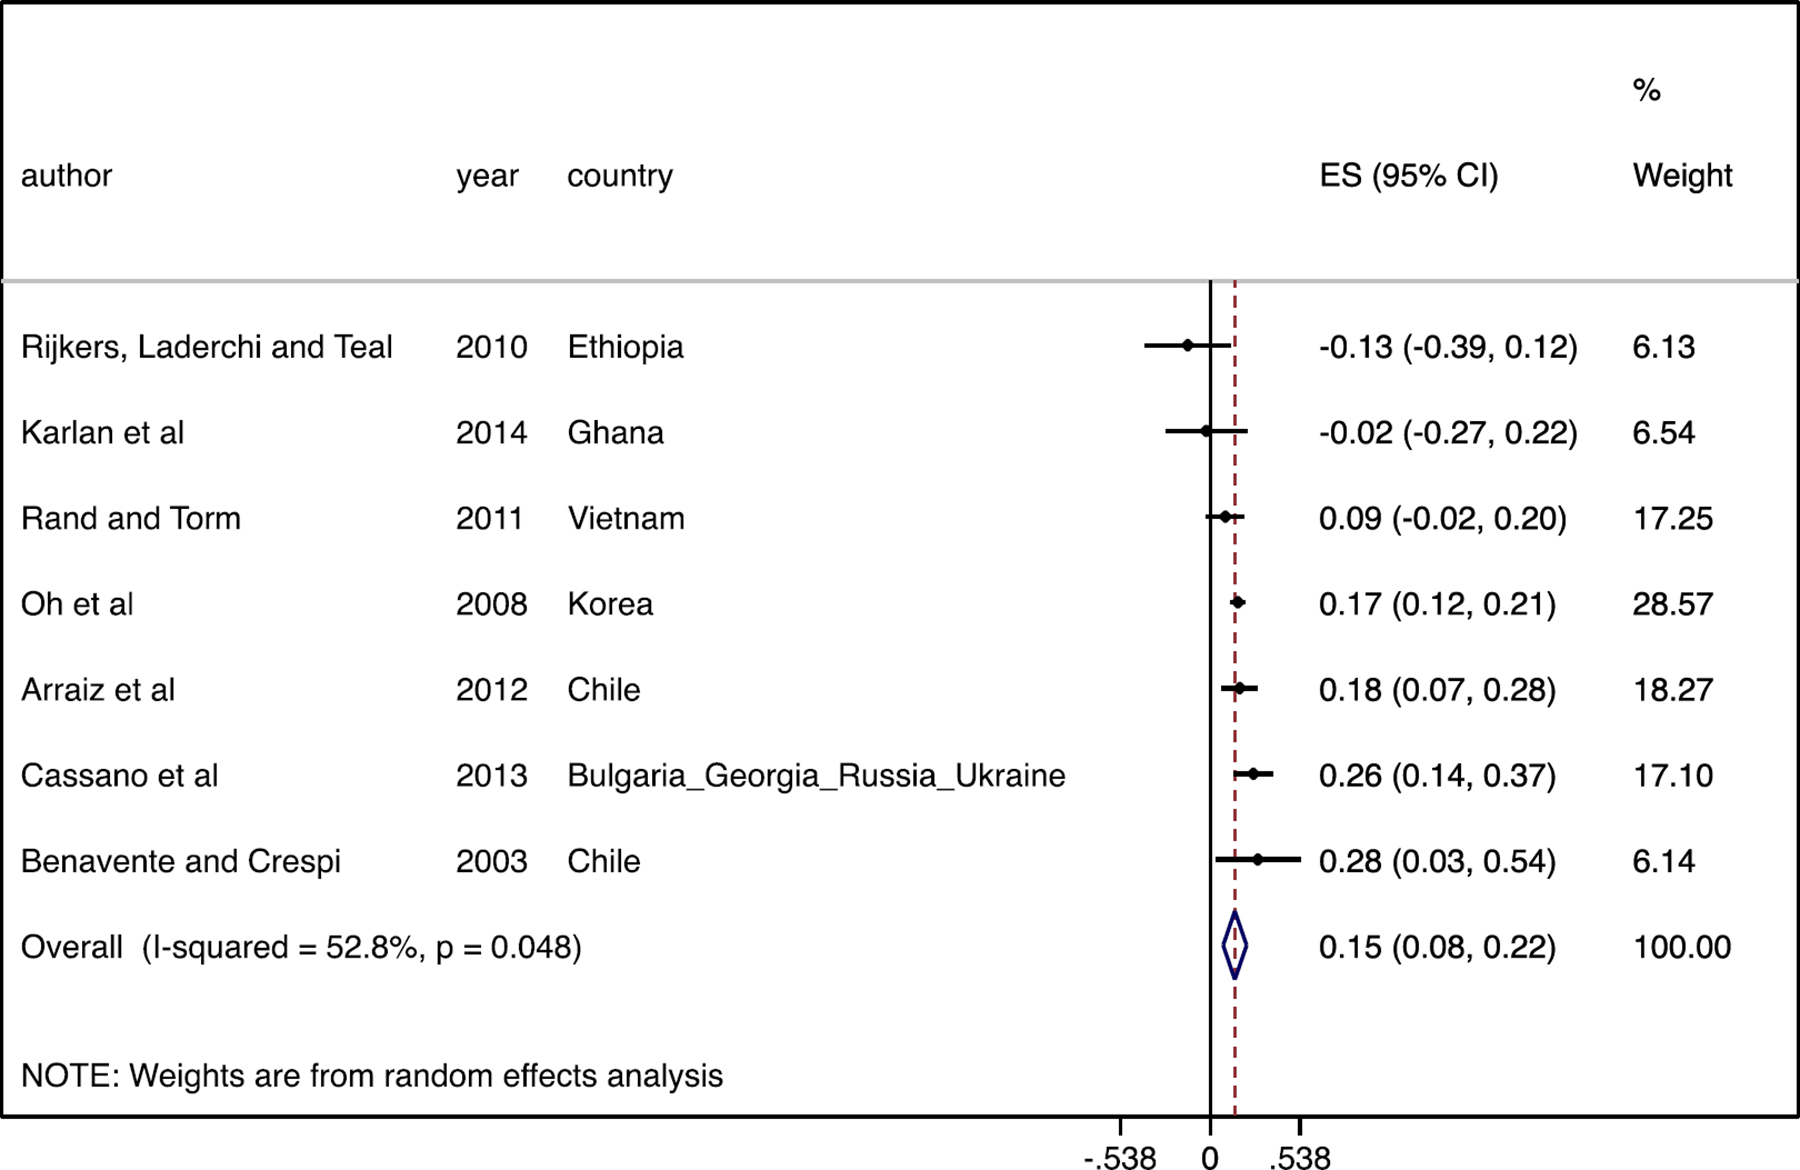
– Forest Plot – Matching grants: Firms' Performance – Dropping outliers
Figures 23 and 24 summarise the effect of MG on employment and labour productivity respectively. With exclusion of the outlier (Duque and Muñoz, 2011) the overall impact of MG on employment becomes positive 0.14 SD with a 95 per cent CI of (0.03, 0.24) – and statistically significant at 1 per cent (p-value of 0.01). The I-square (93.8%) and Tau-squared (0.018) statistics indicate that removing outliers does not result in a significant reduction in studies' heterogeneity.
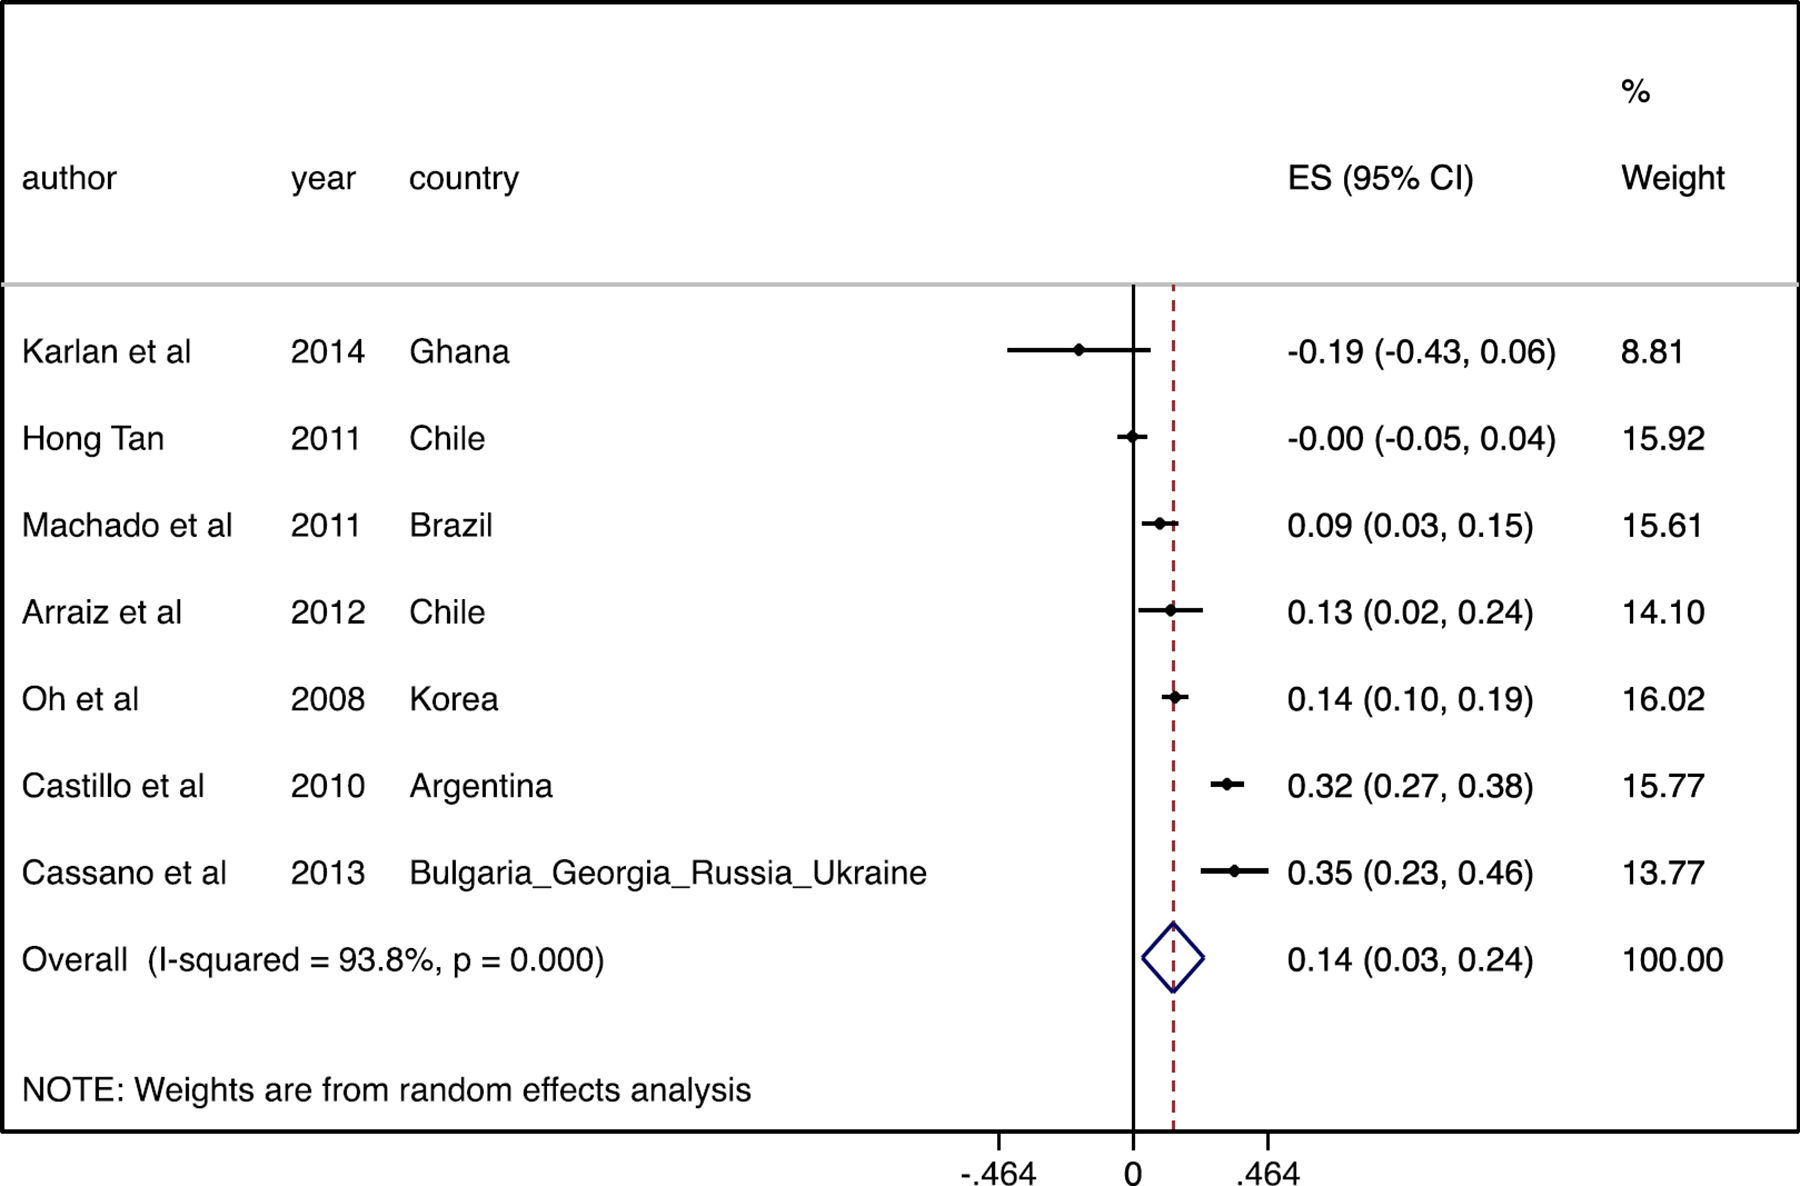
– Forest Plot – Matching grants: Job Creation – Dropping outliers
Figure 24 shows that the effect of MG on labour productivity remains indistinguishable from zero following exclusion of the outlier (Duque and Mufioz, 2011). The overall average standardised effect is now positive (0.05 of a SD, 95% CI: -0.05, 0.15) though not statistically significant (p-value = 0.31). There is a very slight gain in terms of consistency across studies' findings though a large degree of between-study heterogeneity remains. The I-squared statistic is 90.7 per cent compared to 94.1 per cent in Figure 12.
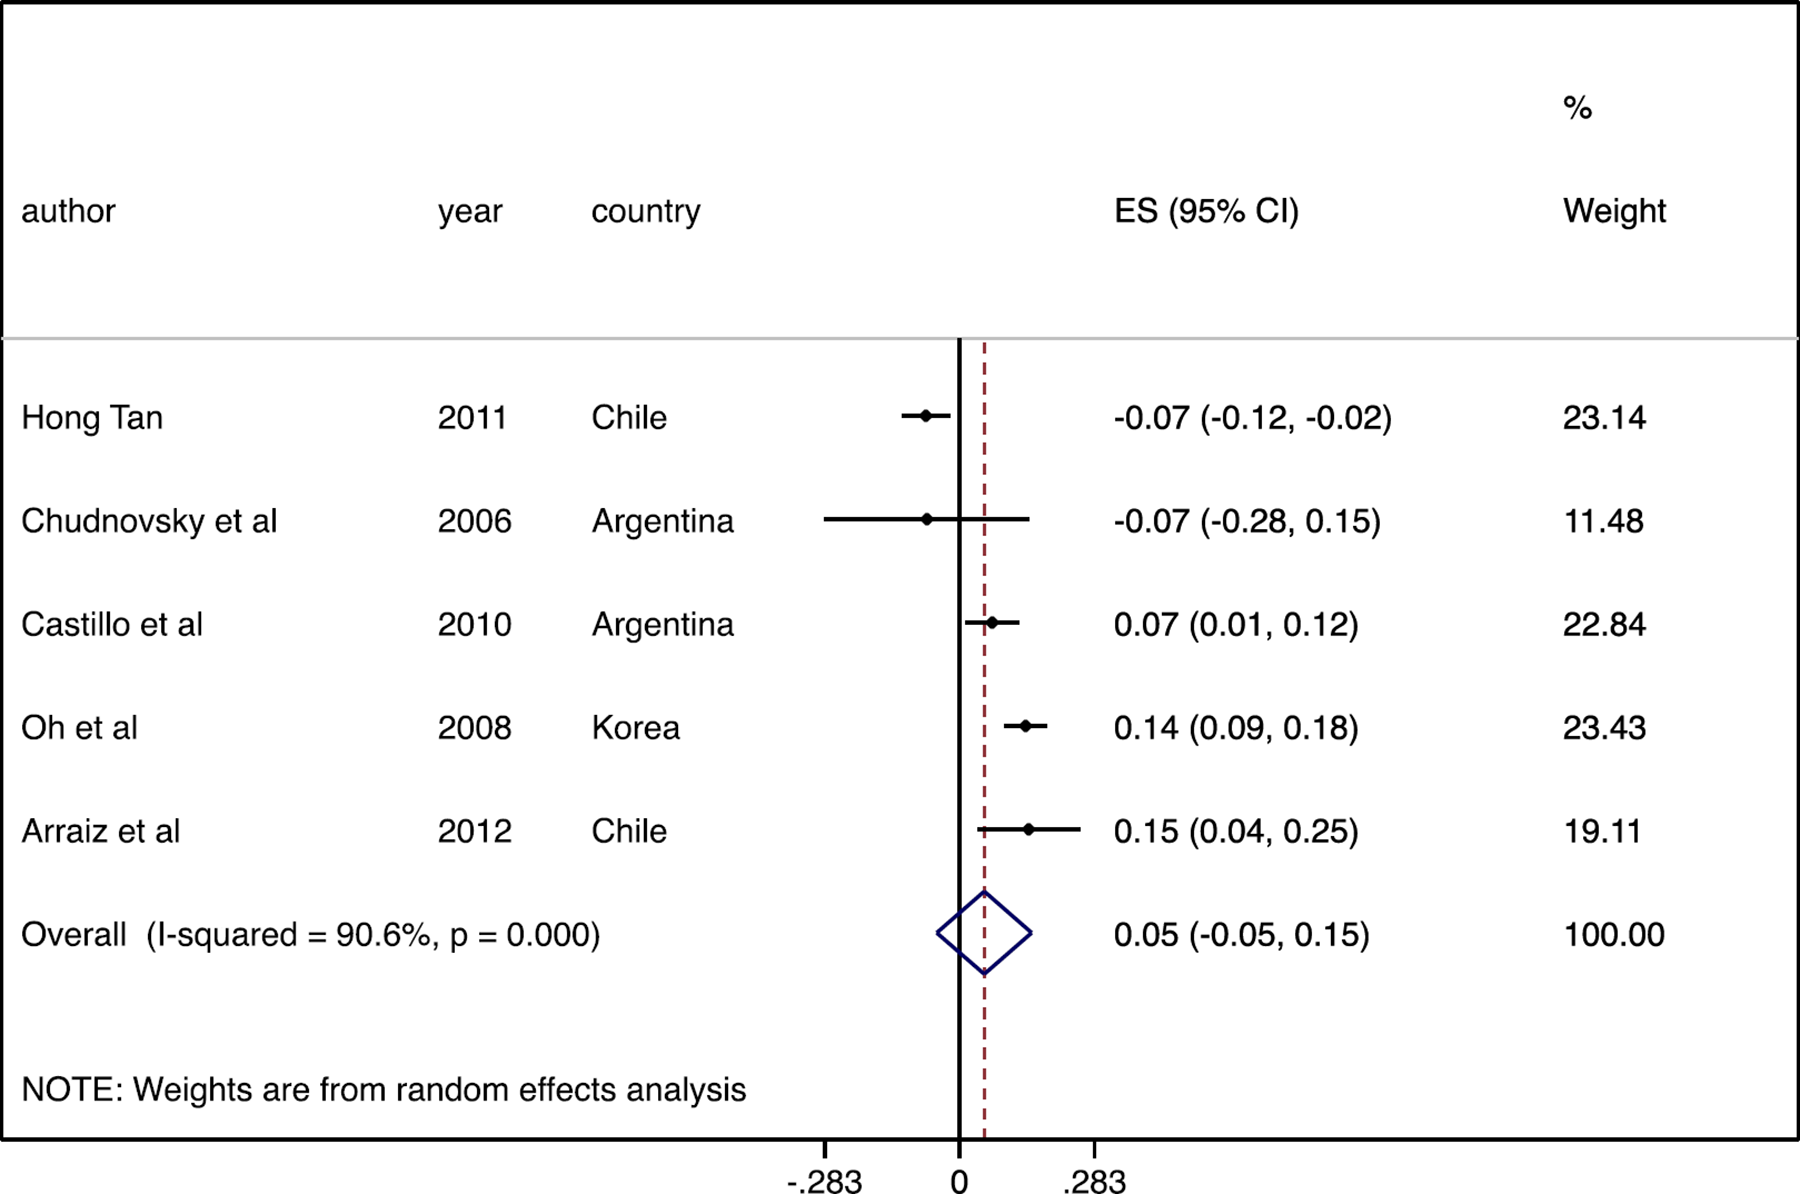
– Forest Plot – Matching grants: Labour Productivity – Dropping outliers
Meta-Regression
The analysis here concentrates on cases where an outcome has at least two reports. Where few ES per outcome (less than four) are available we were unable to control for moderator variables. Thus, only random effect estimates are shown. All the analyses below are conducted after excluding outliers.
A. Primary Outcomes
Table 4 shows the coefficients for meta-regression. The first row shows the random effects estimate without controlling for any moderator factor. The coefficients are identical to those reported in the forest plot once outliers are excluded. The first row shows the RE estimate without controlling for any moderator factor. These estimates correspond to the overall mean effect as showed in the forest plots. We then estimate meta-regression controlling for each moderator factor in separated regressions. We had to estimate each regression one-by-one due to insufficient sample size. We report the coefficient for the constant (RE when the dummy variable takes the value of zero) and the coefficient of the moderator variable in all cases. To indicate whether the coefficient is statistically significant we used p-values.
Meta-Regression for Primary Outcomes (excluding outliers)
Note: ***, **, * Statistically significant at 1, 5 and 10 percent respectively.
Given the small sample of studies, these estimates are underpowered. The lack of statistically significance should not mean that these factors are unimportant. The magnitude of the effect size and its sign can be informative in such context.
First, the coefficient of the dummy variable for LAC is positive but statistically insignificant. The estimate indicates that business support services implemented in LAC is associated, on average, with higher effects on firm performance. However, for the other two outcomes we observe the opposite, that business support services implemented in LAC are associated, on average, with lower effects on employment creation and labour productivity, by 0.06 of a SD and to 0.03 of a SD respectively. As before, the estimates are not significant in statistical terms. We have insufficient data to explore this issue further, but it could be that business support to SMEs in LAC are more capital intensive and therefore less likely to create jobs.
The estimate for the ‘Africa’ dummy indicates that SME support programmes in Africa are associated with a lower pooled effect on firm performance, but is only marginally associated with lower effect on employment creation. The differences between estimates on firm performance in LAC and Africa regions could be suggesting that, on average, business support to SMEs is more labour intensive in African countries. One cannot be assertive, but this could be reflecting differences in skills of the work force in both regions.
The size of firms may play a role in the main findings. As can be seen in the table, the random effects estimate increases in all three cases once we control for firm size, suggesting that larger firms are associated with larger impacts. The relationship might not be linear though. 43 Figure 25 shows the histogram for this variable.
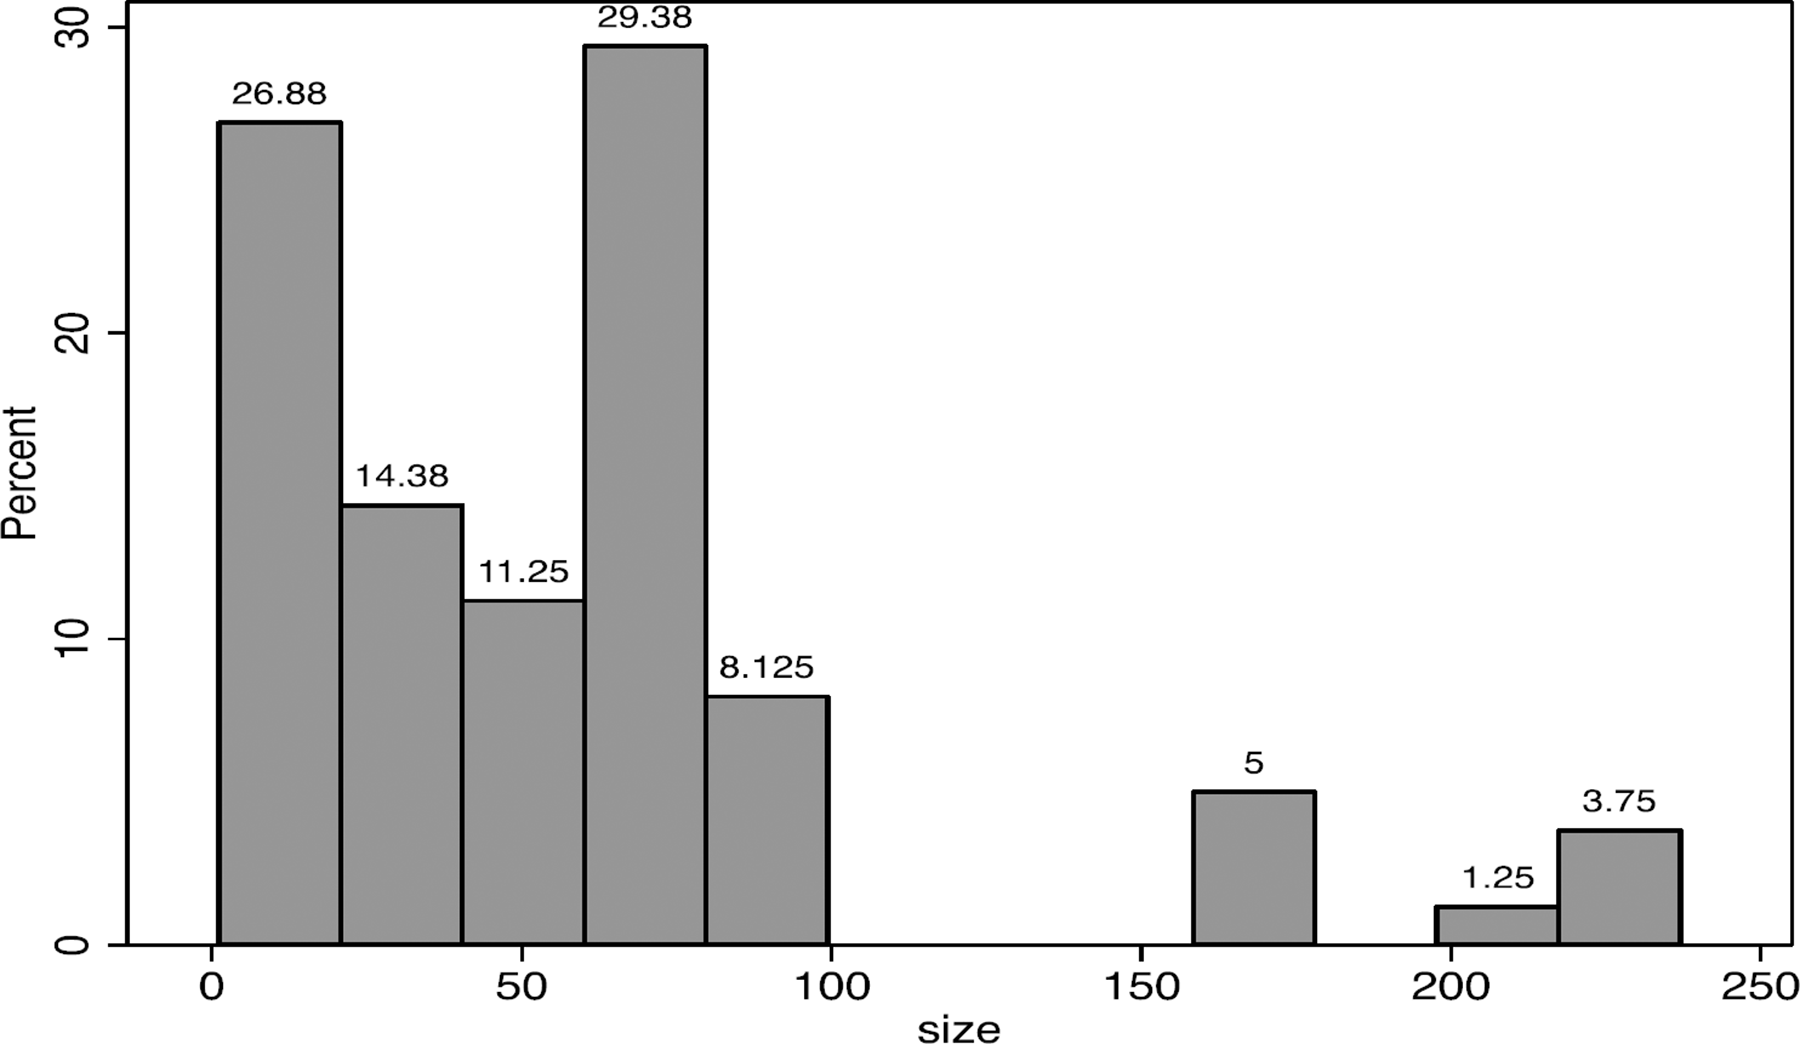
– Histogram for Average Firm Size
The figure highlights that most of the firms assessed in the studies covered by this review have fewer than 100 employees. A high percentage (25%) has no more than 10 employees (first bar). For studies covering African countries, the median size of firms is 93 and the mean is 83. This indicates that there is a larger proportion of small firms studied in Africa given the left-skewed distribution.
Table 4 shows the random effects estimates once risk of bias is controlled for. Because the dummy risk of bias takes the value of 1 for studies with a high risk of bias, the significant reduction in the magnitude of the effects indicates that high-risk studies tend to show more positive results on firms' performance than studies with low or moderate level of bias. The same holds for employment creation, but not for labour productivity. In fact, once a dummy for risk of bias is added to the model, the effect on employment turns statistically insignificant. One could interpret these results as a signal that the most rigorous studies have not found effects of business interventions on these firms' performance and employment creation, and therefore with so few good studies out there any conclusion regarding the effect of such interventions is still premature.
Finally, the coefficient of the dummy variable that informs the method used (one for RCT and zero for quasi-experimental methods), suggests that the RCTs included in this review were less likely to find positive effects on firms' performance and employment creation. We believe that this might be in part due to the scales of the programmes evaluated. Studies using quasi-experimental methods usually rely on administrative datasets with thousands of observations whereas RCTs might test programmes in their pilot stages.
Table 5 replicates the exercise only for MG interventions.
Meta-Regression for Primary Outcomes Matching Grants (Exclude Outliers)
Note: ***, **, * Statistically significant at l, 5 and 10 per cent respectively.
The results for firm performance are qualitatively similar to those presented in Table 4, but few estimates stand out interestingly. First, the coefficient of the dummy ‘Africa’ is large and negative in the first column, suggesting that MG programmes in Africa is associated with worse performance of firms.
On the other hand, the coefficient for Africa region is positive and relatively large for employment creation. This suggests that MG in African countries were more likely to create jobs. This is consistent with the hypothesis that African firms' production function may be more labour intensive (than LAC, for instance), and that they likely work at relatively low scale hence the scope to grow through addition of labour inputs.
As expected, the coefficient for size of firms is positive and large. This might be picking a mechanical effect since firms' size is measured as number of employees. This would explain the relatively large effect on labour productivity as well.
MG programmes that aimed at improving firms' capacity to export and innovate showed positive effects on firms' performance and employment creation, but negative on labour productivity. This result is a bit puzzling and we interpret it as an indication that firms targeted by the type of interventions covered in this review were likely facing some constraint to increase output beyond the variable cost associated with extra hired labour. This could also reflect some distortion in case an intervention somehow incentivised firms to create jobs (e.g. unpaid jobs through employment of family members) through different forms of subsidies (e.g. wage subsidy).
Finally, the coefficient for the variable ‘investment’ was negative for employment creation. Our interpretation is that the investment made by these firms was toward addition of capital goods.
In a nutshell, these findings suggest that matching grants serve different firm composition and business purposes. Export-oriented firms for example need to become more efficient to be able to compete in the external market while labour intensive firms may use matching grants to hire extra labour.
B. Individual Interventions
Table 6 shows random effects estimates for individual interventions. The table reports the coefficient, t-statistic, p-value and number of studies (reports) for each primary outcome. As can be seen, when we look at interventions individually we can see how little we still know about the impact of each of these policies. In many cases there are only two reports per outcome.
Since the sample size is small in all cases, the estimates lack power. So, as before, we concentrate on the magnitude of the effect sizes that are statistically significant. The overall picture suggests that most interventions may affect outcomes positively. Disregarding issues such as risk of bias, the first column suggests that tax simplification and matching grants programmes seem to be the most significantly effective to improve firms' performance indicators and to create jobs. In contrast, technical assistance does appear to lead to big effects for firm performance, employment and labour productivity in magnitude although never statistically significantly (probably due to the small number of studies which have assessed these programmes).
Meta-Regressionfor Individual Interventions
Note: ***, **, * Statistically significant at l, 5 and 10 per cent respectively.
4.3.3 Publication bias
This section uses funnel plots and Egger's tests to check whether there is any indication of publication bias. Figure 26 (below) plots the effect size (SMD) on the horizontal axis and the standard error of the effect size (SE SMD) on the vertical axis. The solid line crosses the horizontal axis at the overall average fixed effect estimate. Although most of the dots (studies) are spread around the solid line and within the triangle area (95% CI), there are quite a few cases of studies on the right side of the triangle area, which are not symmetrically represented on the left side.
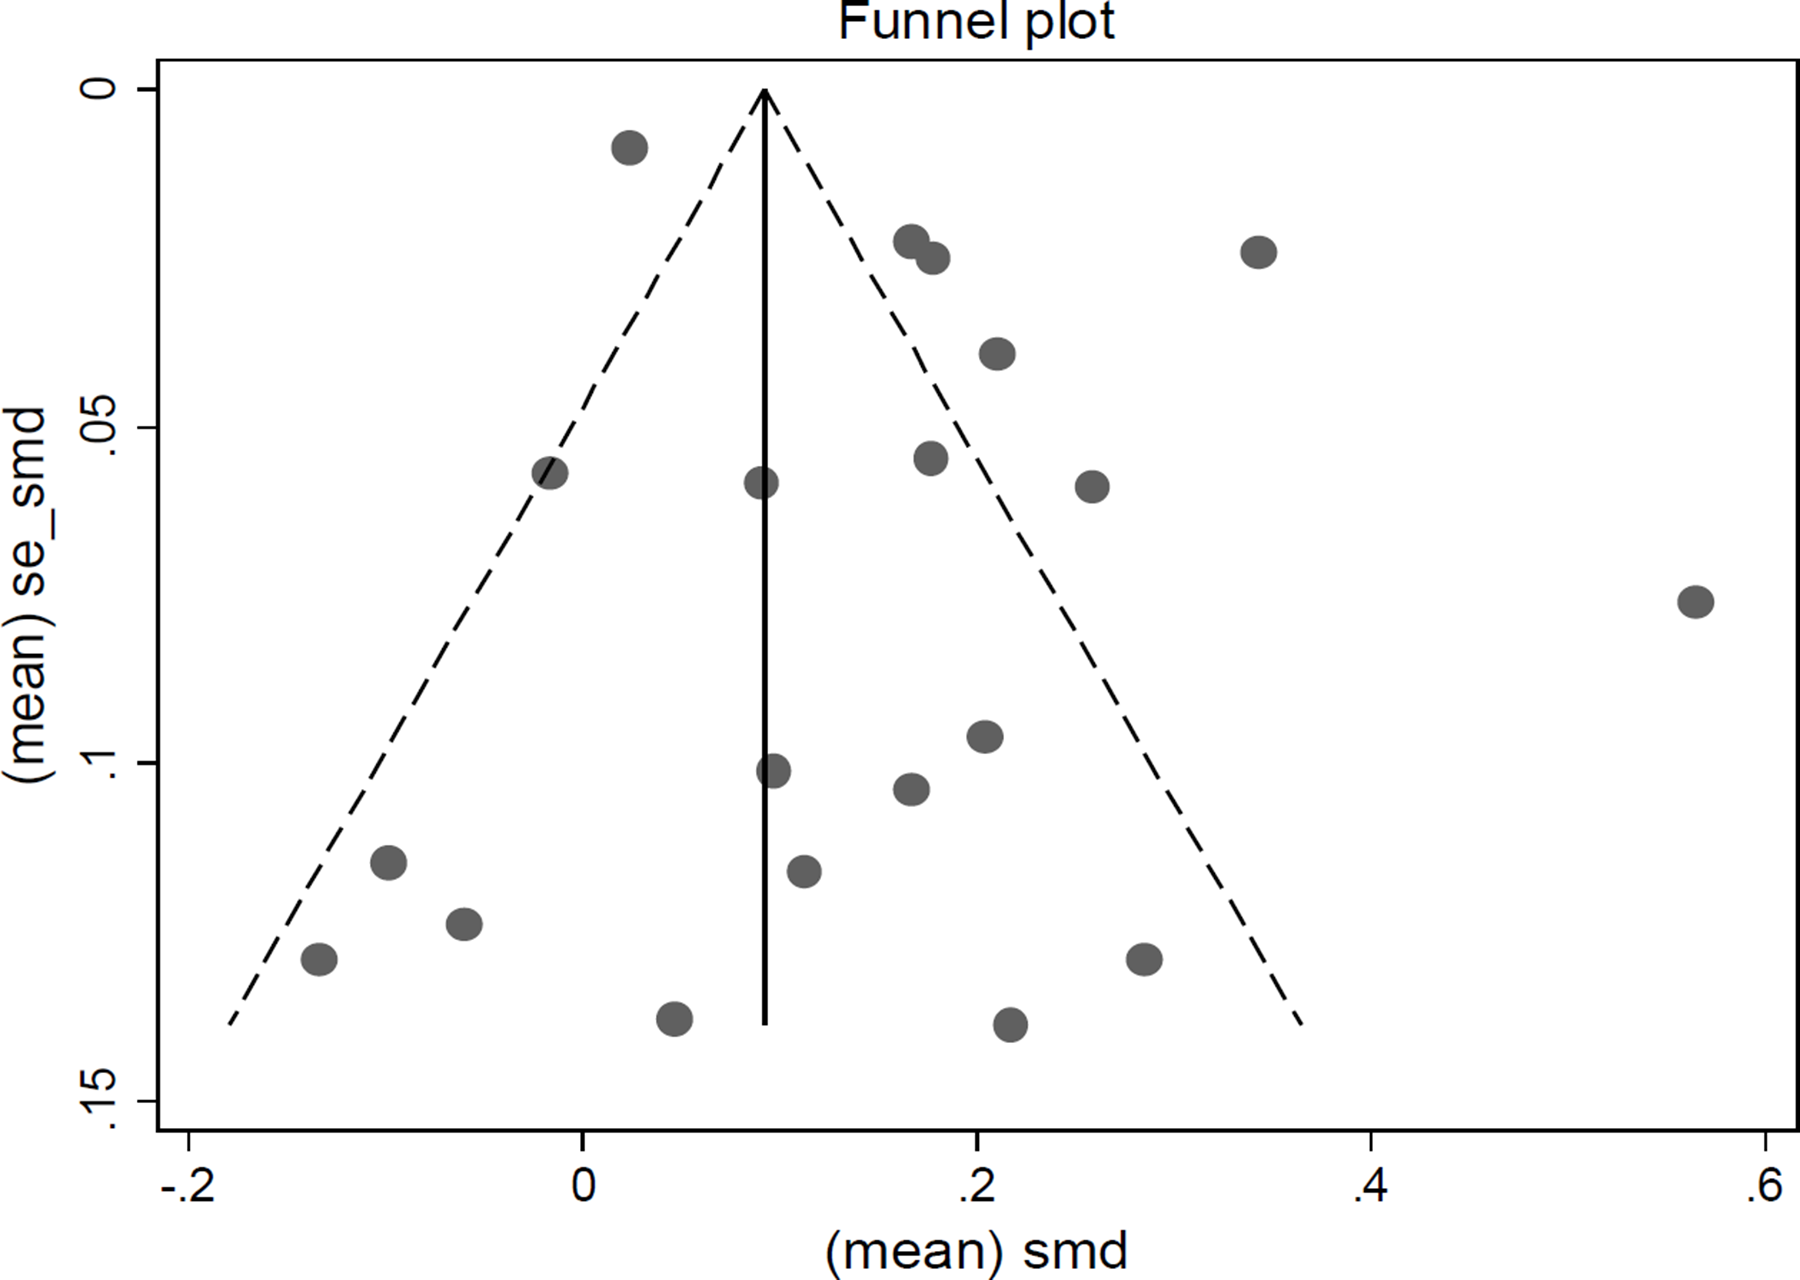
– Funnel Plot for Firm Performance
These studies report positive effects and seem to have mixed level of precision. We also performed Egger's test for publication bias using the metabias command in Stata. The first column in
The funnel plot for employment outcome is shown in Figure 27.
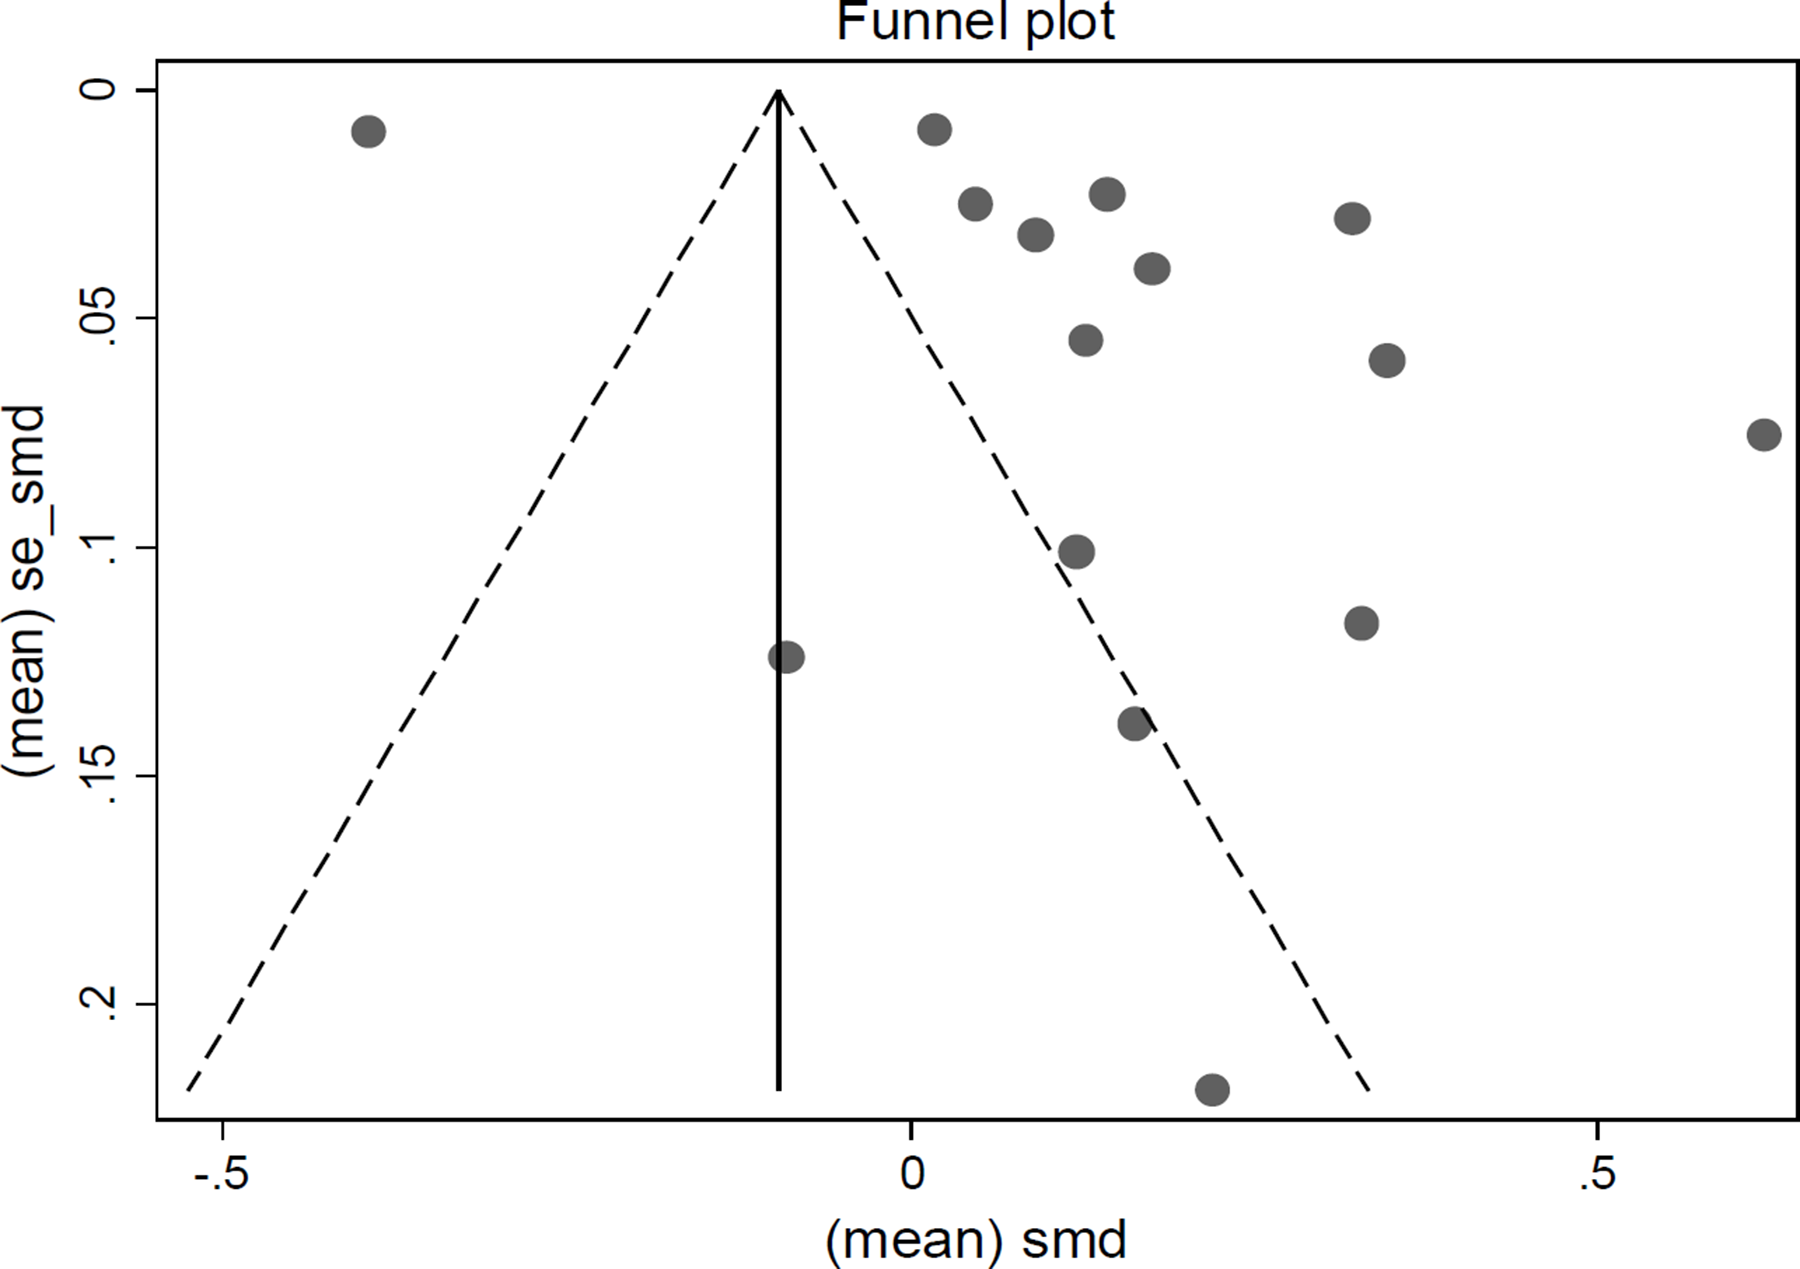
– Funnel Plot for Employment Generation
Most of the dots are scattered on the top and outside the 95 per cent CI. The solid line crosses the horizontal axis at the fixed effect estimate. Note how different the fixed effect estimate is when compared with the random effects estimate reported in the forest plots. Egger's test is shown in the second column of Table 8. As can be seen, there is an indication of publication bias towards positive results. The coefficient of the variable bias is positive (7.14) and statistically significant at 9 per cent (p-value = 0.084) for employment creation.
Figure 28 shows the funnel plot for labour productivity. The figure shows most of the dots concentrated on the top, on the positive quadrant and within the 95 CI interval. The Egger's test in the third column of Table 8 shows that the coefficient for the variable bias is negative and statistically insignificant. We observe a very similar pattern for MG programmes as is shown in Table 8.
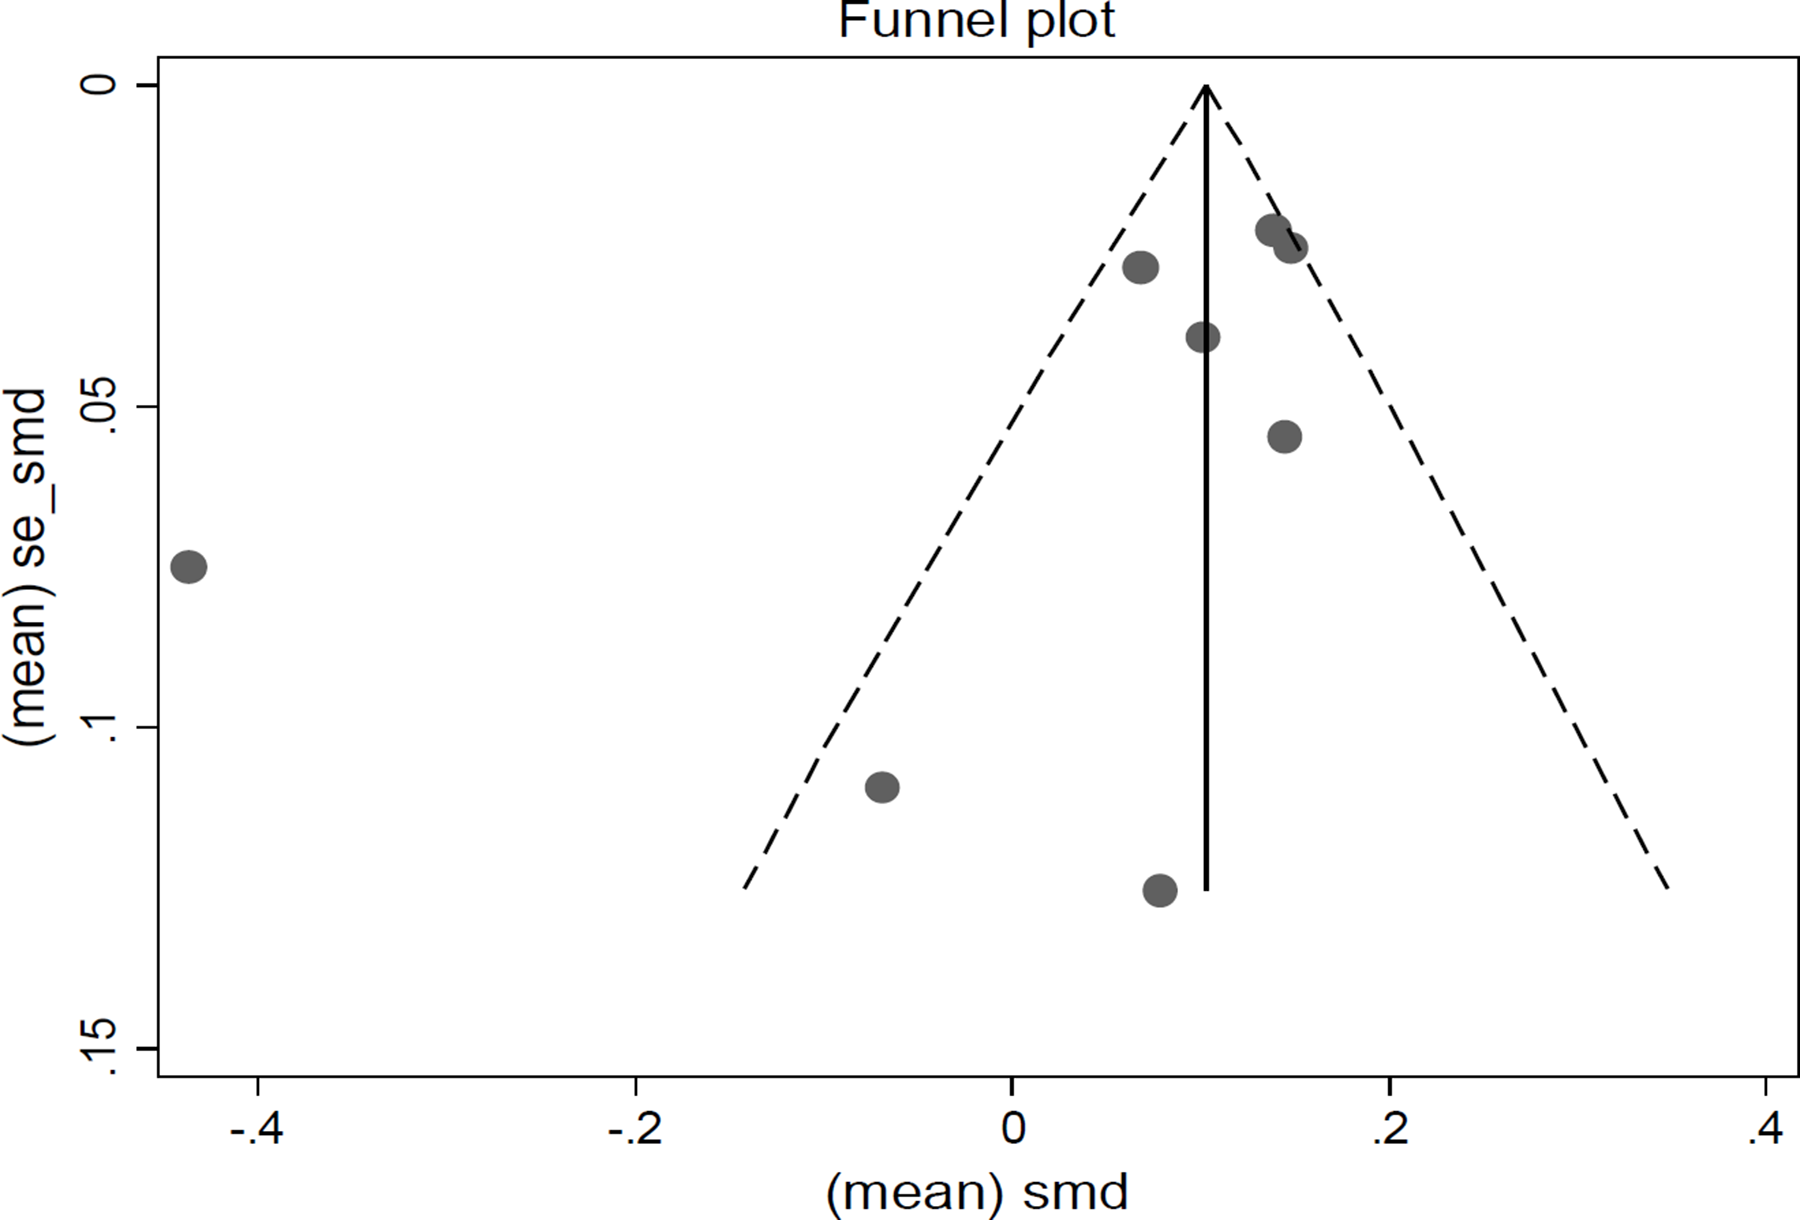
– Funnel Plot for Labour Productivity
It is worth mentioning that this conclusion could be affected by the four studies that could not be included in these empirical tests. These conclusions would be reinforced by the results of the excluded studies as three of them – Benavente et al. (2007), Mano et al. (2012) and Corseuil and de Moura (2011) – found positive effects on jobs creation, two – Benavente et al. (2007) and Mano et al. (2012) – found positive effect on firms' performance, and one – Benavente et al. (2007) – also found positive effects on innovation and exports 44 . We therefore interpret these findings as not providing evidence for publication bias for firms' performance and labour productivity outcomes, but providing evidence of possible bias for employment creation outcomes.
Egger's Test for Publication Bias
Note: Standard errors (s.e.) in parenthesis. **, * Statistically significant at 5 and 10 percent respectively.
Figures 29 to 31 present the funnel plots for the same outcomes but only for MG interventions whereas Egger's test is showed in Table 9. The findings with respect to possible bias have the same interpretation as the findings for interventions overall: findings provide evidence of publication bias for employment creation outcomes but we are not able to conclude there is evidence for publication bias for firms' performance and labour productivity outcomes.
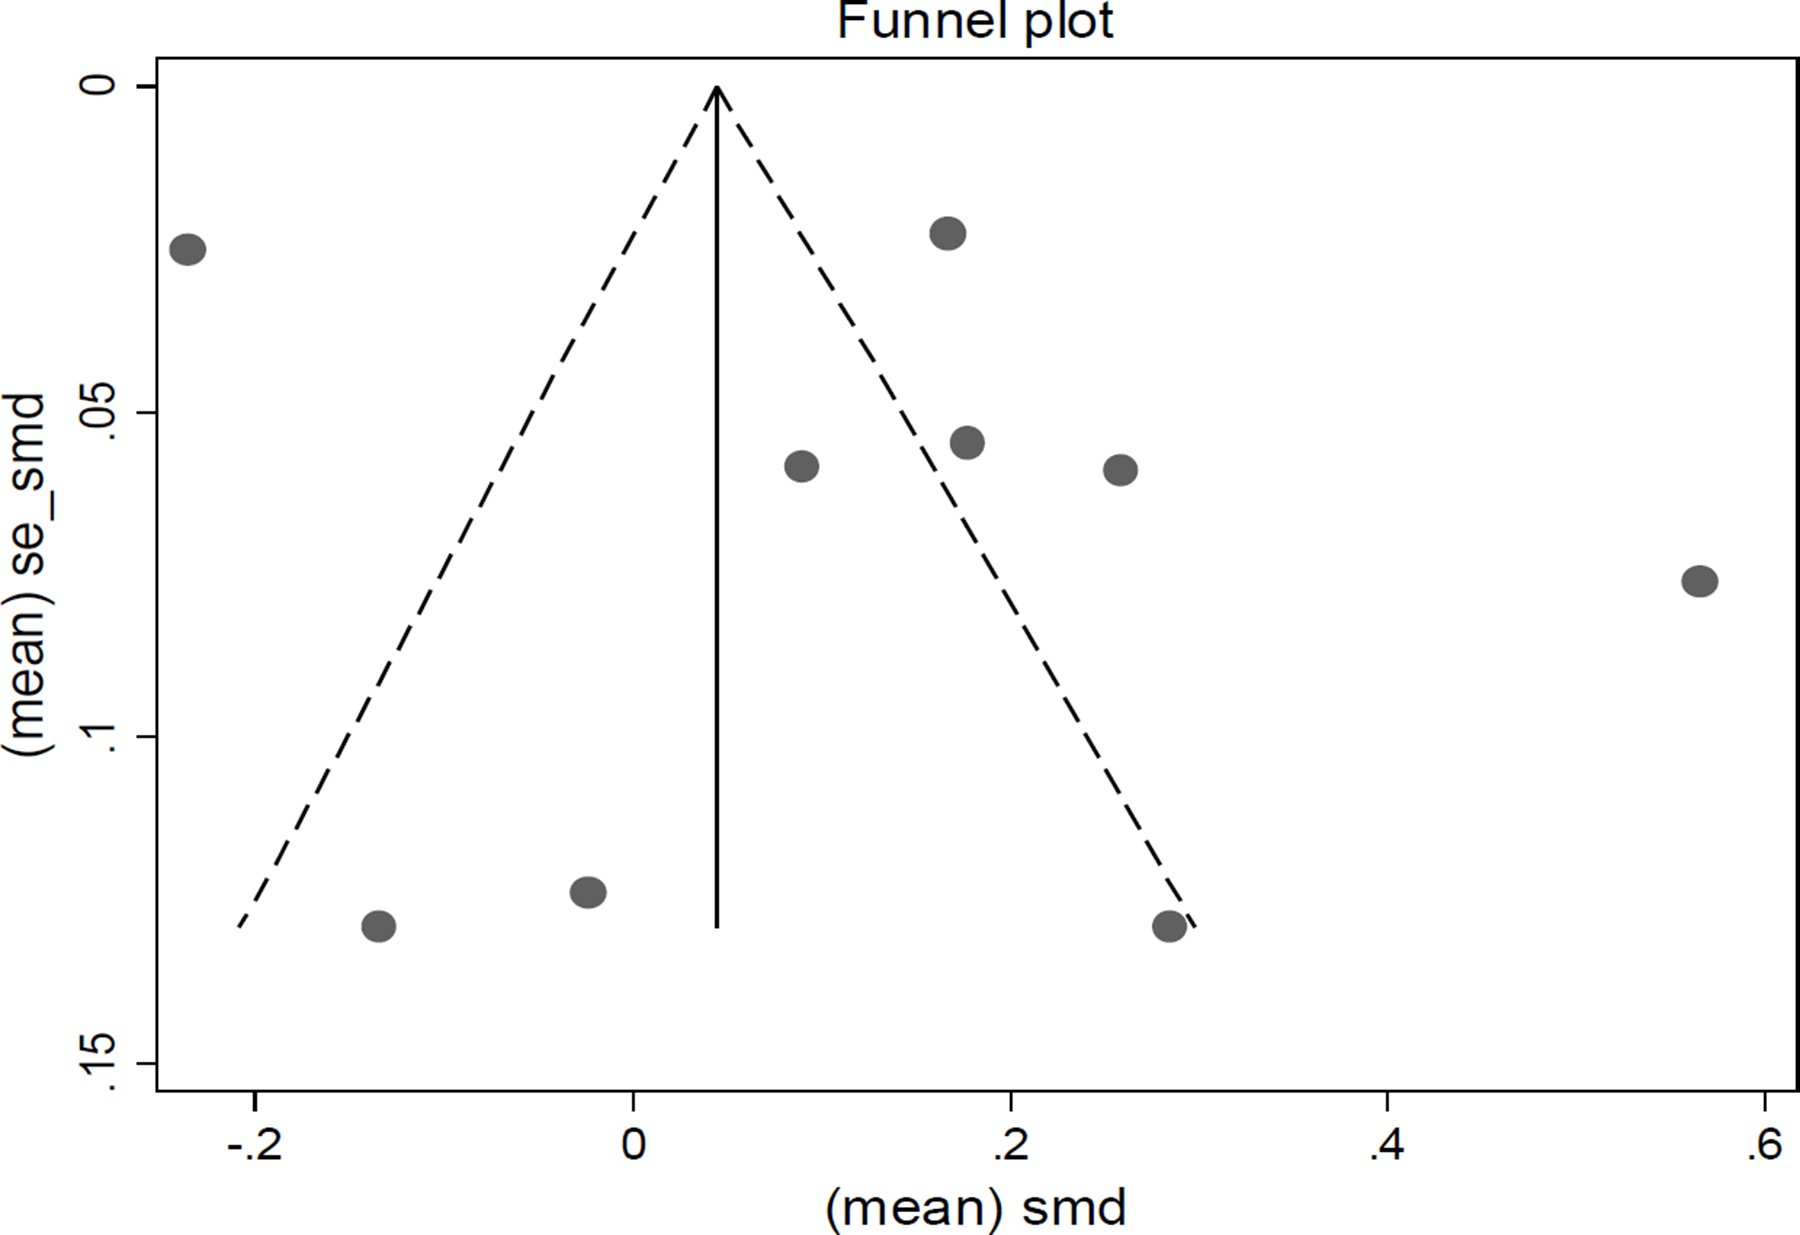
– Funnel Plot for Matching Grants: Firm Productivity
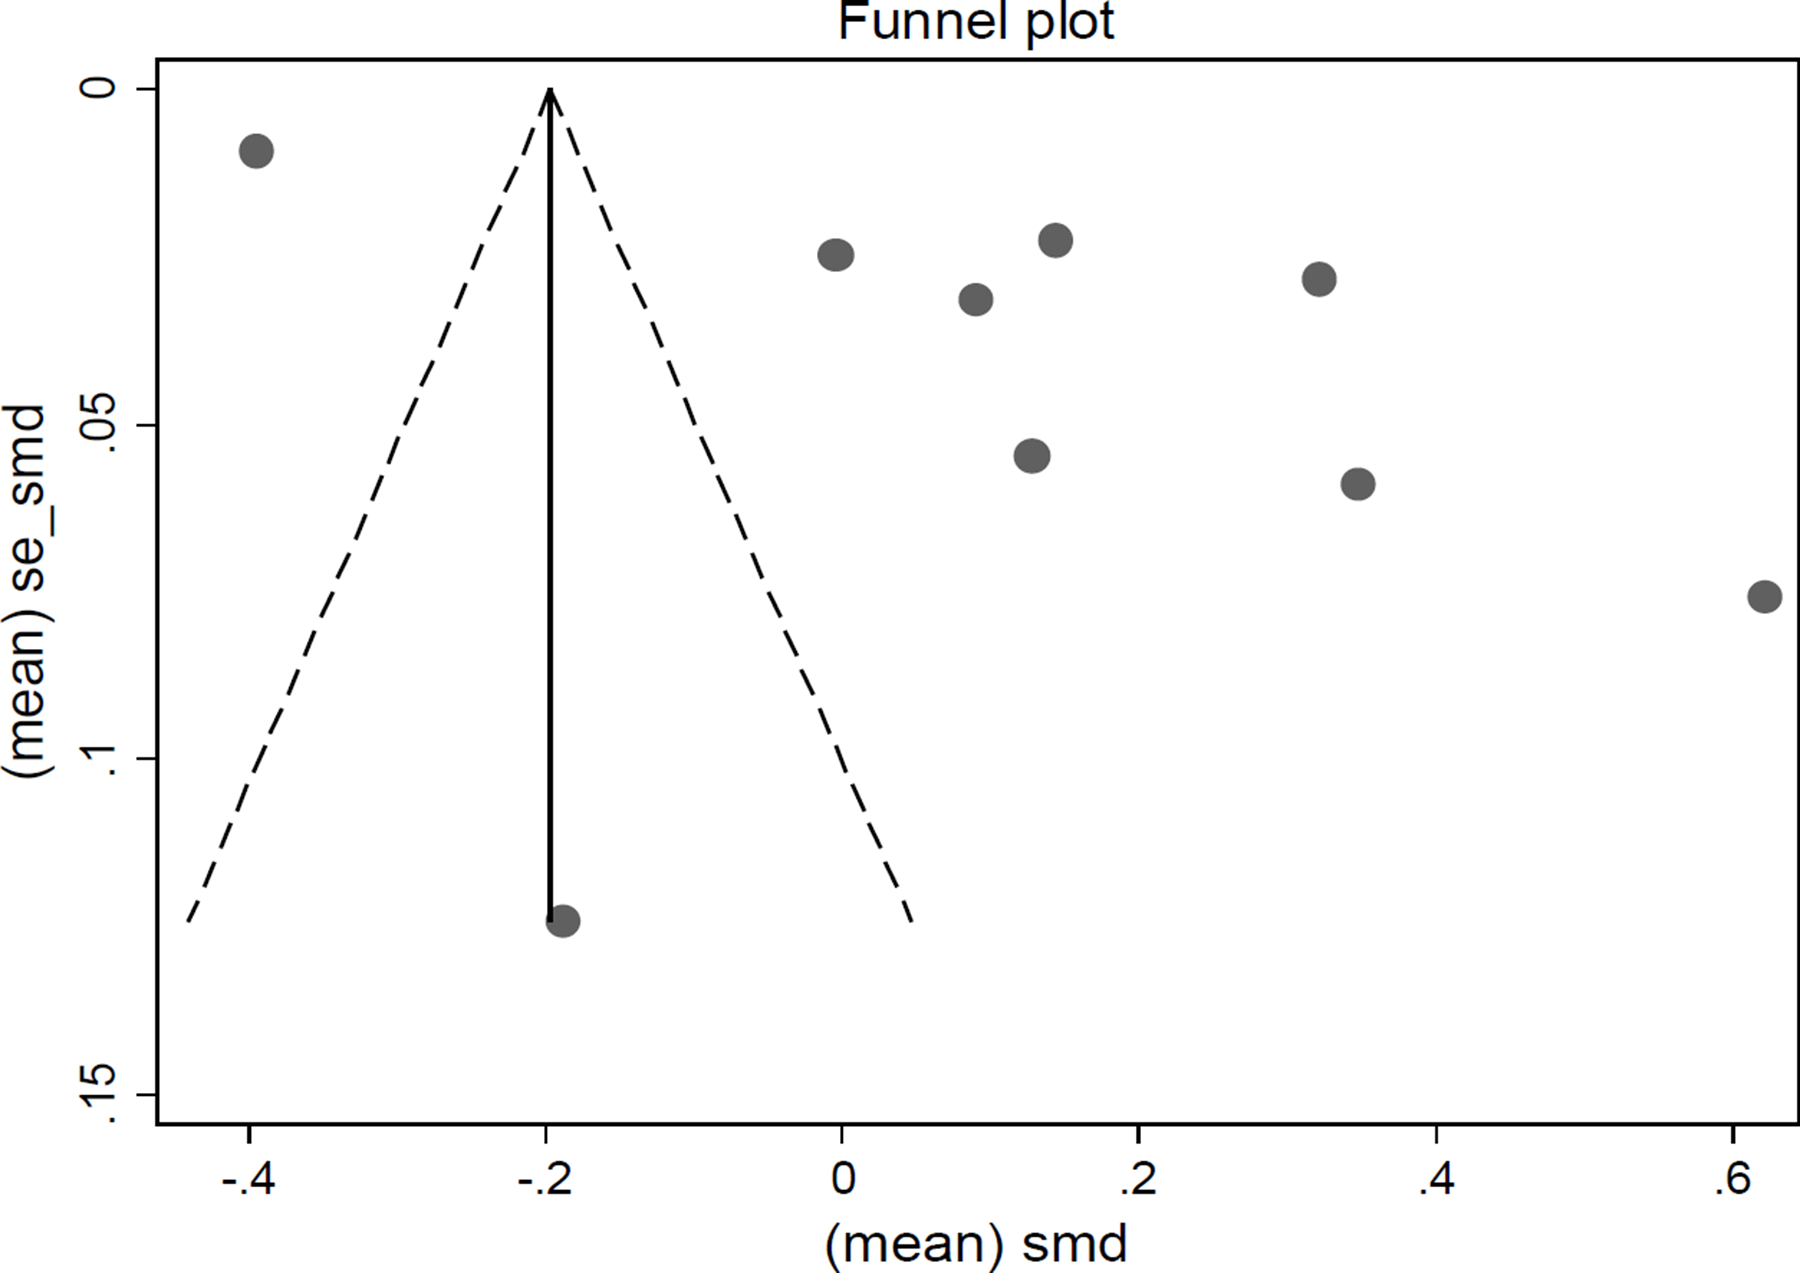
– Funnel Plot for Matching Grants: Employment Generation
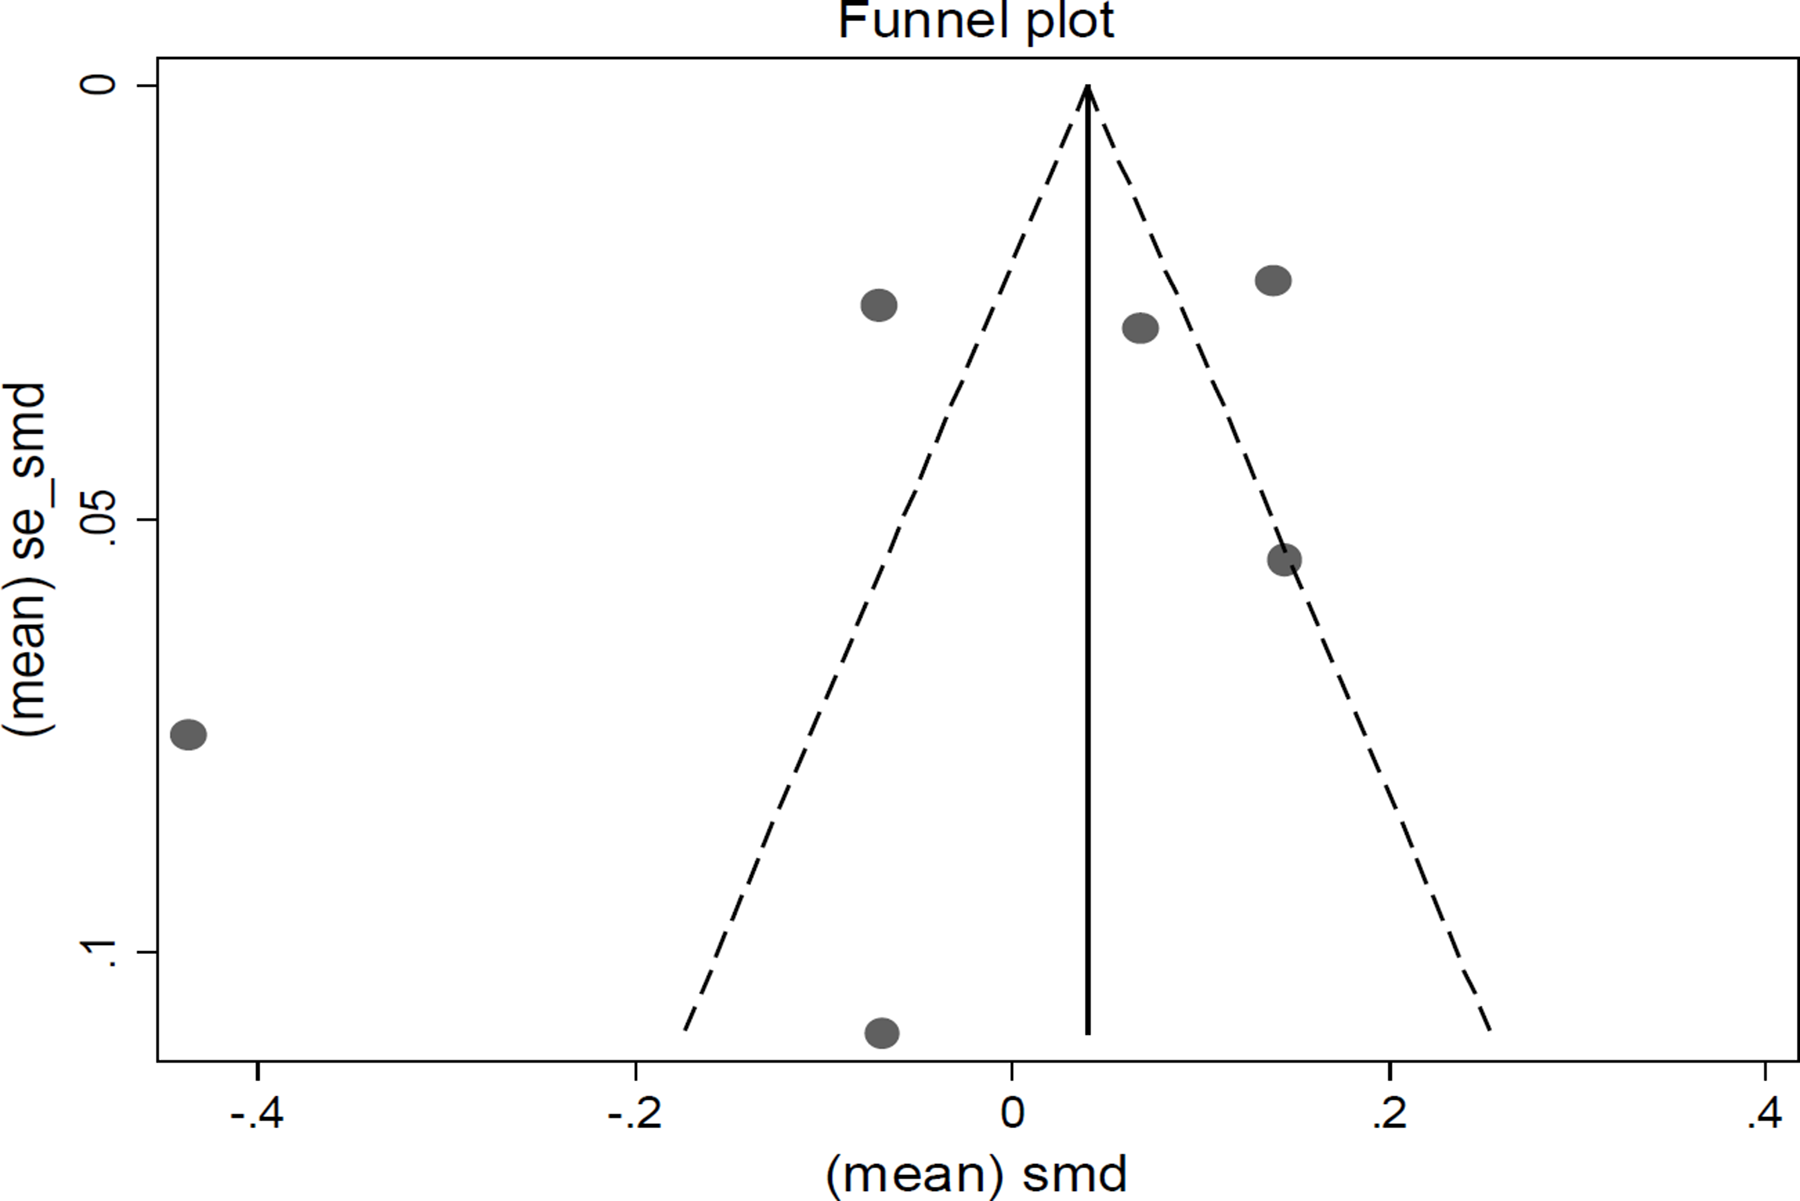
– Funnel Plot for Matching Grants: Labour Productivity
Egger's Test for Publication Bias Matching Grants Interventions
Note: Standard errors (s.e.) in parenthesis. ***, **, * Statistically significant at 1, 5 and 10 percent respectively.
5 Discussion
5.1 SUMMARY OF RESULTS
This systematic review found 40 studies that used rigorous evaluation techniques to identify the causal effect of business support interventions on SME outcomes. Heightening the importance of our review is that many of the studies examined (20 out of 40) remain unpublished. While it is not surprising that journal articles can take a long time to appear in the field of development economics where the studies originate, this does indicate the importance of searching repositories of unpublished literature. Furthermore, despite the reasonable number of studies, there are still very few that meet all necessary criteria required for a study to be classified as having low risk of bias. Although the evidence comes from several countries, most of it is concentrated in Latin America.
We found that several studies looked at a myriad of outcomes related to firm performance such as profits, revenues, sales, assets, and so on. We thus grouped them under an outcome named ‘firm performance’ to be able to say something about the impact of different interventions on firms. A similar decision to group different measures into a broader definition was made for all outcomes assessed in this report. The meta-analysis found that on average, SME-support interventions had positive impacts on firm performance indicators as well as employment generation, labour productivity, exports and investment. In relative terms, the pooled estimates point to an effect of 21.8 per cent on firms' performance, 9 per cent on jobs creation and 8.9 per cent on labour productivity. However, there was substantial heterogeneity in effects across studies which we explored in subsequent analysis.
The sample size allowed us to look at the effect of matching grants and support on export programmes through forest plots and on most of individual interventions through meta-regression. We find that matching grants show a positive impact on firms' performance and employment. The magnitude of the effects in percentage change are smaller for firms' performance (7.6 per cent) to what we found pooling the interventions, but very similar for jobs creation (7.5 per cent). Even though based on a fewer number of studies, meta-regression results suggest that technical assistance and tax simplification programmes also have some positive effects on firms' performance and jobs creation. Export promotion and innovation programmes seem to affect positively exports and innovation respectively.
If we consider the theory of change outlined above, we observe from meta-regression results that indirect interventions, such as tax simplification programmes, affected intermediary and final outcomes by increasing formalisation rates and firms' performance. We also found positive effects of matching grants on intermediary - investment - and final outcomes.
In addition, the evidence suggests that none of the different types of support has a negative impact on performance or job creation on average, though we found a lot of between-study variability in most meta-analyses, indicating that effects of these interventions can vary considerably.
For the pooled sample of interventions and matching grants we were able to run meta-regressions controlling for moderator factors. The analysis showed that region (LAC and Africa), firm size and study quality (risk of bias) may have an important moderating effect on the overall average effects on firms' performance and employment. The bottom line is that firms seem to perform better in LAC than in African countries. We believe that this might be picking some scale effect as relatively larger firms are supposed to have larger profits and sales. We tried to shed some light on the scale effect by controlling for firms' sizes. Interestingly, the estimates point to a reduction of firms' performance as firms get larger. This could be due to a competition effect since relatively larger firms tend to operate in a more competitive market, but it could also be explained by coordination failures that tend to common in large firms.
Risk of bias and method used to assess the impact of the programmes play a role on the findings as well. The estimates show that high risky studies tend to report higher effects on firms' performance and employment, but not for labour productivity. With regard to methods used, RCTs tend to report smaller effects on firms' performance and employment than studies based on quasi-experimental methods.
Funnel plots and Egger's test suggested the possibility of some publication bias in the reporting of job-related outcomes, employment and labour productivity.
5.2 OVERALL COMPLETENESS AND APPLICABILITY OF EVIDENCE
This review included 40 studies and analysed 36 studies with meta-analysis and meta-regression techniques. The studies covered interventions in 18 different countries; most are located in Latin America (26), six in Asia, six in Africa, and two in Europe. We were unable to calculate effect sizes for three studies from Latin America and one from Africa, which were hence excluded from the meta-analysis.
Our findings do not permit us to say much about the effectiveness of most of the interventions individually given the low number of studies investigating the impact of same type of policy. However, the evidence showed encouraging results regarding the impact of business support on primary outcomes such as SMEs' performance, employment creation and labour productivity as well as on secondary outcomes such as exports, innovation and investment. Our findings also suggested that interventions in the form of matching grants seem to have positive effects on firm performance and employment, and on firms' investments.
Though random effects (RE) meta-analysis models attempt to account for sources of variability other than sampling bias, RE meta-regression analysis controlling for moderating factors showed that the region, firm size and quality of the study may explain a lot of variability observed in the data. We still know too little about the impact of SME business support policies or interventions, and which are more or less likely to work in resource poor contexts such as in African countries, but these results are encouraging and hopefully will be useful to show policy makers the importance of more costly evidence-based interventions.
Overall the definition of an SME is very broad, and the same intervention seems to have very different effects when applied to neighbourhood businesses employing fewer workers versus concerns that are more outward-looking and have a longer-term vision. Therefore if policymakers are interested in scaling interventions or replicating them across national contexts, it is worth taking a more nuanced approach to eligibility, particularly in terms of firm size, in order to minimise the risk of funding ineffective programmes.
5.3 QUALITY OF THE EVIDENCE
Overall, the quality of the studies varies significantly. About 60 per cent were judged to have a high risk of bias in our risk-of-bias assessment. Only a couple (two RCTs) was considered to have a low risk of bias were coded as having a low risk of bias. Even RCTs and peer-reviewed studies published in respected journals lacked key information about the programme or intervention. Some did not report basic descriptive statistics such as sample sizes or means and standard deviations at the baseline, others did not deal explicitly with the evident problem of attrition, and most did not explore the possibility of general equilibrium effects from large-scale interventions. Also, funnel plots and Egger test pointed to some publication bias in employment and labour productivity outcomes. Finally, the small number of studies evaluating the impact of the same intervention on the same set of outcomes prevented us from running a meta-regression with moderating factors to uncover some of the mechanisms underlying the programmes' impacts. Consequently, the large number of studies of mixed quality should be seen as a strong signal that the meta-analysis results should be read carefully: we still know too little about what works or does not work, and what works best for SMEs.
5.4 LIMITATIONS AND POTENTIAL BIASES IN THE REVIEW PROCESS
Most of the studies covered in this review employ quasi-experimental designs that rely on assumptions that sometimes may fail at controlling for all sources of confounders. Our experience confirmed a point made by Baird et al. (2013) that very few economic papers report the exact information necessary to perform ES calculations, so assumptions had to be made. In addition, to synthesise the ES across different studies we made a considerable simplification in averaging SMD obtained through estimation of different parameters – such as intention to treat (ITT) often reported in RCTs, average treatment on the treated (ATT) reported in DID and PSM, and the local average treatment effect (LATE) reported in RDD and IV. Our review also gathered evidence from 18 countries, four regions – Asia, African, Latin American and East Europe – various contexts, and with differences in programme scale, intensity, and period, which considerably complicated study comparability and the drawing of general conclusions. 45 We tried to account for heterogeneity within and between studies by estimating random effects models and using moderator variables in the meta-regressions, however the I-squared and tau-squared statistics showed a high degree of variability in the main findings.
Several additional limitations of this review are worth noting. We only searched for and included evidence published or made available after the year 2000 which means that a small number of impact evaluations conducted prior to this year may have been missed. However, judging by other systematic reviews conducted in this field and by the publication dates of included studies, we feel that this is unlikely.
We did not conduct a specific search in French, but we searched several databases that include studies written in other languages, and we screened French language studies for inclusion in the review. We did not conduct specific searches in the RePec database, nevertheless, it is worth mentioning that we did conduct electronic searches in Econlit database that encompasses all RePec working papers.
We did not conduct moderator analysis by all types of global region, only for those regions where we had sufficient observations to undertake appropriate analysis – in other words, Latin America (since the majority of the evaluated interventions were implemented in Latin America) and Africa (also given the sub-focus of the review on Africa – see also Appendix D).
The list of 40 studies included in this review is provided in Table 2, however, for four studies – Mano et al. (2012), Kalume et al. (2013), Corseuil and Moura (2011), and Benavente et al. (2007) – we were unable to compute either the standardised effect sizes or the adjusted standard errors and therefore could not include them in the meta-analysis.
Finally, this review could have made use of alternative methods more extensively to try to dig into specific characteristics of each intervention assessed econometrically in each study included in the final list.
5.5 AGREEMENTS AND DISAGREEMENTS WITH OTHER STUDIES OR REVIEWS
Few reviews directly focus on the topic of business support services and SMEs, and those studies of interventions that directly relate to this topic and use rigorous methods and measures are examined in our review. However, some agreements and disagreements can be found in comparison to recent reviews on the topic. For instance, like Cho and Honorati (2013), who examine the impact of business and finance training on entrepreneurship in developing countries, we note a general positive impact for business support services on SMEs, though with mixed general results on some outcomes such as innovation, exports and investment. While Cho and Honorati (2013) highlight the potentially important role of financing in combination with training, we find positive outcomes for firms with regard to initiatives specific to matching grants. Comparisons between Cho and Honorati (2013) and this review should be done with extreme caution as the nature of the studies included in the two reviews are very different (as they focus on interventions that promote entrepreneurship). As with our review, Grimm and Paffhausen (2014) also consider business support services, but with a focus on employment outcomes. A small but thorough component of their review overlaps with ours in terms of studies examined and findings. Moreover, like Grimm and Paffhausen (2013), we note a paucity of literature on SME intervention outcomes, particularly in the context of Africa, and also of literature reporting appropriate baseline and outcome statistics. As in this review, Grimm and Paffhausen (2013) find weak support for the argument that SME interventions generate employment. Interestingly, their meta analysis, controlling for firm size, suggests that SME interventions provide better results in larger SMEs, which is similar to what is found in this review. Their results also come mainly from small and medium-sized enterprises in Latin American countries and they also warn that it is difficult to predict whether these programmes would work in other context. Importantly, direct comparison between Grimm and Paffhausen (2013) and this review should be done with caution as their study includes microfinance interventions.
6 Authors' Conclusions
6.1 IMPLICATIONS FOR PRACTICE AND POLICY
This review examines the impact of an array of SME business support on various outcomes. These different programmes are based on a different theory of change and each one has its own logic. Whenever possible, we used meta-regressions to disaggregate the findings by type of intervention and conduct sensitivity tests using moderator variables such as firm size, studies' risk of bias and region as controls. Another point worth noting is that most of the papers analysed are for the Latin America region, thus the results cannot be assumed to be the same in other contexts, for instance in African countries. Rather, the results might be used by decision makers in other regions to learn about this experience and adjust it to each specific regional context.
The findings suggest that overall SME support for the categories considered in this systematic review (training, matching grants, innovation, local productive systems, export promotion, tax simplification and technical assistance) has a positive impact on firm performance indicators, employment and labour productivity. For specific interventions, we find that matching grants in particular show a positive impact on firms' performance and employment. Even though based on just a couple of studies, meta-regression results suggest that technical assistance and tax simplification programmes also have some positive effects on firms' performance and jobs creation. Export promotion and innovation programmes seem to positively affect exports and innovation respectively.
Thus the results provide an indication for policy makers that some types of SME support might generate jobs and improve firm-level performance indicators. In addition, the evidence suggests that none of the different types of support have negative impacts on performance or job creation on average, though we found a lot of between-study variability in most meta-analyses, indicating that effects of these interventions can vary considerably. It would be ideal to have a more homogeneous set of interventions to conduct meta-regression analysis with more than one moderating factor that could potentially better capture the heterogeneity accruing from the differences in institutional settings where each intervention took place. The results of the meta-regression analysis suggest that firm size seems to be a relevant moderator, with larger firms more likely to create jobs. Secondly, the effect of MG on employment drops to almost zero and becomes statistically insignificant once risk of bias is controlled for. It suggests that studies that found a positive effect of MG on employment may have a higher risk of bias. Thirdly, the intermediary outcomes seem to affect some of the findings for primary outcomes. Firms that export tend to have higher labour productivity whereas firms that invest tend to have slightly more employees but not necessarily better performance. These findings suggest that matching grants serve different firm composition and business purposes. Export-oriented firms for example need to become more efficient to be able to compete in the external market while labour intensive firms may use matching grants more as a working capital.
The results provided should not be interpreted as clear evidence of the effectiveness of SME support alone. The bulk of the studies analysed have some limitations that should be noted and policy makers should learn from the evidence with this in mind.
First, the meta-regressions were not able to provide compelling results for all types of interventions or specific countries due to the relatively small number of studies that look at the same intervention and used the same outcomes. Second, most of results are based on data extracted from studies for Latin America. Thus the lessons drawn from these studies should be interpreted under the institutional context of Latin American countries, which is already quite heterogeneous. The applicability to other contexts is not direct and should take into account specific institutional contexts. As noted above, we found a lot of variability between studies, indicating that effects of these interventions can vary considerably by context. Finally, the overwhelming majority of studies do not provide detailed information about the cost of implementation. The present study could be usefully complemented by a cost-effectiveness analysis in order to inform policy makers about the cost of effectiveness of each programme.
Thus, this review provides some evidence in favour of some SME support programmes, however, the evidence should be interpreted with caution given the limitations of some studies listed above. It is clearly important to learn about the implementation process of programmes that have been currently supported. The absence of positive impact of a particular intervention might be related to the way the programme was actually implemented. Furthermore, some nodes in the causal chain may not have been properly considered and addressed during the conceptualisation and implementation of the evaluation plan.
Thus, programmes that did not present good results should not be ruled out upfront. Rather, policy makers may consider drawing lessons from the problems of implementation and assess whether some aspects of a programme can be improved in order to achieve better results. Developing both a theory of change for the intervention at hand and designing the programmes in a way that makes their evaluation possible are important steps to enable learning from new programmes, understanding whether and how they work and use evidence to inform policy.
6.2 IMPLICATIONS FOR RESEARCH
The results of this review strongly suggest that additional research is needed to improve understanding of the impact of SME support programmes in LMICs. This review covered a long list of interventions but only few of them have been tried in more than two places. This review therefore indicates that replication of similar programmes across different contexts might be the way to go to generate knowledge in the field so that policy makers can implement programmes that are more likely to succeed in a particular environment.
Although many interventions with microenterprises have taken place in Africa and Asia, this review revealed a paucity of evaluations done for programmes in other regions in particular Africa. The small amount of evidence for Africa might be related to the fact that many countries in the region have less sophisticated and smaller SMEs, as discussed in McKenzie (2011). 46 This has several direct implications for research. First, it suggests that researchers may have some difficulty in conducting a randomised controlled trial to assess the impact of an intervention, because of sample size issues. Second, it suggests that small firms might face an array of constraints and therefore may need a package of interventions (a big push) to be able to grow (Campos et al. 2012 and de Mel, McKenzie and Woodruff, 2013). Thus, the generation of rigorous evidence of the impact of interventions designed to foster the development of private sector in LMIC through the strengthening of SMEs becomes even more crucial in this case.
As noted above, the evaluation of SME support programmes should be complemented by a cost-effectiveness analysis whenever possible. It is very important to provide crucial information for policy makers about the resources needed to achieve a given target in improving productivity of the SME sector.
The evaluation of SME support intervention is not an easy task given the difficulties of isolating the treatment and control groups. However, as evidenced in the risk of bias assessment, authors should try to use all available methodological tools and reporting the details of the study design more carefully. For instance, authors should consider the use of tools such as the 3ie risk of bias tool and its adaptation in Baird et al. (2013) as a guide to consider the sources of bias and design and implement evaluations with lower risk of bias. This is crucial to improve the quality of the studies and provide a more credible account of the programmes being evaluated.
Fourth, the studies should, whenever possible, try to present a better qualitative discussion of the implementation processes related to the interventions under study. This aspect is often missed in the evidence included in this review. A structured account on how the programmes are designed and implemented is very informative to the interpretation of results and to better identify factors that might drive success and failure of these interventions. 47
Footnotes
8 Information about This Review
9 Appendices
9.1 APPENDIX A – SEARCH STRATEGIES
9.2 APPENDIX B – DETAILED DESCRIPTION OF RISK OF BIAS 48
9.3 APPENDIX C – DETAILED EVIDENCE FROM AFRICAN PROGRAMMES
9.3.1 Methods used in the search for qualitative background materials
9.3.2 Results
9.3.3 Discussion
9.3.4 Concluding remarks
9.4 APPENDIX D – DETAILED CHARACTERISTICS OF INCLUDED STUDIES
1
This report excludes studies that consider exclusively microenterprises. This distinction is made because self-employed and micro-entrepreneurs targeted by microfinance interventions are thought to have a different nature in comparison to SMEs and are less likely to grow with individual interventions and by nature less likely to create jobs.
2
For instance, innovation support might be more effective in more developed countries because the nature of the SME sector differs from developing countries due to institutional factors. An innovation policy might be successful in a developing country if it supports the segment of SMEs that has the institutional capacity required to innovate.
3
The Research Group at the World Bank has conducted several experimental and quasi-experimental evaluations to investigate the impact of regulatory changes aimed at reducing bureaucratic barriers to SMEs' formalisation and growth. See Bruhn and McKenzie (2013) for a review.
4
In fact there are interventions that are targeted to formal enterprises only, such as subsidized credit lines. Thus it is possible that after formalizing some firms may end up being served by different interventions.
5
See McKenzie and Woodruff (2014) for a review of business consulting programme evaluations in developing countries
6
Like the papers included in this review, we do not try to provide a specific and precise definition of local agglomeration. For more about the difficulties related to the concept and definition of spatial agglomerations please see Altenburg and Meyer-Stamer, (1999) and Manrtin and Sunley (2003).
7
The funders of this review asked that special attention be paid to Africa, both in terms of study search and analysis and in terms of extrapolating the implications of the results. We attempt to relate findings to African countries where applicable. We have also included specific analysis of how applicable the evidence is for African contexts (Appendix C).
8
As is discussed in the critical appraisal section, the method/design is not a sufficient condition for the inclusion of a study in the review.
9
On the other hand, RCTs are often criticised because their findings do not have external validity, that is, the findings cannot be generalised to different contexts (see Deaton, 2009). In some cases, systematic reviews can be conceived, at least partially, with the purpose to shedding some light on this issue of external validity as it is a synthesis of results for the same type of intervention taking place in different circumstances (see Vivalt, 2015).
10
For instance, one study could be interested in comparing which package of intervention (treatment arm) is more effective in boosting firms' productivity: training, or training plus subsidies. The impact of each treatment type could be estimated by comparing each treatment group with the control group. However, under some assumptions, one could also compare the two treatment groups to identify the effect of the subsidy component.
11
The European Union and the World Bank use such definition (see, for instance, the Enterprise Survey website www.enterprisesurveys.org). Further, empirical papers, such as  , Ayyagari et al (2007), Cravo et al (2012), Kushnir et al (2010) adopt 250 employees as a cut-off to classify SMEs.
12
By doing that we departure from what was stated at the Protocol. In the Protocol we state that we would work with firms that have between 5 and 250 employees and would use that definition during the screening stage.
13
In line with Ayyagari et al. (2011) and the literature more generally, we consider microenterprise firms to have less than 5 employees. In developing countries these often operate as informal enterprises.
14
Some interventions might target SMEs and microenterprises together. We identify these cases and conduct sensitivity or sub-group analyses to check the effects in case of the inclusion of microenterprises in the study.
15
In fact, according to McKenzie (2011) SMEs tend to be relatively small in African countries. A flexible definition of SMEs is thus suitable for including interventions targeting firms of different sizes.
16
All studies found in the search process that satisfied the inclusion criteria outlined in the protocol were included in this review. There was no further exclusion criteria based on dose, duration and intensity of intervention.
17
Note that this decision represents a deviation from the review's protocol according to which studies had to report at least one impact to do with firm-related outcomes, either intermediary or final. We excluded studies that focused only on intermediary outcomes because they do not show whether the intervention improved firms' outputs or not. This decision led to the exclusion of only two studies, however, with no implications for African countries since both looked at the impact of tax simplification policies on the formalisation rates of firms, in Brazil and Bangladesh respectively.
18
The year 2000 was used as the temporal cut-off for several reasons. The impact evaluation literature related to SMEs developed after this year and in the process of identifying the main approaches to SME and designing the review, no reference prior to 2000 was found. Also, the decision took into consideration that going back in time was going to generate an enormous additional number of abstracts to be reviewed and very likely return very few, if any, SME impact evaluation. For instance, a paper by Grimm and Paffhausen (2015) study a similar issue but focus only on employment outcome. Their search was done after 1990 and only one paper from prior to the year 2000 (Fretwell et al, 1999) was found. This paper would not qualify to enter this review as it is designed to assess active labor policy in general (not SMEs specifically) and also includes assessment of self-employment which is not covered by this review.
19
DAC Evaluation Resource Center focuses on reports on Monitoring and Evaluation. Nevertheless, the review screened all references in the DAC Evaluation Resource Center and did not find any evaluation related to SMEs.
20
The review took a look at the first 10 Google Scholar result pages classified by the relevance of the reference.
21
The search strategy did not involve searching physical journals or library shelves. The search strategy did not specifically looked for Master and PhD theses.
22
The search strategy did not involve specific search of papers published in French (e.g. snowballing and internet search). Nevertheless, papers in French identified through the search of electronic databases were screened.
23
We decided to keep studies that pooled micro, small, medium and large enterprises, such as that by Hon Tan (2011), which did not provide heterogeneous analysis for different groups of firms.
24
A key issue with this aggregation rule is that it groups stock and flow variables. This decision is far from ideal, but we could not come up with a better solution. However, given that few studies report on the same type of outcome (e.g. profits) a decision had to be made to group those outcomes otherwise we would not be able to say much about firms' performance
25
This assumption implies a standard deviation (SD) of Y is given by: SD(Y) = SD(beta_hat)x(2)-0.5, See the attached file for the formulae.
26
The computation of SMD via t-test was obtained by replacing the formulae of the pooled standard deviation by a simple manipulation of the formulae of a t-test for difference in means. See Wilson (2011).
27
We arbitrarily defined small sample size (n) as less than 100 observations per treatment arm. According to this definition, only three studies in the final list have small samples. Most of the studies use more than 300 observations per treatment arm.
28
Administrative data is information that is collected for administrative purposes (such as registrations, transactions, record keeping, or service delivery), and not research.
29
Because very few studies selected for this review had more than one version, we kept only the latest versions. In most of these cases, the latest version happened to be a refereed paper.
30
Since variance of (a+b) = var(a) + var(b) + 2 Cov(a,b), assuming Cov(a,b) = 0 is a conservative assumption as it implies lower precision of overall effects unless the covariance is negative. On average, we expect the covariance across studies to be close to zero. We also believe this is a reasonable assumption because according to these studies the number of firms taking up different treatments is not high. Given the restricted overlap between different treatments, we do not believe there is reason to worry about high correlation between firms participating in different interventions. It is important to clarify that by doing this we are not averaging across outcomes, but instead across different ES for a given outcome. In a case where a study reports on multiple treatment arms, and the treatment arms share the same control group, then there might be a dependency issue. However, we do not think that this would substantively affect the findings.
31
It could be argued that in those cases it would be more appropriate to compute the variance of the synthetic effect assuming covariance equals to 1 given that the individual point estimates come from the same study and sample. However, it can be seen in the previous footnote that assuming Cov(a,b) = 0 will be a conservative assumption if and only if Cov(a,b) < 0.
32
In other words, we did not combine estimates obtained for firms receiving matching grants only with estimates for firms receiving package of interventions (e.g. matching grants and technical assistance).
33
To deal with missing data we used Waddington et al. (2012) whenever possible but when no guidance seems to be available we followed similar steps as .
34
Borenstein et al. (2009, p.118) argues that “I-squared is a descriptive statistic and not an estimate for any underlying quantity”.
35
In the Protocol we stated that we would like to include as moderator factors variables such as level of bureaucracy, the sector to which the firms belong, number of years in operation and so on. For variables related to the institutional setting, such as level of bureaucracy, we considered to use country fixed effects to control for issues are plausibly fixed or difficult to change in the short run. However, the small number of studies prevented us from pursuing such strategy. We therefore used dummies for Latin American and African countries. For variables related to firms themselves, we used firm size only. Our analysis also considered use studies' risk of bias as a moderator factor. The result section below discusses the details.
36
In the present case a study is defined as an outlier if it shows effect sizes 3 times larger the standard deviation of a respective variable distribution. Based on this criterion the three studies that stand out as outliers are Duque and Muñoz (2011), Rand and Torm (2011), and Hong Tan (2011). This is not ideal because the standard deviation is affected by the outliers, but it is more conservative than the rule of thumb of ‘2 SD from the mean‘. For a reference, see .
37
It is worth noting that qualitative documentation has clear limitations as they are based on subjective judgement and are plagued with selection bias.
38
As we want to focus on SMEs and not on microenterprises that have a different nature, ideally the study would focus on studies that consider the range between 5-250 employees. We decided to include studies with 1 or more employees because jobs creation stand out one of the main outcomes in those studies and we then considered useful keep them in the final list of studies. That said, the great majority of studies (90 per cent) included in the review assessed programmes with more than 3 employees and 85 per cent have more than 5 employees.
39
A key issue with this aggregation rule is that it groups stock and flow variables.
40
The forest plots are available in a separate file.
41
We are able to perform meta-analysis for final outcomes when we pool the interventions and when we run the analysis for each programme individually.
42
43
We tested a quadratic specification for the variable size and the coefficients for the quadratic term is very often negative, suggesting a concave relationship between firm size and firm performance. Because number of studies is relatively small, the estimates are imprecisely estimated and are available upon request.
44
45
In the discussion above it is showed that studies were done in different countries, different years and scale as some used administrative data and other small scale RCTs.
46
Latin American countries that provide most of the studies included in this review usually have institutions that constantly design SME interventions. Also, most of these institutions have monitoring units that generate data for programme evaluations. Also, some African economies are dominated by rural and informal self-employed entrepreneurs, two types of firms not included in the review.
47
It is paramount that this analysis is done simultaneously with the evaluation when researchers are in contact with staff of institutions responsible for the programmes evaluated. This is because researchers can learn about the tacit knowledge related to these programmes. The information gathered during this process should be clearly reported in the studies and, whenever possible, made publicly available.
48 This tool is taken directly from Hombrados and Waddington (2012).
49
Even in the context of RCTs, when randomisation is successful and carried out over sufficiently large assignment units, it is possible that small differences between groups remain for some covariates. In these cases, study authors should use appropriate multivariate methods to correcting for these differences.
50
Even in the context of RCTs, when randomisation is successful and carried out over sufficiently large assignment units, it is possible that small differences between groups remain for some covariates. In these cases, study authors should use appropriate multivariate methods to correcting for these differences.
51
If the research has serious concerns with the validity of the randomisation process or the group equivalence completely fails, we recommend to assess the risk of bias of the study using the relevant questions for the appropriate methods of analysis (cross-sectional regressions, difference-in-difference, etc.) rather than the RCTs questions.
52
If the research has serious concerns with the validity of the assignment process or the group equivalence completely fails, we recommend to assess the risk of bias of the study using the relevant questions for the appropriate methods of analysis (cross-sectional regressions, difference-in-difference, etc) rather than the RDDs questions.
53
An instrument is exogenous when it only affects the outcome of interest through affecting participation in the programme. Although when more than one instrument is available, statistical tests provide guidance on exogeneity (see background document), the assessment of exogeneity should be in any case done qualitatively. Indeed, complete exogeneity of the instrument is only feasible using randomised assignment in the context of an RCT with imperfect compliance, or an instrument identified in the context of a natural experiment.
54
Accounting for and matching on all relevant characteristics is usually only feasible when the programme allocation rule is known and there are no errors of targeting. It is unlikely that studies not based on randomisation or regression discontinuity can score “YES” on this criterion.
55
There are different ways in which covariates can be taken into account. Differences across groups in observable characteristics can be taken into account as covariates in the framework of a regression analysis or can be assessed by testing equality of means between groups. Differences in unobservable characteristics can be taken into account through the use of instrumental variables (see also question 1.d) or proxy variables in the framework of a regression analysis, or using a fixed effects or difference-in-differences model if the only characteristics which are unobserved are time-invariant.
56
Knowing allocation rules for the programme – or even whether the non-participants were individuals that refused to participate in the programme, as opposed to individuals that were not given the opportunity to participate in the programme – can help in the assessment of whether the covariates accounted for in the regression capture all the relevant characteristics that explain differences between treatment and comparison.
57
Matching strategies are sometimes complemented with difference-in-difference regression estimation methods. This combination approach is superior since it only uses in the estimation the common support region of the sample size, reducing the likelihood of existence of time-variant unobservable differences across groups affecting outcome of interest and removing biases arising from time-invariant unobservable characteristics.
58
The Hausman test explores endogeneity in the framework of regression by comparing whether the OLS and the IV approaches yield significantly different estimations. However, it plays a different role in the different methods of analysis. While in the OLS regression framework the Hausman test mainly explores endogeneity and therefore is related with the validity of the method, in IV approaches it explores whether the author has chosen the best available strategy for addressing causal attribution (since in the absence of endogeneity OLS yields more precise estimators) and therefore is more related with analysis reporting bias.
59
Contamination, that is differential receipt of other interventions affecting outcome of interest in the control or comparison group, is potentially an important threat to the correct interpretation of study results and should be addressed via PICO and study coding.
60
‘Common methods’ refers to the use of the most credible method of analysis to address attribution given the data available.
61
A comprehensive assessment of the existence of ‘data mining’ is not feasible particularly in quasi-experimental designs where most studies do not have protocols and replication seems the only possible mechanism to examine rigorously the existence of data mining.
62
For PSM and covariate matching, score “YES” if: where over 1096 of participants fail to be matched, sensitivity analysis is used to re-estimate results using different matching methods (Kernel Matching techniques). For matching with replacement, no single observation in the control group is matched with a large number of observations in the treatment group. Where not reported, score “UNCLEAR”. Otherwise, score “NO”.
63
All interventions may create expectations (placebo effects), which might confound causal mechanisms. In social interventions, which usually require behaviour change from participants, expectations may form an important component of the intervention, so that isolating expectation effects from other mechanisms may be less relevant.
64
The reason to do the analysis only for the five studies was because the institution sponsoring this review has a direct interest in knowing the actual status of business support programmemes for SMEs in African and whether or not they are helping the private sector development in the region.