






Abstract
This Campbell systematic review examines the effectiveness of 12-step programs in reducing the use of illicit drugs. The review summarises findings from 10 studies, nine of which were conducted in the United States.
The main evidence presented in this review suggests that 12-step programs for reducing illicit drug use are neither better nor worse than other interventions.
This conclusion should be read with caution given the weakness of the evidence from the studies.
The power to detect a difference between the 12-step interventions and alternative psychosocial interventions was low and the estimated effect sizes were small. Many studies failed to adjust for the fact that the intervention is administered to groups, and so may overestimate effects. Given all these shortcomings, further evidence regarding the effectiveness of this type of intervention, especially in self-help groups, is needed.
Plain language summary
12-step programs for reducing illicit drug use are neither better nor worse than other interventions
Illicit drug abuse has serious and far-reaching implications for the abuser, their family members, friends, and society as a whole. Preferred intervention programs are those that effectively reduce illicit drug use and its negative consequences, and are cost-effective as well. Current evidence shows that overall, 12-step programs are just as effective as alternative, psychosocial interventions. The costs of programs are, therefore, an important consideration. However, the strength of the studies is weak and further evidence regarding the effectiveness of 12-step programs is needed.
What is the aim of this review?
This Campbell systematic review examines the effectiveness of 12-step programs in reducing the use of illicit drugs. The review summarises findings from 10 studies, nine of which were conducted in the United States.
What did the review study?
Illicit drug abuse is a globally recognised problem leading to high human, social and economic costs.
The 12-step program, modelled on the approach of Alcoholics Anonymous and adopted by Narcotics Anonymous and others, aims for complete abstinence. The 12-step approach is used both by self-help groups and for professional treatment called Twelve Step Facilitation (TSF).
This review examines the effectiveness of 12-step programs in reducing the use of illicit drugs. Secondary outcomes considered are on criminal behaviour, prostitution, psychiatric symptoms, social functioning, employment status, homelessness, and treatment retention.
What studies are included?
Included studies assess 12-step interventions for participants with illicit drug dependence using randomized controlled trials and quasi-experimental studies. Study populations are participants who have used one or more types of illicit drugs, regardless of gender and ethnic background.
A total of 10 studies consisting of 1,071 participants are included in the final evaluation. Nine of the studies were conducted in the United States, and one in the United Kingdom. The studies compare the 12-step program to alternative interventions. Nine studies were included in meta-analysis.
What are the main results in this review?
There is no difference in the effectiveness of 12-step interventions compared to alternative psychosocial interventions in reducing drug use during treatment, post treatment, and at 6- and 12-month follow-ups. 12-step programs combined with additional treatment did have a significant effect at 6-month follow-up, but this finding is based on few studies and is not found at 12-month follow-up.
There is some evidence that 12-step programs retain fewer of their participants than other programs, but the evidence has shortcomings. No effect was found on other secondary outcomes.
What do the findings in this review mean?
The main evidence presented in this review suggests that 12-step programs for reducing illicit drug use are neither better nor worse than other interventions.
This conclusion should be read with caution given the weakness of the evidence from the studies. The power to detect a difference between the 12-step interventions and alternative psychosocial interventions was low and the estimated effect sizes were small. Many studies failed to adjust for the fact that the intervention is administered to groups, and so may overestimate effects. Given all these shortcomings, further evidence regarding the effectiveness of this type of intervention, especially in self-help groups, is needed.
How up to date is this review?
The review authors searched for studies published until September 2016. This Campbell Systematic Review was published in February 2017.
What is the Campbell Collaboration?
The Campbell Collaboration is an international, voluntary, non-profit research network that publishes systematic reviews. We summarise and evaluate the quality of evidence for social and economic policy, programs and practice. Our aim is to help people make better choices and better policy decisions.
Executive summary
Background
The effects of substance dependence have serious implications for the individual, the family and friends of the substance dependent individual, and society at large. Practitioners and public health policy makers have an interest in finding effective treatments that are also cost-effective. This review examined the effectiveness of 12-step programs aimed at illicit drug dependent participants compared to no intervention, treatment as usual, and other interventions.
Objectives
The main objective of this review was to systematically evaluate and synthesise effects of 12-step interventions for participants with illicit drugdependence against no intervention, treatment as usual, and alternative interventions. The primary outcome of interest was drug use. Secondary outcomes of interest comprised criminal behaviour, prostitution, psychiatric symptoms, social functioning, employment status, homelessness and treatment retention.
Search methods
An extensive search strategy was used to identify studies meeting inclusion criteria. We searched electronic bibliographic databases in January 2010, October 2011, July 2013, August 2015, and September 2016. Searches for this review were performed on multiple international and Nordic databases. In total 11 databases were searched including PsycInfo, SocIndex, and Medline. A substantial range of grey literature sources were searched including governmental repositories, targeted web sites and trial registers. We checked the reference lists of primary studies, hand-searched relevant key journals, and searched the Internet using Google and Google Scholar. We also contacted researchers who had published in the area of 12-step interventions. Neither language nor date restrictions were applied to the searches. The conclusions of this review are based on the most recent searches performed September 2016.
Selection criteria
Studies had to meet the following criteria in order to qualify for inclusion in the review: Intervention - only studies that considered 12-step interventions were eligible for inclusion. Study Design - only studies using a RCT/QRCT design or a QES with a well-defined control group were eligible for inclusion. Comparison - studies that compared 12-step to either no intervention or to other interventions were eligible for inclusion. Participants - only studies where the drug of choice of participants was an illicit drug (established either by self-report or via clinician) were eligible for inclusion. Where only a subset of study participants were illicit drug users, a study was only eligible if it reported outcomes separately for the subgroup of illicit drug users.
Data collection and analysis
Descriptive and numerical characteristics of included studies were coded by one review author. A second review author independently checked coding, and any disagreements were resolved by consensus. We used an extended version of the Cochrane Risk of Bias tool to assess risk of bias of included studies. One review author evaluated the risk of bias of all included studies. A second review author independently checked the assessment and disagreements were resolved by consensus. Random-effects meta-analysis was used to synthesise effect sizes. We compared 12-step to other interventions, and 12-step with add-on to other interventions with the same add-on. For each comparison we conducted separate meta-analyses by time: during treatment, at treatment end, and at 6-and 12-month follow-up. Sensitivity of the results to risk of bias was assessed. Publication bias was assessed by the use of funnel plots.
Main results
The total number of potentially relevant records was 21,974(database search: 17,416, grey literature search: 2,639, hand search and others: 1,919), of these 428 records were screened in full text. Thirteen reports met the inclusion criteria, with six reports contributing data on three independent studies. In total 10 studies were included in the review.
Seven of the included studies used a RCT design, two studies used a QRCT design, and one study used a QES design. One study, assessed as high risk of bias, was excluded from data synthesis. Thus, nine studies with a total of 1,071 participants contributed data to the analyses. These nine studies all considered outpatient settings where interventions were manual-based and delivered by trained therapists. In seven studies, treatment was partially or fully delivered in group therapy sessions. The reported statistical analyses were not corrected for this design element.
Seven studies contributed data to the comparison of 12-step intervention to alternative psychosocial interventions during treatment, at treatment end, and at 6-and 12-month follow-up. The seven studies did not all contribute data to all time points. Analyses did not reveal any statistically significant differences, for the primary outcome of drug use, between 12-step and the alternative set of interventions.
Three studies contributed data to the comparison of 12-step intervention with an add-on to alternative psychosocial interventions with an add-on. Drug use was assessed during treatment, post treatment, and at 6- and 12-months follow-up. All studies did not contribute data to all time points. We found no statistically significant effect size estimates during and post treatment. We found statistically significant effect size estimates at 6-month follow-up favouring 12-step with an add-on compared to alternative interventions with add-on (Hedges’ g =0.48, 95% CI: 0.06 to 0.90, and g=0.45, 95% CI: 0.03 to 0.88). No statistically significant effect size estimates were found at 12-months follow-up.
There was no strong indication of heterogeneity between studies (I2 did not exceed 75%). Results were robust to sensitivity analysis, and there was no observed evidence of publication bias.
Authors’ conclusions
The results of this review suggest that 12-step interventions to support illicit drug users are as effective as alternative psychosocial interventions in reducing drug use.
This conclusion should be seen against the weight of evidence. A total of seven studies contributed data to analyses comparing 12-step interventions and alternative psychosocial interventions. The power to detect differences was low, and estimated effect sizes were small. In addition most studies delivered treatment as group therapy, but did not correct the analysis for the dependence between participants assigned to the same group.
Only one study reported results of the effects of self-help group attendance on drug use. This study was excluded from synthesis following the risk of bias assessment. Given the preponderance with which self-help 12-step interventions are delivered in practice, further evidence regarding the effectiveness of this type of intervention is needed.
1 Background
1.1 DESCRIPTION OF THE CONDITION
Illicit drug production and use 1 remains a severe problem worldwide (United Nations Office on Drugs and Crime, UNODC, 2010). A central issue in reducing the worldwide drug problem is the demand for illicit drugs, and hence the need to identify effective methods for reducing their use.
Prescription and recreational drugs should be differentiated from one another. In this review, we reserve the term ‘drug use’ to apply to the illegal, nonmedical use of drugs. Globally, the United Nations Office on Drugs and Crime (UNODC) estimates that between 155 and 250 million people (3.5 to 5.7 percent of the population aged 15-64) used illicit substances at least once in 2008 (UNODC, 2010). Illicit substances include opium/heroin (opiates), coca/cocaine, cannabis 2 , and amphetamine-type stimulants (including MDMA/Ecstasy). Cannabis is the most commonly used illicit substance (with an estimated 129 – 190 million users worldwide), followed by amphetamine-group substances, cocaine and opiates. UNODC considers some types of drug use to be more problematic than others, and defines problem drug use as that which involves the injection of drugs or the long-duration/regular use of opioids, cocaine and/or amphetamines. For 2008, UNODC estimates that between 16 and 38 million people worldwide are problematic drug users (UNODC, 2010).
Drug use is linked to a range of health and social problems, including crime, prostitution, and homelessness (Office of National Drug Control Policy, ONDCP, 2000; Shelton, Taylor, Bonner, & van den Bree, 2009; Silbert, Pines, & Lynch, 1982). The European Monitoring Centre for Drugs and Drug Addiction estimates that drug-induced deaths account for approximate 4 percent of all deaths of Europeans aged 15-39 (European Monitoring Centre for Drugs and Drug Addiction, EMCDDA, 2010). A number of studies have attempted to estimate the social costs of drug use, in terms of both the direct cost and the indirect costs of drug use (EMCDDA, 2010). For Finland these costs have been estimated at between EUR 200 million and EUR 300 million in 2007, and in Scotland at EUR 5.1 billion in 2006.
The high human, social and economic costs of illicit drug use motivate the strong political interest in treatment for illicit drug use and in identifying effective treatments. The main types of treatment are cognitive-behavioural therapies, motivational enhancement, contingency management, psychoanalysis, network therapy and – the object of this review –12-step programs (Galanter & Kleber, 2008).
1.2 DESCRIPTION OF THE INTERVENTION
12-step approaches to the treatment of drug use are widespread in many countries. The oldest and most widely attended 12-step groups are provided by Alcoholics Anonymous (AA) that began in 1935 and have more than 2 million members according to their own recent membership survey (Alcoholics Anonymous, 2012; Mäkelä et al., 1996). The principles of AA serve as a model for other 12-step programs, of which Narcotics Anonymous (NA) is the largest focusing on drug use (Narcotics Anonymous, 2012). Today NA has more than 58,000 weekly meetings in 131 countries (Narcotics Anonymous, 2010). NA accepts all individuals with drug addiction, regardless of the particular drug or combination of drugs used. Other 12-step groups restrict themselves to specific types of abuse, such as Cocaine Anonymous, Pills Anonymous and Marijuana Anonymous (Cocaine Anonymous, 2012; Pills Anonymous, 2012; Marijuana Anonymous, 2012). The stated objective of the 12-step approaches is complete abstinence from the use of drugs, whereas other treatments such as psychosocial interventions or opioid substitution may focus on reducing drug use (EMCDDA, 2010). 12-step treatment approaches assume that, as a result of biological and/or psychological vulnerability, individuals have lost control over their drug use. Treatment attempts to bring about the individual's acceptance of the disease model of addiction, (i.e. that addiction is a lifelong disease), of an “addict” identity, and of abstinence as a treatment goal. It also attempts to motivate involvement in 12-step activities (for example, attending meetings, obtaining a sponsor, working through the 12 steps) (Finney, Noyes, Coutts, & Moos, 1998). The core ideology of the approach is to offer individuals a new way of living that will support them in breaking the cycle of addiction and in maintaining abstinence (Mercer & Woody, 1999). The suggested prescription for abstinence, referred to as the “six pack”, is: don't use no matter what, go to meetings, ask for help, get a sponsor, join a group, and get active (Laudet, 2008).
The 12-step self-help groups work to specific principles. The meetings typically adhere to a prescribed format including 12-step readings (The Preamble, How and Why, The 12 Steps) at the start of the meeting, and a reciting of the Serenity prayer at the end for individuals who wish to do so (Laudet, 2008). The disease model of addiction is central to the 12-step philosophy and recovery, and is seen as being a significant part of the process of attaining and maintaining abstinence. Recovery is viewed as a lifelong process, and members thus regard themselves as “recovering” (Mercer & Woody, 1999).
The basic idea is that individuals work their way into recovery by going through “12 Steps” starting with the recognition of being addicted to drugs, also known as “hitting the bottom” 3 , and ending with the capability of helping others out of their own addiction (Narcotics Anonymous, 2008). A central element in the 12-step self-help groups is that participation is voluntary and that recovering individuals, and not professional staff, guide the treatment. Another important component is sponsorship whereby a member who has made progress in the 12-step recovery program shares his or her experience on an individual and continuous basis with another member who is attempting to attain or maintain abstinence through the 12 steps (Straussner & Spiegel, 1996; Laudet, 2008). Sponsors share their own “experience, strength and hope” with the sponsees and accompany them in working the steps towards recovery. The idea is that sponsorship also helps oneself in maintaining abstinence, formulated as: “the cardinal virtue of sponsorship is the momentary loss of self-centeredness” (Jennings & Alcoholics Anonymous, 1990). Sponsorship is something that a member her/himself decides to become involved in. In addition, sponsors themselves have their own sponsors who help them in their own struggle for abstinence (Narcotics Anonymous, 2008).
The exact wording of the 12 steps differs slightly between groups – the 12 steps of NA are presented in section 10.1 (Narcotics Anonymous, 2008). The steps contain a strong spiritual emphasis and encourage members to look outside themselves for strength (to seek a higher power) and to embrace spiritual values and practices that are outlined in the 12 steps. “A power greater than ourselves” is mentioned in step 2 and “God as we understand Him” in step 3. In addition, the steps emphasise the importance of reconstructing relationships with people who have been harmed by the drug use (e.g., family members). Inherent in the 12 steps is the realisation that addiction is a disease and as such is beyond personal influence. However an individual can decide to change and oppress disease. The strong spiritual emphasis is unique to the 12 steps and the texts that are used include wording that appear religious. On the other hand, the texts do not endorse a particular faith and the “God as we understand Him” phrase is open to interpretation. The spiritual emphasis may mean that some drug users are opposed to the intervention for ideological reasons, and hence the claim made by some that 12-step only works for individuals with the right motivation and outlook on life (Fiorentine, 1999).
The “12 Steps” are accompanied by “12 Traditions” providing guidelines for the self-help groups (Narcotics Anonymous, 2008). The 12 traditions of Narcotics Anonymous are presented in section 10.1. Because the individual groups are autonomous, there can be differences between them, but the basic concepts are the same. Each group meets at a regular time and place, and is in principle open to all drug users – the only requirement being the wish to become “clean”. Attendance is decided individually, but beginners are encouraged to attend “90 meetings in 90 days”. Furthermore, participation is not time-limited and the time needed to do the steps is also decided individually (Straussner & Spiegel, 1996). Often, drug users who have succeeded in attaining abstinence continue to participate in the meetings for years, and continue working the steps day after day. Abstinence anniversaries or birthdays are considered major accomplishments and an important way to mark success in attaining abstinence.
In addition to the self-help groups, 12-step approaches are used in Twelve Step Facilitation (TSF) treatments (MATCH, 1997; Ries, Galanter,& Tonigan, 2008). These are typically of limited duration and organised around a treatment facilitation centre staffed by professionals, with treatment based on 12-step principles. In short, TSF is the integration of 12-step self-help groups with professional treatment. Usually, the individual will participate in 12-step meetings (NA or other) after completing TSF treatment, and a parameter of success for the TSF treatment is that the individual becomes motivated and ready for the self-help group. The best known TSF treatment is the “Minnesota model”, originating from three centres founded in Minnesota in the late 1950s (Cook, 1988). The Minnesota model is characterised by the use of the 12-step philosophy as a foundation for therapeutic change, where the treatment goal is total abstinence. TSF treatment can be delivered in both inpatient and outpatient settings; the duration of the treatment can vary, but is typically around 12-24 weeks.
A cardinal rule of both TSF and self-help groups is anonymity. In attempt to protect individuals from society's stigmatisation, the 12-step approach gives priority to preserving members’ anonymity. Anonymity inevitably poses a challenge to research.
In this review, the focus is on 12-step treatments for users of illicit drugs, and we will include both treatments based on self-help groups working with the 12 steps (like NA) and TSF treatments. Since drug users may also be alcohol dependent (Kessler et al., 1997), we will include studies where alcohol misuse is present provided drug abuse is the key drug of choice of participants. Thus, although alcohol can be part of the substance abuse we do not consider 12-step treatments primarily dealing with and aimed at treating alcohol dependency.
1.3 HOW THE INTERVENTION MIGHT WORK
The 12-step interventions included in this review are aimed at supporting the substance users to refrain completely from or reducing their use of illicit drugs. Abstinence is achieved by the drug user through working his/her way through the 12 steps. A central issue that dates back to the AA tradition is the acknowledgement of the addiction, and the acceptance of support by a sponsor in a self-help group, or by professionals in a TSF setting. One of the keys to success posed by the AA, and hence the NA, is “the therapeutic value of addicts working with other addicts” along with the cardinal idea that the 12 steps offer “a design for living”, a way of learning to live, that teaches skills and helps individuals to navigate and reach recovery (Alcoholics Anonymous, 2005; Narcotics Anonymous, 2008). The steps are carefully organised in an order, starting with the basic skills and continuing to the more advanced changes, that individuals should gradually seek to integrate into their lives. Having a sponsor and being a sponsor is an important part of 12-step self-help groups. Sponsorship is viewed as an important tool in the process of recovery in that it helps to grasp the components of living, offers encouragement and support such as when relapse occurs, but it may also “kill” any complacency among the sponsors themselves, and thereby help them sustain their self-monitoring (Hornbacher, 2010). Also, central to the NA program is the statement that spirituality mediates 12-step involvement and later abstinence. It is suggested that, by working the 12 steps, one will have a spiritual awakening, and that continued practice of spiritual principles will lead to sustained abstinence (Narcotics Anonymous, 2008).
The benefits associated with involvement in 12-step programs, and the mechanisms by which these benefits occur, have been thoroughly explored over the past two decades. Relatively little is known, however, about which specific behaviours catalyse the therapeutic psychological mechanisms. Self-efficacy, or the confidence to remain abstinent, has been identified as a major component and a consistent predictor of subsequent improvement (Moos & Timko, 2008; MATCH, 1997). The importance of spirituality for later abstinence is currently unclear (Maude-Griffin et al., 1998; Moos & Timko, 2008; Tonigan & Connors, 2008). Regarding sponsorships, Humphreys & Noke (1997) point out that this social network component of treatment can be more effective in helping the substance user than the support from concerned family members. The reliance on positive reinforcement (e.g., by recognising abstinence anniversaries) and behavioural modelling (e.g., by having a sponsor) have also been proposed as an underlying mechanism of change (Morgenstern, Bux, & Labouvie, 2002; Witkiewitz & Marlatt, 2011). Membership demographics for Narcotics Anonymous collected at the 2009 World Convention of NA in Barcelona, Spain reveal that more men than women are members (58% vs. 42%); only very few teenagers are members of NA (2%), whereas the most typical member is aged 41-50 years (34%); ethnicity is dominated by Caucasians (73%) and most members are employed (71%) (Narcotics Anonymous, 2010). Perhaps due to this profile, Fiorentine (1999) notes that the 12 steps have been argued to work best for Christian, white, middle-class males. According to Fiorentine (1999) studies fail to support this view. Fiorentine (1999) also accentuates that 12-step interventions may also be inappropriate for drug users with major psychiatric disorders, drug users in early stages of addiction, and drug users uncomfortable with the religious or spiritual emphasis.
Treatment setting may also affect models of treatment and participant characteristics. In inpatient settings, patients stay at the treatment facility overnight and possibly for extended periods of time. Treatment typically includes a first period of detoxification followed by initial intensive treatment, including preparing patients for returning to community-based care settings. Patients participating in treatments in outpatient settings typically stay in their own home, while attending treatment at a treatment facility. Due to the nature of treatment in- and out-patient settings may differ substantially in participant characteristics such as e.g. substance abuse severity, clinical symptoms, consequences from use, motivation, and labour market attachment.
The criminal justice system in the US is responsible for a substantial proportion of referrals to community-based treatment programs. Legal referral may consists of a probation officer's recommendation to enter treatment, the choice in a drug court between jail time and treatment, the requirement of a judge to enter treatment as a precondition for probation, etc. (Farabee, Prendergast, & Anglin, 1998). The degree of legal pressure that the patient faces to comply with treatment may affect his/her motivation for change. Intrinsic motivation, understood as the patient's willingness to change his/her substance use, has been linked as key to treatment success (e.g. Prochaska, & DiClemente, 1982). As such, court-mandated treatment may be expected to lead to less desirable treatment outcomes since enrolment is due to legal pressure and not intrinsic motivation (Farabee, Prendergast, & Anglin, 1998). Even patients who enter “voluntarily” may face pressure in the form of social pressure from e.g. family and friends (Perron, & Bright, 2008). Perhaps surprisingly, mandated treatment patients show substance abuse outcomes similar to and sometimes better than voluntary treatment patients (Kelly, Finney, & Moos, 2005). This may partly be explained by patient characteristics. Kline (1997) found that legally referred patients were younger, involved fewer African-Americans, less substance use, and fewer drug-related health problems compared to voluntary patients in residential treatment. Kelly, Finney, & Moos (2005) examined treatment retention and treatment outcomes at Veteran Affairs residential treatment facilities, where a main program component was 12-step group involvement. The justice system involved (JSI) patients had lower severity of substance abuse, fewer consequences of abuse, were younger, more likely to be white, and were less motivated for treatment than those who were not justice system involved in the same program. JSI patients, particularly JSI patients who were mandated to treatment, showed similar or better outcomes for abstinence and remission at 1 and 5 years post treatment, even after controlling for pre-treatment differences.
1.4 WHY IT IS IMPORTANT TO DO THE REVIEW
Illicit drug use has significant costs for individuals and societies in terms of social, health and criminal problems. 12-step programs are one of the most widespread treatments for drug use internationally. The general belief among clinicians is that 12-step is an effective approach (Forman, Bovasso, & Woody, 2001). In the US, for example, it is common procedure by courts to mandate 12-step treatment. Although a large number of studies have examined the use of the programs, no systematic knowledge of the effectiveness of the intervention is currently available. This is, in part, due to the strict anonymity policy and the insistence on fluid membership, especially in the self-help groups, which makes it difficult for researchers to track members.
A Cochrane review evaluated the effectiveness of 12-step programs on alcohol dependence. Ferri, Amato, & Davoli (2006) provided a narrative synthesis of the effectiveness of 12-step approaches (like AA or TSF) compared with alternative psychosocial interventions (e.g. cognitive behavioural therapy, motivational enhancement therapy, relapse prevention). They concluded that 12-step approaches were as effective as alternative approaches in terms of improving drinking consequences, and reduction of alcohol consumption. Ferri and colleagues did not explicitly exclude co-dependence on illicit drugs, nor did they report whether participants, in the eighttrials that were included in the review, had comorbid substance dependence. Treatment effectiveness for comorbid participants treated for alcohol disorder might inform the effectiveness for participants included in the present review. Even so, prevalence of alcohol disorder only in the US was 7.35 percent, the prevalence of any drug use disorder was 2.00 percent, and the comorbidity of alcohol and (any) drug use disorder was 1.10 percent (2001-02 National Epidemiologic Survey on Alcohol and Related Conditions; Stinson, Grant, Dawson, Ruan, Huang, & Saha, 2005). This suggests that while comorbidity is not uncommon in the population, there is substantial non-overlap between populations. As such, one should be cautious in extrapolating results from Ferri, Amato, & Davoli (2006) to the population of interest to this review. Furthermore, individuals dependent on drugs, particularly illicit drugs, are often forced into a lifestyle that differs considerably from individuals who are dependent on alcohol, due to the criminal aspects of drug use. People who are drug dependent are often engaged in illegal activity when obtaining their substance of dependence and/or the capital needed for its procurement. Research also suggests that it may be more difficult for the drug user to benefit from the 12 steps compared to the individual who is dependent on alcohol, possibly due to the particular impact of drugs on brain neurons (Laudet, 2008).
With its broad applicability, minimal cost, and potential benefit, the 12-step approach has great appeal to policy makers. Knowledge about the effectiveness of the method compared to other treatments, as well as knowledge about the effect of different program elements, will therefore be of considerable interest to policy makers and practitioners.
2 Objectives
The objective of this review was to assess the effectiveness of 12-step programs to reduce illicit drug use. The following questions were addressed to determine the effectiveness of 12-step programs aimed at illicit drug users: reducing illicit drug use, during treatment, at treatment end, and at follow-up, compared with no intervention or a competing psychosocial intervention, and when used in conjunction with either a pharmaceutical add-on or another psychosocial add-on? reducing criminal behaviour and prostitution, during treatment, at treatment end, and at follow-up, compared with no intervention or a competing psychosocial intervention, and when used in conjunction with either a pharmaceutical add-on or another psychosocial add-on? reducing psychiatric symptoms, during treatment, at treatment end, and at follow-up, compared with no intervention or a competing psychosocial intervention, and when used in conjunction with either a pharmaceutical add-on or another psychosocial add-on? improving social functioning, during treatment, at treatment end, and at follow-up, compared with no intervention or a competing psychosocial intervention, and when used in conjunction with either a pharmaceutical add-on or another psychosocial add-on? improving employment status, during treatment, at treatment end, and at follow-up, compared with no intervention or a competing psychosocial intervention, and when used in conjunction with either a pharmaceutical add-on or another psychosocial add-on? reducing homelessness, during treatment, at treatment end, and at follow-up, compared with no intervention or a competing psychosocial intervention, and when used in conjunction with either a pharmaceutical add-on or another psychosocial add-on? improving treatment retention, during treatment, at treatment end, and at follow-up, compared with no intervention or a competing psychosocial intervention, and when used in conjunction with either a pharmaceutical add-on or another psychosocial add-on?
3 Methods
3.1 TITLE REGISTRATION AND REVIEW PROTOCOL
The title for this systematic review was approved by The Campbell Collaboration on 16 October 2010. The review protocol was approved on 2 September 2013. The title registration and protocol are available at: https://www.campbellcollaboration.org/library/12-step-programmes-illicit-drug-abuse-reduction.html
3.2 CRITERIA FOR INCLUDING STUDIES IN THE REVIEW
The purpose of this review was to synthesise the best available evidence on the effects of 12-step programs, broadly understood as participation in self-help programs or manual based programs designed to reduce illicit drug use and delivered in in- or out-patient settings. No restrictions on the language or the publication status of studies were applied. When we could not determine whether a report met the inclusion criteria we attempted to contact investigators. We applied a time limit of 14 days from sending our inquiry. If the study investigators notified us before this deadline that they would be able to provide the information in a short time, we included the information. If investigators did not reply to our inquiry in time, the study was listed as “Awaiting classification”. All inquiries and answers were stored electronically.
The following criteria were used to select studies eligible for synthesis.
3.2.1 Types of study designs
Study designs eligible for inclusion were: Randomised Controlled Trials (RCTs)– studies where individual participants, or group of participants were randomised to control or treatment conditions, including trials that randomly assigned individual participants to group treatment. Quasi-randomised controlled trials (QRCTs) -where participants were allocated by, for example, alternation, birth date, date of the week, case number or alphabetical order, to treatment or control conditions. Quasi-experimental studies (QESs) – studies where participants were assigned to control and treatment conditions in a non-random manner with a control group where pre-treatment group equivalence is demonstrated via matching, statistical controls, or where there is evidence of equivalence on key risk variables (see section 3.4.2), or where key risk variables are controlled for statistically.
We justified the inclusion of QRCTs and QESs because the open-door membership policy of 12-step programs generally, and for the self-help groups in particular, may pose considerable problems in assessing the effectiveness of treatment using a RCT design. In addition, studies that utilise quasi-experimental designs may produce as efficient and unbiased estimates of intervention effects as studies utilising a RCT design (Shadish & Cook, 2009).
3.2.2 Types of participants
The population included participants who used illicit drugs, regardless of age, gender or ethnic background. We included participants who used one or more types of illicit drugs.
Many studies included participants with both alcohol and drug use. Studies where alcohol use dominated drug use, either in consumption or in severity as measured by, for example, the Addiction Severity Index (McLellan, Luborsky, Woody, & O'Brien, 1980), were excluded. Studies that included participants who had both participants with illicit drugs or alcohol as their drug of choice were only included if they reported outcomes separately for participants with illicit drugs as their drug of choice. When the reported information on usage was insufficient for a judgement to be made, we contacted the study authors for clarification and used this information to determine whether the study should be included.
We included studies of individuals who were enrolled in 12-step treatment regardless of the way in which their problem was labelled, and we regarded the terms ‘use’, ‘abuse’, ‘misuse’ or ‘dependence’ of illicit drugs as equivalent.
3.2.3 Types of settings
The review included studies in which treatment was delivered in inpatient, outpatient, or self-help groups.
3.2.4 Types of interventions
The review included studies evaluating 12-step interventions (in either the self-help or TSF format) delivered with the explicit aim of stopping or reducing illicit drug use. The following core principles were present in the studies with 12-step intervention: Addiction was viewed as an illness. There was a theme of spirituality (for example, a belief in a higher power). The individual discussed problems within a fellowship of peers trying to help and encourage one another. General guidance was provided in the “12 Steps”.
We included studies evaluating interventions that used the 12-step principles regardless of setting (for example, inpatient or outpatient) or the duration of treatment. 12-step interventions that focused solely on treating alcohol dependency, such as AA programs, were excluded even though the study participants may also have been addicted to illicit drugs.
3.2.5 Types of comparisons
Eligible comparison conditions were no intervention, a waitlist control condition, or any other intervention(s).
3.2.6 Types of outcomes
Given that 12-step treatment accepts abstinence as the only successful treatment outcome, the primary outcome for this review was abstinence or reduction of drug use as measured by: Biochemical tests Estimates of drug use
Secondary outcomes were as follows: Criminal behaviour Prostitution Psychiatric symptoms Social functioning Employment status Homelessness Retention
Primary outcome measures might be reported in the form of urine toxicology screens, as self-reports of drug use (or reported by others such as parents, caregivers, or therapists) either as a prevalence measure, or a measure of use in the past month such as the Timeline Follow Back instrument (Sobell et al., 1996), or the relevant portion of the Addiction Severity Index (McLellan et al., 1980). Studies were only included if they considered one of the primary outcomes.
Secondary outcomes, such as criminal behaviour and prostitution, may be self-reported, such as from the Addiction Severity Index sub-components (criminal and legal), registers or files. The Symptom Checklist-90-R (SCL-90-R) (Derogatis, 1983) or a similar validated scale may be used to report outcomes relating to psychiatric outcomes. Social functioning may be measured by the Social Functioning Questionnaire (SFQ) (Tyrer et al., 2005) or a similar validated scale. Employment and homelessness might come from self-report, or registers. Finally, retention could be measured in a variety of ways, such as the study authors’ own conception of treatment completion, number of sessions attended, or percentage of sessions attended. Types of Time Points
Outcomes were considered at the following intervals: During treatment. All studies that provided numerical effect sizes for synthesis were psycho-social manual-based interventions delivered by professional or trained therapists. Many studies provided primary outcome measures while participants were being treated. Post treatment/treatment end. Post treatment measures were taken directly after the end of intervention, or shortly thereafter. Follow-up. Follow-up outcome measures were taken between 1 and 18 months after the end of treatment.
This classification of relevant time periods follows the convention frequently reported in the literature and differs slightly from that outlined in the published protocol (see section 8.2 for further details).
3.3 SEARCH METHODS FOR IDENTIFICATION OF STUDIES
3.3.1 Electronic searches
Relevant studies were identified through electronic searches of bibliographic databases, government policy databanks and internet search engines. No date or language restrictions were applied to the searches. All databases where searched in the original search in January 2010. Access to some databases has changed throughout the four updated searches to this review. The date of the last search was September 19, 2016. The following bibliographic databases were searched:
ASSIA - (Searched through ProQuest) - Searched until July 2013 – no access for further years Cochrane Library (including CENTRAL) - Embase (Searched through OVID host) - Searched until 19. September 2016 Medline (Searched through OVID host) - Searched until 19. September 2016 PsycINFO (Searched through EBSCO host) - Searched until 19. September 2016 CINAHL (Searched through EBSCO host) - Searched until July 2013 - no access for further years Science Citation Index (Searched through ISI Web of Science) - Searched until 19. September 2016 Social Science Citation Index (Searched through ISI Web of Science) - Searched until 19. September 2016 SocINDEX (Searched through EBSCO host) - Searched until September 2016 Sociological Abstracts (Searched through ProQuest) - Searched until 19. September 2016 Dissertation Abstracts(Searched through ProQuest) – Searched until 19. September 2016
The following Nordic library databases were searched: BIBSYS - Bibliotek.dk - DiVA (Digitale vetenskapeliga arkivet) - LIBRIS - SweMed+ - Artikelsök -
3.3.2 Search terms
Exact search strategies for each database can be found in section 9.1.
3.3.3 Searching other resources
We examined the reference lists from relevant reviews identified in the electronic searches, and from included primary studies for studies that potentially met inclusion criteria. In addition, international experts were contacted to attempt to identify unpublished and on-going studies.
3.3.4 Grey literature
The search strategy for the grey literature search was based on the search string for the electronic database search. Due to the limited search capacity on grey literature information resources, web pages and search engines, a shortened search string was used. An example of the search strategies used to identify grey literature and google searches can be found in section 9.1. The most recent search for grey literature was performed September 6, 2016. Following websites and resources were searched for relevant grey literature: Canadian Evaluation Society - http://evaluationcanada.ca/ - Searched 3. September 2016. NARCIS (National Academic Research and Collaborations Information System) - http://www.narcis.nl/about/Language/en – Searched 3. September 2016. Government of Canada - https://www.canada.ca/en/index.html - Searched 3. September 2016.
USA.gov - https://www.usa.gov/ - Searched 3. September 2016. Australian Government - http://www.australia.gov.au/about-government/publications- Searched 3. September 2016. Ministry of Social Affairs and the Interior - http://sim.dk/publikationer.aspx - Searched 3. September 2016. Government Offices of Sweden - http://www.government.se/ - Searched 4. September 2016. Government.no - https://www.regjeringen.no/en/id4/ - Searched 4. September 2016. European Union - https://europa.eu/european-union/index_en - Searched 4. September 2016. Theses Canada Portal - http://www.bac-lac.gc.ca/eng/services/theses/Pages/theses-canada.aspx - Searched 4. September 2016. National Library of Germany - http://www.dnb.de/EN/Home/home_node.html - Searched 4. September 2016. Social Care Online - http://www.scie-socialcareonline.org.uk/ - Searched 4. September 2016. DART-Europe E-theses Portal - http://www.dart-europe.eu/basic-search.php - Searched 4. September 2016. Information for Practice - http://ifp.nyu.edu/archive/ - Searched 4. September 2016. Open Grey - http://www.opengrey.eu/ - Searched 5. September 2016. National Institute on Drug Abuse - https://www.drugabuse.gov/ - Searched 5. September 2016. European Monitoring Centre for Drugs and Drug Addiction - http://www.emcdda.europa.eu/ - Searched 5. September 2016. Sbustance Abuse and Mental Health Services Administration - http://www.samhsa.gov/data/node/20 - Searched 5. September 2016. NCJRS (National Criminal Justice Reference Service) - https://www.ncjrs.gov/index.html - Searched 6. September 2016.
Additional searches were conducted using Google and Google Scholar, and the first 200 hits were examined in each case.
3.3.5 Hand searching
Searching was performed on journal editions from January 2010 to September 2013 and finally from August 2015 to September 2016 in attempt to identify any published studies that may not have been found in the electronic search. The most recent hand search was performed September 26, 2016. The following five international journals was hand searched for relevant studies:
Addiction – Searched 26. September 2016.
Journal of Consulting and Clinical Psychology - Searched 26. September 2016.
Journal of Substance Abuse Treatment - Searched 26. September 2016.
Journal of Clinical and Adolescent Psychology - Searched 26. September 2016.
Research on Social Work Practice - Searched 26. September 2016.
3.3.6 Selection of studies
The screening process was executed in two separate phases.
Phase 1: Two review team members independently screened each title and abstract obtained from the search procedures for inclusion. Each reviewer coded each citation according to the pre-specified inclusion criteria. This information was stored in a Reference Manager database. Disagreements were handled by discussion and consensus agreement.
Points of discussion included whether the design of the study met the inclusion criteria, and whether outcomes reported were consistent with the focus of the present review. The decisions available to the reviewer were: (1) ‘In’ (include for full article scan), (2) ‘Unclear’ (include for full scan), and (3) ‘Out’ (citation eliminated).
Citations that met the initial inclusion criteria were retrieved for full review using available library resources.
Phase 2: Two review team members independently screened the full articles for inclusion. As with the previous procedure, the studies were screened against the inclusion criteria, with results tracked in an Excel database. If the citation was excluded at this stage, the reviewer provided a brief description of the reason for dismissal. When there was a disagreement, two reviewers discussed the citation and reached an agreement.
3.4 DATA COLLECTION AND ANALYSIS
3.4.1 Data extraction and management
Study level data such as author, year, and report type were extracted. In addition intervention characteristics, such as duration, intensity, type of delivery (e.g. group or individual), fidelity, outcome assessors, were coded. Most of this information was used in the risk of bias assessment of each study. Outcome measurements were also extracted. If relevant effect sizes could be extracted directly, this information was coded. If the report did not provide effect sizes directly, reviewers extracted other information, such as the t- statistic and the sample size, which would allow effect sizes to be calculated. If sufficient information was not provided in the report, this was coded, and provided the basis for the detailed data requests made to the report authors. The full codebook is available in section 7.2 of the protocol.
One reviewer extracted descriptive and numerical data from the included studies. A second reviewer checked all coded information for accuracy, and in case of discrepancies, reviewers would jointly agree on the final coding. The data were coded and stored electronically in Microsoft Excel.
When descriptive or numerical data were not available in the published reports or only partly available we contacted the authors, requesting the required information. Eight reports comprising seven corresponding authors contained insufficient information for relevant effect sizes to be extracted. In line with the protocol for the review, we contacted the authors, requesting the information and allowed a two-week deadline 4 from the initial attempt to contact the corresponding author. One author team, comprising two reports, responded positively to our enquiries and provided the necessary missing data. Thus for these reports data were complete; indeed, we were able to code outcomes that were not available in the published reports.
3.4.2 Assessment of risk of bias in included studies
We assessed the methodological quality of studies using a risk of bias model developed by Prof. Barnaby Reeves in association with the Cochrane Non-Randomised Studies Methods Group 4 . This model is an extension of the Cochrane Collaboration's risk of bias tool; it covers risk of bias both for RCTs, and risk of bias for non-randomised studies with a well-defined control group. The point of departure for the risk of bias model is the Cochrane Handbook for Systematic Reviews of Interventions (Higgins & Green, 2008). The risk of bias model for non-randomised studies is an elaboration of the existing Cochrane risk of bias tool and incorporates particular attention to selection bias and risk of confounding. The extended tool includes assessment of risk of bias on a 5-point scale for some items.
3.4.2.1 Risk of bias judgement items
The risk of bias model is based on nine items (see 9.4.1). For some items, risk is assessed to be High, Low, or Uncertain; other items are judged on a 5-point scale where 1 corresponds to No/Low risk of bias and 5 correspond to Yes/High risk of bias. A score of 5 indicates that the risk of bias is sufficiently high that the findings will not be considered in the data synthesis (because they are more likely to mislead than inform).
The nine risk of bias items concern
3.4.2.2 Confounders
An important part of the risk of bias assessment for a non-randomised study is how the confounding factors have been dealt with (see9.4.2.2). Selection bias is understood as systematic baseline differences between groups, which can compromise comparability. Baseline differences can be observable (e.g., age and gender) and unobservable to the researcher (e.g. motivation and “ability”). There is no single non-randomised study design that resolves the selection problem in all circumstances. Different designs attempt to solve the problem under different assumptions and require different types of data, particularly in relation to factors that are unobservable. The “right” method depends on the assumptions about the nature of the process by which participants are selected into a program. As there is no universally correct way to construct counterfactuals, we assessed the extent to which the identifying assumptions (the assumption that makes it possible to identify the counterfactual) were explained and discussed by the study investigators.
In this review, the risk of bias from confounding is an additional item for each non-randomised study, and were assessed for each outcome. Such an assessment requires a list of pre-specified potential confounders. We identified the following confounding factors as the most relevant: Age Gender Socio-economic status Mental health problems History of drug use
The motivation for focusing on these confounders was that they are major risk factors related to drug use. Young people have a higher risk of use than older people (Labouvie, 1996), women have lower risk than men and have different drug use patterns (Brady & Back, 2008), and people with poor socio-economic status have higher risk (Spooner & Hetherington, 2004). The issue of drug users with mental health problems needs special attention, because the mental health problems can interfere with the effect of the drug treatment (Ross, 2008). Finally, the history of drug use is important for the likelihood of treatment success, e.g. duration of use and previous treatment (Greenfield & Hennessy, 2008). We also assessed how each study dealt with factors that are unobservable.
The risk of bias item takes into account the following: Proportion of confounders considered. Whether most important confounders were considered. Precision with which confounders were measured. Extent of imbalance between groups at baseline. Care with which adjustment was done.
The final judgement of this risk of bias item was made on a scale from 1 to 5 (or unclear), where a score of 1 reflects low risk and a score of 5 reflects a high risk of bias in relation to confounding. For a judgement of low risk of bias in this item, all important confounders should be balanced at baseline or measured “well” and “carefully” controlled for in the analysis. The final judgement of the confounding item is included in the overall risk of bias table.
One review author evaluated the risk of bias of all included studies. A second review author independently checked the assessment and disagreements were resolved by consensus.
3.4.3 Effect size calculations
Effect sizes were extracted from each included study by the methods described below. Two effect size measures were used in the review. For continuous measures we calculated effect sizes as standardised mean differences (Hedges’ g). For dichotomous outcome data we calculated the odds ratio. Where appropriate effect sizes were recoded such that a positive effect size reflected an outcome that favoured the 12-step intervention (see also 4.4).
The primary outcome for the review was drug use. Seven studies (Carroll et al. 1998; Carroll et al., 2012; Higgins et al., 1991; McKay et al., 1997; Petry et al., 2010; Schottenfeld et at., 2011; Wells et al., 1994) reported drug use on a continuous scale. Six studies reported drug use on a discrete scale (Bisset, 2002; Caroll et al., 1998; Higgins et al., 1991; Maude-Griffin et al., 1998; Petry et al., 2010; Schottenfeld et al., 2011). Continuous measures were outcomes such as “days of cocaine use per week”, whereas the dichotomous outcomes measured constructs such as “(complete) abstinence” (e.g. Bisset 2002, Maude-Griffin et al., 1998). Because continuous outcome measures were reported in a majority of studies, and because the dichotomous outcome could be considered a dichotomised version of an underlying continuous construct we used the standardised mean difference (Hedges’ g). By transforming the relevant effect sizes we were able to include them in the same meta-analysis, thereby increasing power to detect possible differences. We transformed effect sizes from log odds ratio to standardised mean difference, for those studies that only reported drug use on a discrete scale. If a study reported both a continuous and a discrete scale measure for the same time point, we used the outcome reported on a continuous scale. Effect sizes were transformed for Bisset (2002) (post and follow-up measure), Maude-Griffin et al. (1998) (during, post and follow-up), Petry et al. (2010) (follow-up), and Schottenfeld et al. (2011) (follow-up).
All secondary outcomes, apart from retention, were reported on a continuous scale. Therefore effect sizes for these outcomes were calculated as standardised mean difference (Hedges’ g). Five studies (Bisset et al., 2002; Carroll et al., 1998; Carroll et al., 2012; Higgins et al., 1991; Schottenfeld et al., 2011) reported retention as a discrete measure (“treatment completion”) and four studies reported retention on a continuous scale, such as “number of sessions attended” (Caroll et al., 2012; McKay et al., 1997; Petry et al., 2010; Wells et al., 2010). Because dichotomous outcome measures were in the majority and we stated “treatment completion” as the outcome measure of interest in the protocol (section 3.1.4) a log odds ratio effect size was chosen. We transformed effect sizes to log odds ratio, for those studies where only a continuous scale effect size for retention was available (McKay et al., 1997; Petry et al. 2010; Wells et al., 1994).
Where appropriate outcomes were recoded such that a more positive score reflected an improvement of the outcome in question. For example Caroll et al. (2012) used self-reports in the Timeline Followback to measure drug use as “number of days per month using cocaine”. In this case, using raw outcomes, a superior outcome of 12-step over the alternative intervention would imply a negative effect size. Accordingly these estimated effect sizes were multiplied by -1.
The table in section 11.2 presents outcome measures by study and time of measurement.
3.4.3.1 Discrete data
For discrete measures, the effect size was calculated as the log odds ratio (LOR). The LOR and its approximate standard deviation were calculated as (Lipsey & Wilson, 2001:53-54):

where a is the frequency of “good” outcomes in the treatment group (e.g. the number retained), b is the frequency of “bad” outcomes in the treatment group (the number of participants who were not retained), and c and d are the number of good and bad outcomes in the control group, respectively.
When appropriate (for studies that only reported a discrete measure for drug use at a given time point) we transformed the LOR to Hedges’ g using the Cox-transformation (see section 3.4.3.4).
3.4.3.2 Continuous data
For continuous measures, we calculated the effect sizeas the standardised mean difference (Hedges’ g), and applied the small N correction. Hedges’ (adjusted) g and its standard error are calculated as (Lipsey & Wilson, 2001:47-49)

where N = n1 + n2
is the total sample size,

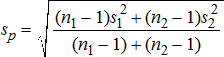
Here, s1 and s2 denotes the standard deviation of the two groups.
When data were not available we extracted the effectsize from auxiliary statistics. For example Wells, Peterson, Gainey, Hawkins, & Catalano (1994) reported means and the t- statistic for retention, but nostandard deviation. By using standard techniques (Lipsey & Wilson, 2001) we were able to construct an effect size.
When appropriate (for studies that only reported a continuous measure for retention) we transformed Hedges’ g to LOR using the Cox-transformation (see section 3.4.3.4).
3.4.3.3 Data from graphs and figures
When data in the reports were insufficient to construct an effect size, we attempted to contact study authors directly. We only successfully established contact with one group of authors who had retained primary data or summary statistics. Three studies (Higgins et al., 1991; Schottenfeld et al., 2011; Maude-Griffin et al., 1998) provided graphs or figures that permitted the construction of relevant effect sizes, either directly or with additional assumptions. In these instances, and in order to base the meta-analysis on as much data material as possible, we attempted to recover effect sizes from graphs and figures provided. For each of these three studies, two members of the review team (MB and TF) independently took measurements, results were compared, and a consensus measurement agreed upon.
From Figure 1 (p. 1222, top panel) in Higgins, Delaney, Budney, & Bickel, (1991) we constructed a measure of drug use during the intervention based on number of weeks abstinent. Since we knew the total number of participants assigned to each condition, we were able to reconstruct individual durations of abstinence. We used a ruler to convert the percentages reported in the figure to number of participants. From this data, means and standard deviations by condition were constructed and formed the basis for calculating effect sizes.
Schottenfeld, Moore, & Pantalon (2011) did not provide any numerical data that were directly amenable to meta-analysis. Instead, data were constructed from Figures 3 and 4 (drug use during and at 3 months follow-up, respectively). We were able to read precise individual participant measurements from Figure 3. From these measurements, means and standard deviations by condition were constructed. In order to construct measurements of the 3 months follow-up, we used the information provided in Figure 1 about how many participants were followed up, and we used a ruler in order to get an accurate measure of the point prevalence of percent abstinent by condition. We then constructed a 2 × 2 frequency table.
We constructed effect sizes for Maude-Griffin et al. (1998) posttreatment and at 14-week follow-up in a similar fashion. Maude-Griffin et al. (1998) did not provide the sample size at each measurement point by condition, but did report overallfollow-up rates. Under the assumption that follow-up rates were independent of assignment, we were able get a measure of the “percent of subjects abstinent from cocaine” by taking measurements with a ruler. We constructed the 2 × 2 frequency table from these measurements.
3.4.3.4 Effect size transformations
We used the Cox-transformation to transform continuous scale effect sizes (Hedges’ g) to log odds ratio and vice versa. The Cox-transformation for the effect size and the associated standard error is (Sánchez-Meca, Marín-Martínez, & Chacón-Moscoso, 2003):

We applied the transformation from LOR to g for drug use, and from g to LOR for retention, where appropriate.
3.4.3.5 Dependent effect sizes
Dependencies between effect sizes may occur for a multitude of reasons, including when studies are multi-arm trials. For example, Carroll, Nich, Ball, McCance, & Rounsavile (1998) conducted a 5 arm trial. In 3 of these, disulfiram was given as an add-on to the psychosocial interventions: TSF, CBT, and CM. Since the comparisons relevant to this review involve TSF against an alternative, the comparisons between TSF/CBT and TSF/CM are dependent.
A study may also report several effect sizes for the same theoretical construct. For example, Petry, Weinstock, Alessi, Lewis, & Dieckhaus (2010) measured “drug use” during treatment both as longest consecutive number of weeks of negative samples submitted and also as the proportion of negative samples submitted.
Effect sizes may also be serially correlated, such as when a study contributes effect sizes at several time points. Where this occurred, only one outcome measure per construct was retained for meta-analysis.
Data from multi-arm trials were synthesised in different meta-analyses. We also split analyses by time points to avoid dependencies between effect sizes.
3.4.3.6 Unit of analysis issues
If designs other than individually randomised, parallel-group randomised trials were included, we described any methods used to address clustering, matching or other design features.
12-step interventions may be delivered in groupsor individually, and often take place with some sessions delivered individually, and some delivered as group sessions. For example, Maude-Griffin et al. (1998) individually randomised participants to receive either CBT or 12-step facilitation delivered as three group therapy sessions and one individual counselling session each week for 12 weeks.
A study design where participants are individually randomised to treatment, but that treatment is delivered in a group setting, are known as individually randomised group treatment (IRGT) trials (Pals et al., 2008). The analysis in such a study design must correct for the fact that dependencies may arise between individuals that happen to receive the intervention in the same group. The analogy is the cluster randomised trial where clusters of participants are randomised to treatment. The analysis of cluster randomised trials must correct standard errors for the dependencies among individual participants in clusters. The correction involves knowledge of the intra-cluster correlation coefficient (ICC) and the (mean) group size. With this in hand, the estimated standard errors can be corrected with a design effect. Unfortunately none of studies report the ICC, and only 2 studies report group size. In the two studies that reported group size, Wells et al., 1994 delivered to groups with a mean size of 12, while Petry et al. (2010) reported a mean group size of 4 (for TSF intervention) and 4.5 (for the comparison condition). Pals et al. (2008) reviewed 34 IRGT trials in public health and noted that reporting of ICCs were very rare. The data that are available produced ICC estimates ranging between 0.04 and 0.44 depending on participants, interventions, and outcomes.
Since we had no relevant information on either ICC or group size, we decided that we could not reliably correct estimates for this unit of analysis error. Instead, studies that employed an IRGT design and did not correct the analysis for this design choice were scored on the “Other Bias” item. We then carried out a sensitivity analysis on this item.
3.5 DATA SYNTHESIS
Studies that scored 5 on a risk of bias item were excluded from the meta-analysis.
3.5.1 Effect size synthesis
Separate meta-analyses were carried out by outcome, and by time point (see section 3.2.7). In addition, analyses were organised based upon whether the comparison was 12-step versus other psychosocial intervention, or 12-step + add-on vs other psychosocial intervention + add-on. Only one included study (Bisset, 2002) contributed data to the comparison of 12-step vs no intervention. Accordingly meta-analysis could not be performed. We report the study level effect size for this comparison.
We retained only one effect size measure per comparison for each outcome construct for meta-analysis. When a study contributed dependent effect sizes, these were synthesised in separate meta-analyses. For example, as mentioned in section 3.4.3.5, the study by Carroll et al. (1998) contributed two relevant effect sizes: TSF versus CBT and TSF versus CM; these were synthesised in separate meta-analyses.
All analyses were carried out using inverse variance weighted random effects statistical models that incorporated both the sampling variance and between-study variance components into study level weights. We decided to use a random effects model to represent the overall effect as we expected included studies to deal with diverse populations of participants and intervention types.
Results of meta-analyses were presented by outcome and time of measurement. For each analysis we reported the number of studies, the average effect size with 95% confidence intervals, and where appropriate measures of heterogeneity, and in the case of I2 with an uncertainty interval (see section 3.5.2).
3.5.2 Assessment of heterogeneity
Heterogeneity was assessed through the use of the χ2-test. A p-value smaller than 0.1 was taken as indication of significant heterogeneity of treatment effects (protocol, sec. 3.3.7). Since the test has low power to detect differences in typical meta-analysis context (few studies) p is sometimes set to 0.1(Higgins, & Green, 2008, sec. 9.5.2) rather than the standard 0.05. The test statistic was used to represent the degree of variability in the treatment effect estimates due to heterogeneity:
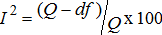
where Q is the χ2 test-statistic and df is its degrees of freedom (Higgins & Green, 2008). The value of I2 lies between 0% and 100%, with a value of 0% indicating no observed heterogeneity and larger values show increasing heterogeneity (Higgins, Thompson, Deeks, & Altman, 2003). When there was a sufficient number of studies per meta-analysis we calculated and reported uncertainty intervals for I2 (Higgins & Thompson, 2002). We found a moderate degree of heterogeneity between studies in some of the meta-analyses, and investigated further when a threshold of 75% was exceeded. In addition we reported the between-studies variance component (τ2).
3.5.3 Assessment of publication bias
Publication bias may occur because studies that report statistically significant treatment results are more likely to be published. We used two strategies to assess whether publication bias was present. First, our search strategy was designed to uncover any unpublished studies that met inclusion criteria, by searching dissertation databases and grey literature. Second, we examined funnel plots for asymmetry. The funnel plot is constructed by plotting a study's effect size against the standard error of the estimate. In the absence of publication bias one would expect a symmetric graph where the variation in effect size estimates increase with the standard error of the estimate. Although an asymmetric funnel plot does not necessarily imply that publication bias is present, it is an indication that the published research literature may suffer from this type of bias.
3.5.4 Handling of missing data
Not all studies reported sufficient details to allow the calculation of an effect size. When a study reported insufficient data for the calculation of a numeric effect size, we contacted the study authors requesting data. In some cases this allowed us to extract the information needed, but in the majority of cases our attempt to contact authors was unsuccessful 5 . For example, McKay et al. (1999) reported means and standard deviations for drug use but did not report sample size by treatment assignment; only the overall follow-up rate. In this and similar cases we assumed that follow-up attrition was independent of treatment assignment, allowing us to impute the missing data 6 . In addition, as detailed in section 3.4.3.3, when summary statistics were not available, effects sizes were extracted from figures and graphs where possible.
3.5.5 Sensitivity analysis
Sensitivity analysis was carried out with respect to risk of bias items. Meta-analysis was performed excluding studies where the ‘sequence generation’ item was scored either as High or Unclear, where the ‘incomplete data’ item was scored at 4, and where the ‘other bias’ item was scored at 4.
3.5.6 Software used for synthesis
We used Version 5.3 of Review Manager (2014) and Version 13 of Stata (StataCorp, 2013) for data synthesis.
4 Results
4.1 RESULTS OF THE SEARCH
We ran the searches in January 2010, October 2011, July 2013, and August 2015, and September 2016.
We searched 15 international and Nordic bibliographic databases, searched for grey literature and hand searched five core journals in September 2016 (see section 3.3 for more information).
The total number of potentially relevant records was 21,974 after excluding duplicates (database search:17,416; grey literature search: 2,639;hand search and others: 1919).
All 21,974 records were screened based on title and abstract. 428 of these records were retrieved and screened in full text. Thirty-six of the full texts were initially deemed to meet inclusion criteria. Upon closer inspection 23 full texts did not meet inclusion criteria. The primary reason for exclusion of these full texts is listed in section 9.3.
Thirteen reports met the inclusion criteria and data were extracted from these reports.
A total of 10 unique studies, reported in 13 reports, were included in the review. See ‘Flow of studies’ figure in section 10.2. See section 4.2 for further details on included studies. References to included reports can be found in section 7.1.
4.2 DESCRIPTION OF INCLUDED STUDIES
4.2.1 Study designs
Seven of the included studies were randomised controlled trials (Bisset, 2002; Carroll, Nich, Ball, McCance,& Rounsavile; 1998 Carroll, Nich, Shi, Eagan, & Ball, 2012; Maude-Griffin, Hohenstein, Humfleet, Reilly, Tusel,& Hall, 1998; McKay, Alterman, Cacciola, Rutherford, O'Brien, &Koppenhaver, 1997; Petry, Weinstock, Alessi, Lewis,& Dieckhaus, 2010; Schottenfeld, Moore,& Pantalon, 2011). Two studies had quasi-random allocation of participants to treatment (Higgins, Delaney, Budney,& Bickel, 1991; Wells, Peterson, Gainey, Hawkins,& Catalano, 1994). Onequasi-experimental study was included (Gossop, Stewart,& Marsden, 2007).
4.2.2 Location of the studies
All but one of the ten included studies were conducted in the US (Bisset, 2002; Carroll et al.,1998; Carroll et al., 2012; Higgins et al., 1991; Maude-Griffin et al., 1998; McKay et al., 1997; Petry et al.,2010; Schottenfeld et al., 2011; Wells et al., 1994). Gossop et al.(2007) was conducted in the United Kingdom.
All studies were facilitated in outpatient settings.
4.2.3 Participants
As displayed in tables in section 9.2, the number of males and females were approximately equal in three studies (Bisset, 2002; Carroll et al., 2012; Petry et al., 2010). Five studies included a majority of male participants (Carroll et al., 1998; Gossop et al., 2007; Higgins et al., 1991; Maude griffin et al., 1998; Wells et al., 1994). One study included only men (McKay et al., 1997), and another involved only women due to the inclusion criteria of the study thatrequiredparticipants to be female and either pregnant or have custody of a young child (Schottenfeld et al., 2011).
The mean age of the participants varied between 29 and 43 years.
The ten included studies reported the participants’ socioeconomic group in five different ways. In two studies, 81% and 62.7% had 12 or more years of education (Bisset, 2002; Higgins et al., 1991). Two studies reported a mean of around 12 years of education (McKay et al., 1997; Petry et al., 2010). Carroll et al.(1998) reported that 23% of participants had some college education, 47% had finished their high school education and 17% had not completed high school. A similar classification was used in Carroll et al.(2012), where the percentages were 34%, 43% and 17%. In two studies, 84% and 95% were either unemployed or did not have a fulltime job (Maude-Griffin et al., 1998; Schottenfeld et al., 2011). In Schottenfeld et al. (2011) it was also reported that 57 % of the participants had at least finished high school or its equivalent. In one study, 68% of the participants had had a full time job the previous 3 years and more than half had worked at least 20 days in the past month (Wells et al., 1994).
Eight studies (Bisset, 2002; Carroll et al., 1998; Carroll et al., 2012; Higgins et al., 1991; Maude-Griffin et al., 1998; McKay et al., 1997; Petry et al., 2010; Schottenfeld et al., 2011) reported participants’ mental health conditions either before or when entering treatment. Five studies reported that minimum a third of the participants had some kind of mental disorder (Bisset, 2002; Carroll et al., 1998; Carroll et al., 2012; Maude-Griffin et al., 1998; McKay et al., 1997), including depression, personality disorder, and antisocial personality disorder. One study reported that 24% of the participants met the criteria for current major depression disorder (Schottenfeld et al., 2011). Two studies reported psychiatric problem severity using the Addiction Severity Index Composite Score (ASI) (Higgins et al., 1991; Petry et al., 2010). Two studies did not report the mental health status of participants (Gossop et al., 2007; Wells et al., 1994).
Participants in the included studies had overall a long history of drug use, ranging from 5 to 19 years of drug addiction (Carroll et al., 1998; Gossop et al., 2007; Higgins et al., 1991; McKay et al., 1997; Wells et al., 1994). A number of studies reported drug use among the majority of the participants within the last 30 days before entering the trial (Bisset, 2002; Carroll et al., 2012; Gossop et al., 2007; Schottenfeld et al., 2011; Wells et al., 1994).
In five studies the participants were predominantly white Caucasian (Bisset, 2002; Carroll et al., 2012; Gossop et al., 2007; Higgins et al., 1991; Wells et al., 1994), in three studies most participants were African American, and two studies reported a combination of ethnic groups (Carroll et al., 1998; Maude-Griffin et al., 1998; McKay et al., 1997; Petry et al., 2010; Schottenfeld et al., 2011).
4.2.4 Interventions
12-step therapy was delivered in a variety of ways across the studies. In four studies, ordinary TSF was delivered (Carroll et al., 1998; Carroll et al., 2012; Maude Griffin et al., 1998; Schottenfeld et al., 2011). The content of the TSF is intended to be consistent with the 12 Steps, but with an importance of steps 1-5 and a disease model of addiction added to the original program. In Bisset (2002), the therapy was delivered as Intensive Twelve Step Facilitation (ITSF). ITSF differs from the ordinary Twelve Step Facilitation (TSF) by offering the participants 48 sessions rather than the 12 session in TSF. 12-step drug counselling was delivered in one study (Higgins et al., 1991). Two studies delivered the therapy as a mix of addiction counselling and 12-step recovery practices (McKay et al., 1997; Petry et al., 2010). In one of these studies, the therapy was delivered as an aftercare program (McKay et al., 1997). In one study the 12-step program was delivered as a self-help group attendance (Gossop et al., 2007).
The duration of the interventions varied between 12 weeks and 6 months. Treatment sessions took place once or twice weekly in all studies.
4.2.5 Control conditions
The control conditions in the included studies was categorised as follows:12-step therapy was compared to the treatment as usual, another psychosocial intervention or an intervention where 12-step with an add-on was compared to another intervention with an add-on.
In Bisset (2002) participants in one of the two comparison conditions received only methadone and no psychosocial therapy. In one study, one comparison condition was defined as being participants who did not attend any 12-step self-help group meetings (Gossop et al., 2007). The second comparison group in this study consisted of participants who attended self-help sessions less than once a week.
In six of the included studies the comparison conditions were psychosocial interventions without any supplement (Bisset, 2002; Higgins et al., 1991; Maude-Griffin et al., 1998; McKay et al., 1997; Petry et al., 2010; Wells et al., 1994). In one study the comparison condition was Behavioural Therapy (Higgins et al., 1991). Two studies delivered Cognitive Behavioural Therapy to the comparison group (Maude-Griffin et al., 1998; Wells et al., 1994). Acceptance and Commitment Therapy, Contingency Management, and Relapse Prevention interventions were delivered to the comparison group in Bisset (2002), Petry et al. (2010) and McKay et al.(1997), respectively.
In Carroll et al. (1998) participants were divided into five groups. Two groups received CBT and 12-step without add-ons. The remaining three groups all received disulfiram in addition to their weekly therapy sessions in 12-step, Cognitive Behavioural Therapy and Clinical management. In Carroll et al.(2012) one comparison condition received disulfiram and no psychosocial therapy and the second comparison condition received 12-step and disulfiram. Community reinforcement was delivered to the comparison group, and as add-on the study included contingency and non-contingent yoked voucher control (Schottenfeld et al., 2011).
4.2.6 Treatment fidelity
Therapists with masters or doctoral level training in psychology or with an equivalent degree delivered the treatments in the included studies. One study did not report who delivered the treatment (Gossop et al., 2007).
Seven studies utilised supervision to assess the fidelity of treatment (Bisset, 2002; Carroll et al., 1998; Maude griffin et al., 1998; McKay et al., 1997; Petry et al., 2010; Schottenfeld et al., 2011; Wells et al., 1994).
4.2.7 Measurement of outcomes
An overview of outcomes and how they were measured in each included study can be found in section 11.1.
4.2.7.1 Drug use
The primary outcome for this review was abstinence or reduction in drug use measured by biochemical tests, estimates of drug use, and/or psychometric scales. Eight studies used biochemical tests to verify abstinence (Bisset, 2002; Carroll et al., 2012; Higgins et al., 1991; Maude-Griffin et al., 1998; McKay et al., 1997; Petry et al., 2010; Schottenfeld et al., 2011; Wells et al., 1994).
Six studies used other means of assessing drug use, typically self-report (Carroll et al., 2012; Carroll et al., 1998; Gossop et al., 2007; Maude-Griffin et al.,1998; McKay et al., 1997; Schottenfeld et al., 2011). In addition, in three studies the ASI-drug subscale was administered (Bisset, 2002; McKay et al., 1997; Schottenfeld et al., 2011).
Continuous outcomes were measured in seven studies (Carroll et al., 1998; Carroll et al., 2012; Gossop et al., 2007; McKay et al., 1997; Petry et al., 2010; Schottenfeld et al., 2011; Wells et al., 1994), whereas dichotomous outcomes were measured in six of the studies (Bisset, 2002; Carroll et al., 1998; Higgins et al., 1991; Maude-Griffin et al., 1998; McKay et al., 1997; Schottenfeld et al., 2011).
4.2.7.2 Secondary outcomes
Two studies measured outcomes in the criminal behaviour domain with the ASI-legal subscale (Bisset, 2002; Carroll et al., 1998). The ASI-legal interview also covers issues related to prostitution.
Three studies used the ASI to assess psychiatric symptoms, social functioning and employment status of the participants (Bisset, 2002; Carroll et al., 1998; McKay et al., 1997). Bisset (2002) also utilised The Beck Depression Index, and the Symptom Checklist-90-R questionnaires to assess psychological problems and symptoms of psychopathology.
None of the studies measured or reported outcomes related to homelessness.
4.2.8 Time points
Table 1 provides an overview of when measurements were taken in the included studies. The majority of studies took outcome measurements at one or more time points during treatment, except Gossop et al. (2007), Higgins et al. (1991), Petry et al. (2010), and Wells et al. (1994). All studies except Gossop et al. (2007) took outcome measurements at the end of treatment. All studies except Higgins et al. (1991) also took outcome measurements at one or more follow-up points.
Time points in included studies
4.3 RISK OF BIAS IN INCLUDED STUDIES
All included studies were assessed for risk of bias. Each study was rated independently by two reviewers in the following 6 domains. Selection bias Adequate sequence generation Allocation concealment Blinding Incomplete outcome data addressed Free of selective reporting Free of other bias
Some items such as sequence generation were rated on a High risk/Low risk/Unclear risk scale. Other items such as incomplete outcome data were assessed on a scale from 1 to 5, where a score of 5 indicates an unacceptable high risk of bias. Risks of bias tables for each study are presented in section 9.4.1. In all included studies the outcomes were organised into primary outcomes, secondary outcomes and retention within the domains blinding, incomplete outcome data addressed and free of selective reporting. Outcomes within a study receiveda separate rating if the risk of bias differed between them.
As displayed in Figure 2, four of the included studies received a low risk of bias score for Adequate sequence generation. The remaining six studies were either classified as high risk (3) or as unclear risk (3) for sequence generation. Randomisation was performed via a computerised urn-algorithm in studies that were classified with low risk in the adequate sequence generation item. For allocation concealment, three studies were rated as low risk of bias, whereas the remaining studies were rated with either high risk (3) or unclear risk (4). The assessment within these two domains indicates that several of the studies are at high risk of some form of selection bias.
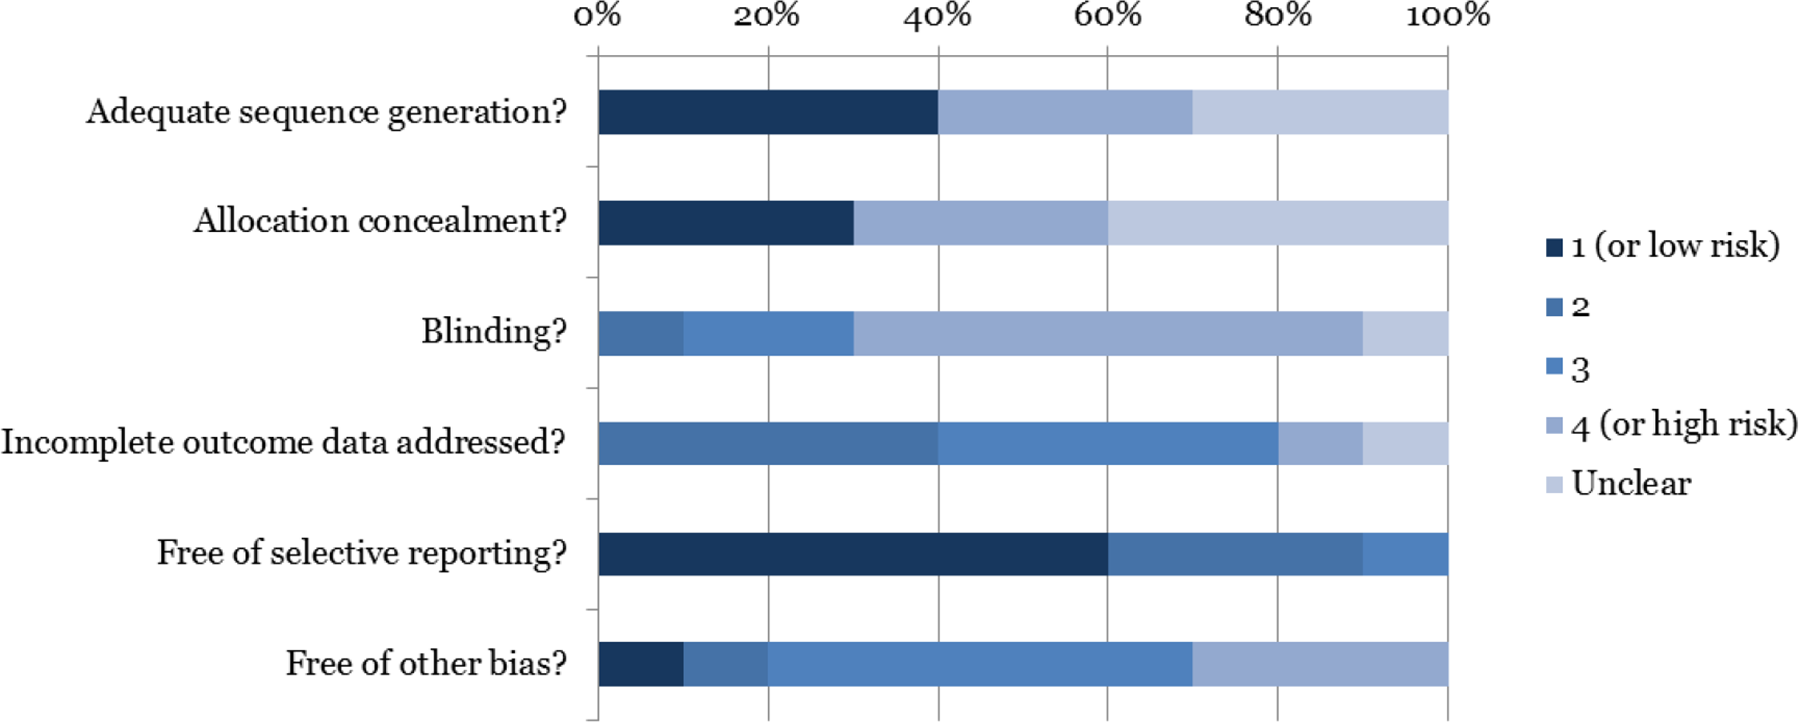
Risk of Bias summary for drug use
For blinding, none of the included studies received a low risk rating. Six studies were considered as high risk of bias, mainly because of the natural difficulties in blinding therapists and participants.
Eight studies received a medium risk of bias classification (score of 2 or 3) in the incomplete outcome data addressed domain. For the domain free of selective reporting 6 studies were classified with low risk of bias. The remaining studies were classified with some risk of bias in this domain. One study was judged to be free of other forms of bias. Eight studies were given a score of 3 or 4. This was due the lack of correction of the statistical analysis for the group therapy element of the intervention.
The study by Gossop, Stewart, & Marsden (2007) was excluded from meta-analysis following risk of bias assessment. Gossop et al. (2007) used a quasi-experimental design, and accordingly the study was in addition assessed on the confounding item of the risk of bias tool. The study was judged at high risk of bias on the confounding item, leading to its exclusion from quantitative synthesis. Further details on the risk of bias assessment can be found in section 9.5.
4.3.1 Example of risk of bias assessment
Here we present an example of the risk of bias assessment that we conducted for the Higgins et al. (1991) study. Non-random sequence generation was used to assign participants to treatment; 13 participants were allocated to Behavioural therapy and the next 15 participants were allocated to the 12-step group. Because of this allocation, the study was rated with high risk for adequate sequence generation. There was no information in the report regarding allocation concealment. Because the decision to allocate exactly 13 participants to behavioural therapy was not pre-specified, it is likely that this decision was not concealed to study investigators. The study was scored with a high risk rating in allocation concealment.
Neither participants, therapists, nor assessors were blind to treatment allocation, something which is difficult to achieve with these interventions. Because the Behavioural Therapy intervention includes an incentive pay mechanism it is unlikely that staff was blind to the allocation.
For incomplete outcome data/attrition bias, the study was rated with high risk for the primary outcome and with low risk for the outcome of treatment retention. The reason for judging primary outcome at high risk, is due to the rather large, and differential attrition between treatments.
For selective reporting/reporting bias, the study was received a score of 2, indicating a small risk of bias. The reason for the judgement 2 was that reporting on the missing outcome data item was not adequate.
The 12-step intervention was delivered in groups. The statistical analysis in the report did not correct for this design feature. This is assessed in the other risk of bias domain.
4.4 EFFECTS OF INTERVENTION
Effect sizes for each study are reported in the online appendix (see section 12) and forest plots for all meta-analyses are reported in Section 11.4.
Prior to calculating effect sizes, outcome measures were recoded such that a higher score was indicative of an improvement in the relevant domain. For example, the ASI is measuredon a scale from 0 to 1 where a higher score indicates higher degree of severity. This measure was therefore recoded. Subsequently, effect sizes were constructed such that a positive effect size favoured the 12-step intervention rather than the comparison/control.
Studies used several different scales to measure the same outcome construct. For example, Bisset (2002) measured the primary outcome “drug use” with a urine analysis screen and “relevant portions of ASI” (Hayes et al., 2004, p673). McKay et al. (1999) used the Timeline Follow Back to construct a measure of percentage of days using cocaine. All effect sizes for drug use were expressed in or transformed to the SMD- family of effect sizes (standardised mean difference). When studies reported multiple effect sizes for drug use, we chose the effect size that relied on a continuous outcome measure.
Treatment retention was also measured in a variety of ways. Some studies measured retention as number of completed sessions (e.g. McKay et al., 1997), others measured retention as treatment completion (e.g. Carroll et al., 1998). Since the majority of studies reported dichotomous outcomes, effect sizes were expressed in or converted to the odds ratio. Studies only contributed one effect size on this outcome construct.
The remaining secondary outcomes were all measured with the relevant subcomponent of the ASI (Addiction Severity Index). Since the ASI is a continuous measure, effect sizes were expressed in the SMD- family of effect sizes. None of the studies contributed multiple effect sizes on these outcome constructs.
A complete list of outcome measures is available in the appendix (section 11.1)
Below we report the results of effect size synthesis. Meta-analysis was conducted separately for two comparisons: 12-step vs. other psychosocial treatment, and 12-step with an add-on (either pharmaceutical add-on such as disulfiram, or another psychosocial add-on such as contingency management) vs other psychosocial treatment with an identical add-on. Only one study (Bisset, 2002) contributed data to the comparison 12 step vs. no intervention at post treatment and at follow-up. Meta-analysis was therefore not performed, but we report the effect sizes for this study for completeness.
When studies contributed to more than one relevant comparison, these were analysed in separate meta-analyses. Separate meta-analyses were also conducted for each of the outcomes relevant to the review. Finallymeta-analysis was conducted separately by time: during intervention, post intervention, and follow-up. The time point division differed from that specified in the protocol. In our protocol we stated that we expected that the included studies would contain interventions of a self-help nature and we anticipated synthesising outcomes in the short-term (less than 6 months after enrolment into treatment), medium-term (6-12 months after enrolment), and long-term (12 months or more after enrolment). However, all studies included in our synthesis were either randomised or quasi-randomised trials. Since most studies reported on the primary outcome during the intervention and at post-intervention, we found it appropriate to follow the research literature in choosing appropriate time intervals 7 .
In several studies all or part of the intervention was implemented as group therapy. None corrected for the correlation inherent in these interventions between participants (randomly) assigned to the same group. Since we lacked both plausible information on intra-cluster correlation and on (average) group size, we decided that we could not reliably correct effect sizes; instead the risk of bias assessment for these studies reflected the risk of bias present in the effect estimates for this group of studies.
4.4.1 Comparison: 12-step vs no intervention
4.4.1.1 Primary outcome: drug use
4.4.1.1.1 During treatment
No studies contributed effect sizes for drug use to the comparison of 12-step versus no intervention during treatment.
4.4.1.1.2 Post treatment
One study (Bisset, 2002) contributed effect sizes to the comparison of 12-step versus no intervention at post-treatment. Meta-analysis was therefore not possible. The effect size from Bisset (2002) for drug use is presented in Table 2 below.
Effect size (SMD) for 12-step vs no intervention, outcome: drug use measured post treatment
Notes: Positive effect size favours 12-step intervention. Effect size for retention: odds ratio.
* p <.05,
** p < .01
4.4.1.1.3 Follow-up
Only one study contributed a comparison of 12-step versus no intervention (Bisset, 2002), at follow-up, therefore no meta-analysis was possible. Table 3 presents the study level effect size for drug use.
Effect size (Hedges’ g) for 12-step vs no intervention, outcome: drug use at follow-up (6 months)
Notes. Positive effect size favours 12-step intervention.
p <.05, ** p < .01
4.4.1.2 Secondary outcomes
4.4.1.2.1 During treatment
No secondary outcomes were available during treatment for the comparison between 12-step and no intervention.
4.4.1.2.2 Post treatment
Only one study contributed a comparison of 12-step versus no intervention (Bisset, 2002), therefore no meta-analysis was possible. Table 4 presents the study level effect size for the secondary outcomes: retention, criminal behaviour, psychiatric symptoms, social functioning and employment, measured post treatment.
Effect sizes (Hedges’ g) for 12-step vs no intervention, secondary outcomes measured post treatment
Notes: Positive effect size favours 12-step intervention. Effect size for retention: odds ratio.
* p <.05, ** p < .01
4.4.1.2.3 Follow-up
Only one study contributed a comparison of 12-step versus no intervention (Bisset, 2002), therefore meta-analysis was not possible. Table 5 presents the study level effect size for the secondary outcomes: retention, criminal behaviour, psychiatric symptoms, social functioning and employment, measured at 6-months follow-up
Effect sizes (Hedges’ g) for 12-step vs no intervention, secondary outcomes at follow-up (6 months)
Notes. Positive effect size favours 12-step intervention.
* p <.05, ** p < .01
4.4.2 Comparison: 12-step vs other psychosocial interventions
4.4.2.1 Primary outcome: drug use
4.4.2.1.1 During treatment
Five of the seven studies included compared 12-step to a psychosocial intervention contained sufficient information for us to construct an effect size for drug use during treatment (Carroll et al., 1998; Higgins et al., 1991; Maude-Griffin et al., 1998; McKay et al., 1997; Petry et al., 2010). Bisset (2002) and Wells et al. (1994) did not report measures of drug use during treatment.
Table 6 displays the results ofmeta-analysis for the comparison of 12-step versus other psychosocial intervention for drug use. See Figure 11.4.1.1.1 in Appendix 11.4 for the forest plot. Outcomes were measured during treatment.
Meta-analysis, 12-step vs psychosocial intervention, drug use measuredduring treatment
Notes: Positive effect size favours 12-step intervention. Effect size measure is Hedges’ g. * p <.05, ** p < .01 indicates statistical significance of effect size. Uncertainty intervals reported for I2 where applicable (Higgins & Thompson 2002).
Effect sizes varied between -1.42 (Higgins et al., 1991) and 0.33 (Carroll et al., 1998). All studies except Carroll et al. (1998) included a group element in the intervention, and the estimated standard errors of the effect sizes are therefore likely biased. In the meta-analysis of five studies (Table 6), there was no statistically significant difference between 12-step and another psychosocial intervention during treatment for the outcome of drug use (Hedges’ g = -0.29; 95% CI -0.62 to 0.05). This indicates that 12-step treatment is neither worse nor better than the other psychosocial interventions in reducing drug use. Outcome data were available for 482 out of 502 assigned participants (96%). The I2 statistic (57%) indicated that there was a moderate degree of heterogeneity present.
4.4.2.1.2 Post treatment
Five of the seven studies that considered the comparison between 12-step and other psychosocial interventions contributed data to the meta-analysis for the outcome of drug use measured post treatment (Bisset, 2002; Carroll et al., 1998; Maude-Griffin et al., 1998; McKay et al., 1997; Wells et al., 1994). Higgins et al. (1991) and Petry et al. (2010) did not measure drug use post treatment.
Table 7 presents results from meta-analysis of the comparison of 12-step intervention versus psychosocial intervention, for drug use, measured post treatment. See Figure 11.4.1.1.2 in Appendix 11.4 for the forest plot.
Meta-analysis, 12-step vs psychosocial intervention, drug use measurepost treatment
Notes. Positive effect size favours 12-step intervention.
* p <.05, ** p < .01 indicates statistical significance of effect size. Effect size measure is Hedges’ g. Uncertainty intervals reported for I2 where applicable (Higgins & Thompson 2002).
Effect sizes ranged between -0.28 (Maude-Griffin et al., 1998) to 0.25 (Wells et al., 1994). In the meta-analysis of 5 studies (Table 7), there was no statistically significant difference between 12-step and another psychosocial intervention post treatment for the outcome of drug use (Hedges’ g = -0.03; 95% CI -0.24 to 0.18). Four of the studies involved group based interventions and data were not corrected for clustering. Data completion rate was 82% on average that is outcome data were available for 82% of participants assigned to treatment. There was no indication of heterogeneity between studies on drug use, but note that the uncertainty interval for I2 is wide.
4.4.2.1.3 Follow-up
Table 8 presents the results of meta-analyses for the comparison of 12-step treatment versus other psychosocial treatment. Six studies contributed data (Bisset, 2002; Carroll et al., 1998; Maude-Griffin et al., 1998; McKay et al., 1997; Petry et al., 2010; Wells et al., 1994). Outcomes measured 6 months post treatment and 12 months post treatment were synthesised in meta-analysis. Some studies provided follow-up measures at additional time points. For example McKay et al. (1999) provide measures at 18 months follow-up. However 6 and 12 months follow-up times were the time points covered by the most studies, and were chosen for meta-analysis. See Figure 11.4.1.1.3 in Appendix 11.4 for the forest plot. All effect sizes are available in our Online Supplement 1.
Meta-analysis, 12-step vs psychosocial intervention, drug use at follow-up
Notes: * p <.05, ** p < .01 indicates statistical significance of effect size. Uncertainty intervals reported for I2 where applicable (Higgins & Thompson 2002). Effect size measure is Hedges’ g. Positive effect size favours 12-step intervention.
Six studies contributed data to the meta-analysis for drug use at 6 months post treatment (Bisset, 2002; Carroll et al., 1998; Maude-Griffin et al., 1998; McKay et al., 1997; Petry et al., 2010; Wells et al., 1994). Individual effect sizes ranged between -0.29 (Maude-Griffin et al., 1998) and 0.05 (Carroll et al., 1998). In the meta-analysis of 6 studies (Table 8), there was no statistically significant difference between 12-step and another psychosocial intervention at 6 months follow-up for the outcome of drug use (Hedges’ g = -0.12; 95% CI -0.31 to 0.08). The average follow-up rate was 79%. In one study (Carroll et al., 1998) treatment was delivered individually. In the remaining studies, treatment was either group therapy alone or a combination of individual and group therapy. Since failing to correct for clustering typically leads to a downward bias in estimated standard errors of the study level effect sizes (leading to too high weights in meta-analysis) the conclusion that there is no statistical difference between 12-step and other psychosocial treatments for the outcome of drug use at 6 months follow-up is likely to be robust to this bias. There was no indication of heterogeneity (I2 = 0%).
Two studies contributed data to the meta-analysis for the outcome drug use 12 months after treatment end (Carroll et al., 1998; McKay et al., 1997). Study level effect sizes ranged between -0.08 (McKay et al., 1997) and 0.30 (Carroll et al., 1998). In the meta-analysis of these 2 studies (Table 8), there was no statistically significant difference between 12-step and another psychosocial intervention at 12 months follow-up for the outcome of drug use (Hedges’ g = -0.02; 95% CI -0.35 to 0.30). The average follow-up rate at 12 months after treatment end was 83%.
4.4.2.2 Secondary outcomes
4.4.2.2.1 During treatment
No studies contributed data for secondary outcomes during treatment.
4.4.2.2.2 Post treatment
Table 9 presents results from the meta-analysis of 12-step vs psychosocial interventions for secondary outcomes measured post treatment. Forest plots for all secondary outcomes can be found in 11.4.1.2 in the Appendix.
Meta-analysis, 12-step vs psychosocial intervention, secondary outcomes measuredpost treatment
Notes. ¤ Effect size: odds ratio; Positive effect size favours 12-step intervention (effect size > 1 for retention).
* p <.05, ** p < .01 indicates statistical significance of effect size. Uncertainty intervals reported for I2 where applicable (Higgins & Thompson 2002). Effect size measure is Hedges’ g.
Two studies contributed data on criminal behaviour (Bisset, 2002; Carroll et al., 1998). Study level effect size estimates were between -0.33 and -0.28. In the meta-analysis of these 2 studies (Table 9), there was no statistically significant difference between 12-step and another psychosocial intervention post-treatment for the outcome of criminal behaviour (Hedges’ g = -0.31; 95% CI -0.76 to 0.13). The I2 statistic indicated a low degree of heterogeneity (0%). An uncertainty interval for I2 could not be computed due to the small number of studies.
Three studies (Bisset, 2002; Carroll et al., 1998; McKay et al., 1997) contributed data on psychiatric symptoms, employment and social functioning. The data completion rate for these three outcomes was 81%. Two of the studies used individual randomisation to group therapy.
Effect size estimates for psychiatric symptoms ranged between -0.13 and 0.20. In the meta-analysis of 3 studies (Table 9), there was no statistically significant difference between 12-step and another psychological intervention post-treatment for the outcome of psychiatric symptoms (Hedges’ g = 0.08; 95% CI -0.19 to 0.35). The I2 statistic indicated a low degree of heterogeneity (0%), but note that the uncertainty interval for I2 is wide.
Study level effect sizes for social functioning ranged between -0.2 and 0.22. In the meta-analysis of 3 studies (Table 9), there was no statistically significant difference between 12-step and another psychosocial intervention post-treatment for the outcome of social functioning (Hedges’ g = -0.15; 95% CI -0.42 to 0.12). The I2 statistic indicated a low degree of heterogeneity (0%), but note that the uncertainty interval for I2 is wide.
Employment effect size estimates ranged between -0.03 and 0.32. In the meta-analysis of 3 studies (Table 9), there was no statistically significant difference between 12-step and another psychosocial intervention post-treatment for the outcome of employment (Hedges’ g = 0.03; 95% CI -0.24 to 0.3). The I2 statistic indicated a low degree of heterogeneity (0%), but note that the uncertainty interval for I2 is wide.
Six studies (Bisset, 2002; Carroll et al., 1998; Higgins et al., 1991; McKay et al., 1997; Petry et al., 2010; Wells et al., 1994) contributed data to the meta-analysis for the outcome treatment retention. Since most studies reported retention as a binary variable, the odds ratio effect size was used for synthesis. The data completion rates were above 99%. Five out of the six studies involved group based treatments. The summary effect size was statistically significant at the 5% level (OR = 0.75; 95% CI0.56 to 1.00). 12-step interventions thus appear to do worse at retaining participants in treatment than the other psychosocial interventions. Five of the studies did not correct for the fact that outcome analysis was conducted at the individual level, but allocation involved individual randomisation to group therapy. As such there is a risk that the estimated standard error of the effect size is too small. Therefore the conclusion that 12-step interventions appear worse at retaining participants in treatment than other psychosocial interventions should be drawn cautiously. The I2 statistic indicated a low degree of heterogeneity between studies (I2 = 1%), but note that the uncertainty interval for I2 is wide.
4.4.2.2.3 Follow-up
For the secondary outcomes (psychiatric symptoms, employment, social functioning) a total of three studies contributed data at 6 months follow-up (Bisset 2002; Carroll et al., 1998; McKay et al., 1997); only two of the three (Carroll et al., 1997; McKay et al. 1997) contributed data at 12 months follow-up. Average follow-up rate was 73% at 6 months follow-up, and 80% at 12 months follow-up. Carroll et al. (1998) and Bisset (2002) contributed data for the outcome of criminal behaviour at 6 months follow-up (55% follow-up rate). Only Carroll et al. (1998) provided follow-up data for this outcome measure at 12 months follow-up. Accordingly meta-analysis was not possible for this time point but we have reported the study level effect size inTable 10. Forest plots for secondary outcomes at follow-up can be found 11.4.1.2.2 in the Appendix.
Meta-analysis, 12-step vs psychosocial intervention, secondary outcomes at follow-up
Notes: * p <.05, ** p < .01 indicates statistical significance of effect size. Uncertainty intervals reported for I2 where applicable (Higgins & Thompson 2002). Positive effect size favours 12-step intervention. Effect size measure is Hedges’ g.
For all outcomes and time points the estimated summary effect sizes were not statistically significant (range: -0.18 to 0.02). Between study heterogeneity ranged from low to moderate (I2 between 0% and 35%).
4.4.3 Comparison: 12-step with add-on vs other psychosocial interventions with add-on
4.4.3.1 Primary outcome: drug use
4.4.3.1.1 During treatment
Table 11 presentsmeta-analytical results for the comparison of 12-step intervention with an add-on treatment (either pharmaceutical or psychosocial) against a psychosocial intervention with the same add-on for drug use. Outcome measurements were taken during treatment. Three studies contributed effect sizes to the meta-analysis (Carroll et al., 1998; Carroll et al., 2012; Schottenfeld et al., 2011). The comparison in Carroll et al. (1998) was between 12-step and either cognitive behavioural therapy (CBT) or clinical management (ClM). Disulfiram (Dis) was used as an add-on. In Carroll et al. (2012) the comparison was between 12-step and clinical treatment-as-usual (TAU). Either disulfiram (Dis) or placebo (Pla) was used as an add-on, which gave rise to two relevant comparisons: 12+Dis v TAU+Dis and 12+Pla v TAU+Pla. Schottenfeld et al. (2011) examined the comparison between 12-step and community reinforcement approach (CRA) interacted with either contingency management (CM) or voucher control (VC). Forest plots are presented in 11.4.2.1 in the Appendix.
Meta-analysis, 12-step with add-on vs psychosocial intervention with add-on, drug use measuredduring treatment
Notes. Main comparison: CBT = Cognitive Behavioural Therapy, CRA = Community Reinforcement Approach, TAU = Treatment as Usual (Standard Counseling), ClM =Clinical Management. Add-ons: Dis = Disulfiram, CM = Contingency Management, Pla = Placebo, VC = Voucher Control. Positive effect size favours 12-step intervention. Effect size measure is Hedges’ g.
* p <.05, ** p < .01 indicates statistical significance of effect size. Uncertainty intervals reported for I2 where applicable (Higgins & Thompson 2002).
Carroll 1998: 12+Dis v CBT+Dis, Schottenfeld 2011: 12+CM v CRA+CM, Carroll 2012: 12+Dis v TAU+Dis;
Carroll 1998: 12+Dis v CBT+Dis, Schottenfeld 2011: 12+CM v CRA+CM, Carroll 2012: 12+Pla v TAU+Pla;
Schottenfeld 2011: 12+VC v CRA+VC, Carroll 1998: 12+Dis v CBT+Dis, Carroll 2012: 12+Dis v TAU+Dis;
Schottenfeld 2011: 12+VC v CRA+VC, Carroll 1998: 12+Dis v CBT+Dis, Carroll 2012: 12+Pla v TAU+Pla;
Schottenfeld 2011: 12+CM v CRA+CM, Carroll 1998: 12+Dis v ClM+Dis, Carroll 2012: 12+Dis v TAU+Dis;
Schottenfeld 2011: 12+CM v CRA+CM, Carroll 1998: 12+Dis v ClM+Dis, Carroll 2012: 12+Pla v TAU+Pla;
Schottenfeld 2011: 12+VC v CRA+VC, Carroll 1998: 12+Dis v ClM+Dis, Carroll 2012: 12+Dis v TAU+Dis;
Schottenfeld 2011: 12+VC v CRA+VC, Carroll 1998: 12+Dis v ClM+Dis, Carroll 2012: 12+Pla v TAU+Pla.
Average effect sizes estimates ranged from 0.11 to 0.35. None of the summary effect size estimates for the outcome of drug use were statistically significant at the 5% level. Data completion rates varied between 82-86%. All of the studies were randomised trials where treatment was delivered individually. Across the different analyses, the degree of heterogeneity between studies (I2) varied from low to moderate (0-54%).
4.4.3.1.2 Post treatment
In Table 12 we report meta-analytical results for the comparison 12-step with an add-on versus other psychosocial treatment with an identical add-on for the primary outcome of drug use. Forest plots are presented in 11.4.2.1.2 in the Appendix.
Meta-analysis, 12-step with add-on vs psychosocial intervention with add-on, drug use measured post treatment
Notes. Main comparison: CBT = Cognitive Behavioural Therapy, CRA = Community Reinforcement Approach, TAU = Treatment as Usual (Standard Counseling), ClM =Clinical Management. Add-ons: Dis = Disulfiram, CM = Contingency Management, Pla = Placebo, VC = Voucher Control.
* p <.05, ** p < .01 indicates statistical significance of effect size. Effect size measure is Hedges’ g. Uncertainty intervals reported for I2 where applicable (Higgins & Thompson 2002).; Positive effect size (odds ratio above 1) favours 12-step intervention; ¤ odds ratio;
Carroll 1998: 12+Dis v CBT+Dis, Carroll 2012: 12+Dis v TAU+Dis;
Carroll 1998: 12+Dis v CBT+Dis, Carroll 2012: 12+Pla v TAU+Pla;
Carroll 1998: 12+Dis v ClM+Dis. Carroll 2012: 12+Dis v TAU+Dis;
Carroll 1998: 12+Dis v ClM+Dis, Carroll 2012: 12+Pla v TAU+Pla
Two studies contributed data to the meta-analysis on drug use (Carroll et al., 1998; Carroll et al., 2012). 12-step was compared to either cognitive behavioural therapy (CBT), clinical management (ClM) or treatment-as-usual (TAU). Disulfiram (Dis) and placebo (Pla) were add-ons. The main treatments were delivered individually. Individual effect sizes ranged between -0.32 (Carroll et., 1998; 12-step and disulfiram versus CBT and disulfiram) to 0.41 (Carroll et al., 2012; 12-step and disulfiram in addition to treatment-as-usual versus treatment-as-usual and disulfiram). None of the estimated summary effect sizes (range: -0.01 to 0.29) for drug use at post-treatment were statistically significant. Data completion rates were 86-87%. Heterogeneity was moderate (I2 ranging from 0 to 66%). An uncertainty interval could not be computed due to the low number of studies.
4.4.3.1.3 Follow-up
Table 13 below presents results from meta-analyses where 12-step with an add-on was compared against other psychosocial intervention with the same add-on for drug use. Only two studies (Carroll et al., 1998; Carroll et al., 2012) contributed to the meta-analysis at 6 and 12 months post treatment 8 . 12-step was compared to either cognitive behavioural therapy (CBT), clinical management (ClM), or treatment-as-usual (TAU). Disulfiram (Dis) and placebo (Pla) were add-ons. Forest plots are presented in 11.4.2.1.3 in the Appendix.
Meta-analysis, 12-step with add-on vs psychosocial intervention with add-on, drug use at follow-up
Notes: Main comparison: CBT = Cognitive Behavioural Therapy, TAU = Treatment as Usual (Standard Counseling), ClM =Clinical Management. Add-ons: Dis = Disulfiram, Pla = Placebo.; Positive effect size favours 12-step intervention;
* p <.05, ** p < .01 indicates statistical significance of effect size. Effect size measure is Hedges’ g.
Carroll 1998: 12+Dis v CBT+Dis, Carroll 2012: 12+Dis v TAU+Dis;
Carroll 1998: 12+Dis v CBT+Dis, Carroll 2012: 12+Pla v TAU+Pla;
Carroll 1998: 12+Dis v ClM+Dis, Carroll 2012: 12+Dis v TAU+Dis;
Carroll 1998: 12+Dis v ClM+Dis, Carroll 2012: 12+Pla v TAU+Pla.
Follow-up rates were between 76% and 83%. Two of the summary effect sizes for drug use at 6 months follow-up were statistically significant at the 5% level. Both summary effect sizes favoured the 12-step intervention. The estimated summary effect size for drug use at 6 months for 12-step versus TAU or Clinical Management with disulfiram add-on was statistically significant (Hedges’ g = 0.48; 95% CI 0.06 to 0.90). The meta-analysis was based on an analysis sample of 90 participants from 2 studies (Caroll et al., 1998; Caroll et al., 2012). The estimated summary effect size for drug use at 6 months for 12-step versus TAU (with placebo add-on) or Clinical Management (with disulfiram add-on) was statistically significant (Hedges’ g = 0.45; 95% CI 0.03 to 0.88). The meta-analysis was based on an analysis sample of 87 participants from 2 studies (Caroll et al., 1998; Caroll et al., 2012). The results of the remaining two analyses for drug use at 6 months follow-up were not statistically significant. These meta-analyses were based on 2 studies (Caroll et al., 1998; Caroll et al., 2012). In one analysis 87 participants contributed data where 12-step was compared to CBT and TAU (with disulfiram as add-on). In the other analysis, 84 participants contributed data to analysis where 12-step was compared to CBT (with disulfiram as add-on) and TAU (with placebo as add-on).
Analyses of the outcome of drugs use conducted 12 months after end of treatment did not reveal statistically significant differences between 12-step with an add-on treatment and the alternative intervention(s) with add-on treatment.
Conclusions must be drawn cautiously. Both studies contributing data were from the same team of investigators and dependencies between study level effect sizes may contribute to exaggerated p- values.
Across all the meta-analyses reported in Table 13, there was indication of a low to medium degree of study heterogeneity (I2 statistic ranged from 0% to 60%).
4.4.3.2 Secondary outcomes
4.4.3.2.1 During treatment
No studies contributed data on secondary outcomes during treatment.
4.4.3.2.2 Post treatment
Three studies (Carroll et al., 1998; Carroll et al., 2012; Schottenfeld et al., 2011) contributed data on treatment retention (Table 14). Forest plots are presented in 11.4.2.2.1 in the Appendix.
Meta-analysis, 12-step with add-on vs psychosocial intervention with add-on, treatment retention measured post treatment
Notes.¤ odds ratio; Main comparison: CBT = Cognitive Behavioural Therapy, CRA = Community Reinforcement Approach, TAU = Treatment as Usual (Standard Counseling), ClM =Clinical Management. Add-ons: Dis = Disulfiram, CM = Contingency Management, Pla = Placebo, VC = Voucher Control.
* p <.05, ** p < .01 indicates statistical significance of effect size. Effect size measure is Hedges’ g. Uncertainty intervals reported for I2 where applicable (Higgins & Thompson 2002).; Positive effect size (odds ratio above 1) favours 12-step intervention;
Carroll 1998: 12+Dis v CBT+Dis, Schottenfeld 2011: 12+CM v CRA+CM, Carroll 2012: 12+Dis v TAU+Dis;
Carroll 1998: 12+Dis v CBT+Dis, Schottenfeld 2011: 12+CM v CRA+CM, Carroll 2012: 12+Pla v TAU+Pla;
Schottenfeld 2011: 12+VC v CRA+VC, Carroll 1998: 12+Dis v CBT+Dis, Carroll 2012: 12+Dis v TAU+Dis;
Schottenfeld 2011: 12+VC v CRA+VC, Carroll 1998: 12+Dis v CBT+Dis, Carroll 2012: 12+Pla v TAU+Pla;
Schottenfeld 2011: 12+CM v CRA+CM, Carroll 1998: 12+Dis v ClM+Dis, Carroll 2012: 12+Dis v TAU+Dis;
Schottenfeld 2011: 12+CM v CRA+CM, Carroll 1998: 12+Dis v ClM+Dis, Carroll 2012: 12+Pla v TAU+Pla;
Schottenfeld 2011: 12+VC v CRA+VC, Carroll 1998: 12+Dis v ClM+Dis, Carroll 2012: 12+Dis v TAU+Dis;
Schottenfeld 2011: 12+VC v CRA+VC, Carroll 1998: 12+Dis v ClM+Dis, Carroll 2012: 12+Pla v TAU+Pla.
Study effect sizes (odds ratios) ranged between 0.50 (Carroll et al., 2012; 12-step and disulfiram in addition to treatment-as-usual versus disulfiram and treatment-as-usual) and 1.33 (Carroll et al, 1998; 12-step and disulfiram versus clinical management and disulfiram). Estimated summary effect sizes ranged between 0.73 and 0.87. None of the estimated summary effect sizes for treatment retention were statistically significant. The I2 statistic indicated a low degree of heterogeneity (0%).
4.4.3.2.3 Follow-up
No studies contributed data to secondary outcomes at follow-up.
4.5 SENSITIVITY ANALYSIS
We conducted sensitivity analysis for drug use and treatment retention for the comparison12-step against other psychosocial intervention. Separate sensitivity analyses were conducted (when possible) for drug use during treatment, post treatment, and six months after end of treatment. These were the only outcomes where the number of studies contributing data was sufficient for sensitivity analysis to be meaningful. We examined the sensitivity of the results to the risk of bias items: sequence generation, incomplete data, and other bias. These analyses did not uncover any significant changes in the point estimates of the summary effect size. Given the small number of studies available, the power to detect such changes wasalso low (see section 11.5).
4.6 PUBLICATION BIAS
In attempt to investigate whether the available data might indicate publication bias, we constructed funnel plots for two outcomes:drug use (during treatment, post treatment, and at 6 months follow-up), and treatment retention. Inspection of the funnel plots did not indicate the presence of publication bias (see section 11.6). However, the power to detect the presence of publication bias is limited by the small number of available studies (Higgins, & Green, 2008, chapter 10.4.3.1).
5 Discussion
5.1 SUMMARY OF MAIN RESULTS
The main objective of this review was to synthesise the effects of 12-step programs aimed at reducing drug use of individuals who use illicit drugs. After an extensive systematic search we found a total of ten studies that met the inclusion criteria for the review. In total we found ten studies meeting our inclusion criteria. Seven of the included studies used a RCT design, two studies used a QRCT design, and one study used a QES design. In seven studies, treatment was partially or fully delivered in group therapy sessions. One study, assessed at high risk of bias, was excluded from meta-analysis. Thus nine studies with a total of 1,071 participants contributed data to the analyses.
In the meta-analyses we compared a) 12-step intervention to other psychosocial intervention(s), and b) 12-step with an add-on treatment versus other psychosocial intervention(s) with an (identical) add-on treatment. Seven studies contributed data to the comparison of 12-step intervention to alternative psychosocial interventions during treatment, at treatment end, and at follow-up (Bisset, 2002; Carroll et al., 1998; Higgins et. al, 1991; Maude-Griffin et al., 1998; McKay et al., 1997; Petry et al. 2010; Wells et al., 1994). The seven studies did not all contribute data to all time points. Three studies contributed data to the comparison between 12-step with an add-on and other psychosocial interventions with the same add-on during treatment, at treatment end, and at follow-up (Carroll et al., 1998; Carroll et al., 2012; Schottenfeld et al., 2011). The primary outcome of interest was reduction in drug use or abstinence from drugs. The secondary outcomes considered were criminal behaviour, prostitution, psychiatric symptoms, social functioning, employment status, homelessness, and retention in treatment. We used random-effects meta-analysis to synthesise effects for each comparison, outcome, and time point (during treatment, post treatment, and at follow-up).
The main bulk of evidence refers to the comparison of 12-step interventions versus other psychosocial interventions. At each time point where a separate meta-analysis was conducted, the estimated summary effect size for drug use was not statistically significant, and therefore did not favour either 12-step or the alternative set of interventions. An additional note of caution stems from the fact that six out of seven studies (Bisset, 2002; Higgins et. al, 1991; Maude-Griffin et al., 1998; McKay et al., 1997; Petry et al. 2010; Wells et al., 1994) did not correct for the design-effect that resulted from individual participants being randomised to group therapy (IRGT-design).
The evidence from comparing 12-step with an add-on treatment against psychosocial intervention with an (identical) add-on treatment for the outcome of drug use were cautiously in favour of 12-step at 6 months follow-up. The evidence builds on data contributed from at most three studies (Carroll et al., 1998; Caroll et al., 2012; Schottenfeld et al., 2011), two of which have the same principal investigator. Summary effect sizes favouring 12-step reached statistical significance at 6 months follow-up, but not at 12 months follow-up. Because multiple testing is involved the tests are unlikely to have nominal size. One of the three studies utilised an IRGT-design (Carroll et al., 2012). We found no statistically significant differences for other outcomes or time points.
All included studies measured and reported on treatment retention. Six studies contributed data for retention to the meta-analysis of the comparison between 12-step and other psychosocial interventions. The summary effect size (OR) was estimated as 0.75 (CI 95%: 0.56 to 1.00) and this effect was significant at the 5% level. This suggests that the alternative set of interventions had more success retaining participants. However five of the studies employed an IRGT-design, which likely exaggerates the precision of the estimated effect sizes. Other comparisons revealed no statistically significant summary effect sizes.
Three studies (Bisset, 2002; Carroll et al., 1998, McKay et al., 1997) reported on a secondary outcome: criminal behaviour, psychiatric symptoms, social function and employment. Meta-analysis for these outcomes did not reveal any statistically significant summary effect sizes. Our secondary outcomes included prostitution and homelessness. None of the studies reported directly on these outcomes, therefore we were not able to present any evidence about the effectiveness of the intervention of these two secondary outcomes, although the legal subcomponent of the ASI, administered in three studies (Bisset, 2002; Carroll et al., 1998; McKay et al., 1997), contains indirect information on prostitution.
5.2 OVERALL COMPLETENESS AND APPLICABILITY OF EVIDENCE
We performed a comprehensive electronic database search, combined with grey literature searching, and hand searching of key journals. In addition, experts in the field were consulted regarding potentially missing studies from our list of included studies. No studies are awaiting classification, nor have we been made aware of any on-going studies. All citations were screened by two independent screeners.
Contrary to our expectations, our search uncovered only one quasi-experimental study meeting the inclusion criteria (Gossop et al., 2007). Gossop et al. (2007) was not included in any meta-analysis because it was deemed to entail too high of a risk of bias. In the context of 12-step, it is surprising that we only located one quasi-experimental study report in our search. Narcotics Anonymous has over 58,000 weekly meetings worldwide (Narcotics Anonymous, 2012). This is indicative of a discrepancy between practice and evidence. In this sense the results of this review regarding effects of 12-step in other settings must be viewed cautiously. This lack of evidence is an important caveat in terms of understanding how and whether the results are applicable to 12-step interventions in self-help settings.
Our main result is that 12-step interventions are, given the available evidence, neither better nor worse than competing interventions. In this situation the cost of the intervention is an important parameter for a decision maker. With a fixed budget and two equally effective interventions, an agency is able to treat more patients if the budget is spent on the less expensive intervention. From a cost perspective, self-help groups with their emphasis on peers, role modelling and social support, appear particularly attractive. We did not study this issue systematically, and included studies did not report on the cost of implementation.
5.3 QUALITY OF THE EVIDENCE
The results of this review should be seen in the context of the weight of evidence. Ten unique studies met inclusion criteria, and not all of these studies contributed data to the same comparisons.
The target population for studies included in this review is notoriously difficult to treat, retain, and follow-up. This results in attrition despite the best efforts of primary researchers to follow-up the complete study sample. As a result, none of the studies were able to perform a true intention-to-treat analysis. For the outcome of drug use for the comparison of 12-step to other psychosocial interventions during treatment the average data completion rate (percent of participants assigned where outcome data was available for analysis) was 96%. The data completion rate for drug use measured post-treatment and at follow-up was lower, in both cases around 80%. Most studies imputed missing values by, for example, assuming that missing urine samples were positive. Other studies limited attention to the part of the sample they were able to follow-up with. Some of the more recent studies used more advanced statistical techniques such as regression analysis that allow for missing data.
Perhaps the biggest concern is the level of analysis. Only two of the included studies carried out statistical analysis at the same level that randomisation was done. The remaining studies employed an IRGT-design (Pals et al., 2008), where participants were individually allocated to treatment, but the treatment itself was administered either fully or partially as group therapy. In these studies, the level of statistical analysis was not conducted at the group level, but rather at the individual level, ignoring the dependency between participants assigned to the same group. If estimates of within-cluster variance and group sizeare available, a design effect (Kish, 1965) can be calculated and used to correct study level standard errors of effect size estimates. Because studies neither reported intra-cluster correlations, nor group sizes, and no credible auxiliary evidence could be brought to bear, we did not correct effect sizes for this design feature. Instead, studies were scored in the Other Bias item in the risk of bias assessment. Regardless, this feature of the evidence warrants caution. When the statistical analysis does not account for clustering there is a risk that the estimated standard errors of effect sizes are too small.
We did not find any clear indication of reporting bias. Authors generally reported all results relevant to the review when they had stated that outcomes were measured. On the other hand, this does not imply that reporting bias is not present. For example, only two of the seven RCT studies reported having registered a protocol (Carroll et al., 2012; Schottenfeld et al., 2011). In the cases where investigators reported having measured additional outcomes relevant to the review, and when these outcomes were not available in the published report, we were able to contact study investigators and obtain the data.
The meta-analyses did not suggest a high degree of statistical heterogeneity. We performed a sensitivity analysis on the basis of the study level risk of bias assessments. These analyses suggested that conclusions were robust with respect to excluding studies with a high risk of bias on, respectively, sequence generation, incomplete data, and other bias. We did not find evidence of publication bias, but the number of studies examined was also small, implying low statistical power to detect bias.
5.4 LIMITATIONS AND POTENTIAL BIASES IN THE REVIEW PROCESS
Our search strategy did not include any language restrictions. Even so it is noteworthy that all but one of the included studies were conducted in the US. Our literature search was also conducted on non-English electronic databases, and the grey literature search was directed toward non-English sources. Thus we have no particular reason to believe that any language bias has been introduced.
In our protocol we did not state that we would assess adverse events. This is a potential limitation, in as far as 12-step interventions might have more or fewer adverse events compared to other interventions. Adverse events were not systematically reported in study reports, and 12-step programs were not reported as leading to additional adverse events compared to other interventions.
The majority of studies employed a study design where participants were individually randomised to group treatment. Such procedures introduce issues with the unit of analysis, because studies conducted analysis at the individual level. This was coded in the “Other bias” item of the risk of bias tool.
We did not include cost as an outcome of interest and none of the included studies supplied data on the cost of implementation.
5.5 AGREEMENTS AND DISAGREEMENTS WITH OTHER STUDIES OR REVIEWS
To the best of our knowledge there is no review that compares 12-step interventions to no intervention or to other interventions for illicit drug users. There are reviews that compare specific drug treatment programs to a condition such as methadone maintenance (Marsch, 1998) and contingency management (Griffith, Rowan-Szal, Roark, & Simpson, 2000) that could be viewed as ‘no intervention’. They found that the specific drug treatment programs were effective compared to no intervention. Prendergast, Podus, Chang, and Urada (2002) compared drug abuse treatments to a no/minimal treatment and to treatment as usual and found a statistically significant summary effect size around 0.30.
Ferri, Amato, and Davoli (2006) reviewed AA and other 12-step programs (TSF) for alcohol dependence and included eight trials. They tentatively concluded that AA/TSF is not more effective than competing interventions; a finding this review echoes, on a different population.
6 Authors’ conclusions
6.1 IMPLICATIONS FOR PRACTICE AND POLICY
This review set out to compare 12-step programs (TSF and self-help) for illicit drug dependence to no/minimal intervention and to competing interventions.
The review located only one study that compared 12-step to minimal intervention (Bisset, 2002). In this context it is important to emphasise that other reviews have demonstrated that drug abuse treatment is effective in reducing drug use compared to no/minimal intervention (see for example, Prendergast et al. 2002 and the references cited therein).
The main bulk of evidence of this review compares 12-step approaches to other competing psychosocial approaches to drug treatment, such as contingency management, CBT, BT, and relapse prevention. We also found a smaller evidence base that compared 12-step with an add-onto other psychosocial interventions with an add-on.
The primary outcome of drug use was assessed during treatment, post treatment, and at 6 and 12 months follow-up. We found no statistically significant summary effect size estimates for drug use during treatment and post treatment. At 6 months follow-up we found that 12-step with an add-on compared to other interventions with an identical add-on led to lower drug use (Hedges’ g =0.48, 95% CI: 0.06 to 0.90, and g=0.45, 95% CI: 0.03 to 0.88). Other comparisons at 6 months follow-up for drug use were not statistically significant. No statistically significant differences between treatments for drug use were found at 12-months follow-up.
There are a number of reasons to interpret results cautiously. First, the population is hard to retain in treatment and even harder to follow-up. This increases the uncertainty with which effects of interventions are measured. For example very few studies report intention-to-treat (ITT) estimates. In the context of voluntary participation in programs an ITT estimate of effectiveness is most relevant when selecting between competing programs. Second, most drug abuse treatments are implemented in group therapy settings. None of the studies who delivered treatment in group therapy settings adequately dealt with this design feature in their statistical analysis. The implication is that the precision of effect size estimates from individual studies will tend to be exaggerated.
Based on these results our interpretation of the evidence is that 12-step programs appear to be as effective as competing drug abuse treatments. The evidence is inconclusive about whether one alternative program is better than another. This implies that local context and experience should take precedence when choosing between competing treatments.
The participants in the included studies were both males and females. Across studies the average age of participants ranged from 28 to 43 years on average. Participants were predominantly cocaine dependent, and in two studies participants were also on methadone maintenance (Bisset, 2002; Carroll et al., 2012). Two studies considered participants that were particularly vulnerable who in addition to drug dependence were either: HIV positive (Petry et al., 2010) or pregnant/had young dependants (Schottenfeld et al., 2011). This review offers limited evidence about the effects of treatment for other types of illicit drug dependencies than cocaine dependence, and for treatment effects for older adolescents.
The types of interventions included in this review were overwhelmingly manual-based interventions delivered by experienced therapists. Only one of the included studies studied 12-step programs in the self-help domain (Gossop et al., 2007), and this study was excluded from meta-analysis following risk of bias assessment. This review offers little evidence about the effectiveness of 12-step programs as delivered in self-help groups. There appears to be a discrepancy between how 12-step interventions are typically implemented in practice, in self-help groups, and the type of study designs and research evidence available for meta-analysis. All studies that were synthesised in meta-analysis were conducted in the US. In as far as population, setting, and delivery differs in other countries, the results should be interpreted in this light.
Economic considerations such as cost of treatment were not included in this review. None of the included studies supplied data on the cost of implementation. Because we cannot say that one treatment is better than another, based on the results of this review, considerations of cost may be particularly relevant.
6.2 IMPLICATIONS FOR RESEARCH
Although the main evidence presented in this review must be interpreted with caution, there are some important implications for research.
Compared to 12-step approaches, other psychosocial treatments appear to be neither worse nor better at reducing drug use. This conclusion has implications for research in this area. First, detecting small differences in the effectiveness of treatments will require large trials, or increased use of meta-analytical techniques to pool results across different trials. Second, a complementary approach is to more thoroughly establish a theory of change. This will be a first step allowing researchers to go beyond program names and towards understanding not only the active ingredients of treatments, but also understanding the importance of these ingredients for primary outcomes of interest. One approach to this challenge would be to develop intermediate treatment specific measures through which treatment is hypothesised to work. For example, 12-step programs are built up around a series of steps through which the patient graduallylearns a set of skills that allow them to deal with their addiction and achieve abstinence. Providing evidence on the gradual attainment of such skills and their influence on final or intermediate outcomes will be of great interest. Likewise, other psychosocial interventions specify competing mechanisms through which the patients will learn to master their addiction. Establishing whether such links exist will help us understand the commonalities between different programs and identify active ingredients. In addition, such a research program may involve complementary research methodologies of a more qualitative nature.
As our knowledge in this field gradually accumulates it will also be important for investigators to document and report potential prognostic factors e.g. social background, referral type (e.g. court-mandated, voluntary, etc.) and treatment motivation of participants. Meta-regression could then be applied to explore and generate hypotheses regarding positive and negative factors influencing treatment success. It will be of increasing importance that investigators report implementation costs in addition to the effects of intervention such that a cost-effectiveness analysis can be performed. This is particularly important in the context of drug abuse treatment because (a) treatment is typically very expensive, and (b) the negative impacts of drug abuse on friends, family and society may be great.
Many drug abuse treatments are delivered in a group therapy setting. It will be important for future research to adequately control for this design feature. Investigators should report or make available estimates of intra-cluster correlations and document group sizes. If such a practice was adopted, it would be possible to revisit reviews like this one and credibly correct the precision of effect size estimates for this design feature.
We need more evidence about the effects of 12-step programs for other populations. Increasing our knowledge of the effect of treatment for younger participants with drug dependence is an important area. Also increased knowledge of effects of 12-step programs for populations who are dependent on other drugs than cocaine is needed.
Finally, 12-step interventions to treat drug dependency are also offered in the form of self-help groups. It is plausible that this form of treatment attracts different populations than those studied in this review. For example participation in self-help groups, is often based more loosely on voluntary participation. Such 12-step services may be the next step after initial inpatient detoxification. This review found only one study which considered this setting. Future research may explore the effect of 12-step interventions in self-help groups. Identifying credible causal effects in these settings appears to be more challenging. Treatment intensity will be lower than in more institutionalised settings, and sample attrition may be a bigger threat to identification. Nevertheless, given the widespread practice and the lack of solid evidence on its effectiveness, this is an important area for future research.
Footnotes
7 References
8 About this review
9 Tables
10 Figures
11 Data and analyses
1
The terms use, misuse, abuse and dependence will be used interchangeably throughout the review and refer to an addiction stage of drug usage.
2
Cannabis is illegal in most, but not all countries. For example, use of cannabis in small amounts is not a criminal offence in the Netherlands.
3
The insistence on hitting bottom lies in the belief that few individuals will be sincerely motivated to commit to recovery unless they have “hit the bottom”. This bottom can be wherever the individual allows it to be. The central idea is that individuals must come to a turning point where they accept that they have reached a stage of complete defeat to drugs (Alcoholics Anonymous, 2005).
4

5
Authors were contacted in September, 2014. Four corresponding authors did not reply to our enquiries, two replied that data had been discarded, and one replied positively and supplied the requested study level information in full detail.
7
8
Since only two studies were available for synthesis calculating uncertainty intervals for I2 was not possible.
9
This risk of bias model was introduced by Prof. Reeves at a workshop on risk of bias in non-randomized studies at SFI Campbell, February 2011. The model is a further development of work carried out in the Cochrane Non-Randomised Studies Method Group (NRSMG).
Supplementary Material
Please find the following supplemental material available below.
For Open Access articles published under a Creative Commons License, all supplemental material carries the same license as the article it is associated with.
For non-Open Access articles published, all supplemental material carries a non-exclusive license, and permission requests for re-use of supplemental material or any part of supplemental material shall be sent directly to the copyright owner as specified in the copyright notice associated with the article.
