
Abstract
Historically, breast cancer classification has relied on prognostic subtypes. Thus, unlike hematopoietic cancers, breast tumor classification lacks phylogenetic rationale. The feasibility of phylogenetic classification of breast tumors has recently been demonstrated based on estrogen receptor (ER), androgen receptor (AR), vitamin D receptor (VDR) and Keratin 5 expression. Four hormonal states (HR0–3) comprising 11 cellular subtypes of breast cells have been proposed. This classification scheme has been shown to have relevance to clinical prognosis. We examine the implications of such phylogenetic classification on DNA methylation of both breast tumors and normal breast tissues by applying recently developed deconvolution algorithms to three DNA methylation data sets archived on Gene Expression Omnibus. We propose that breast tumors arising from a particular cell-of-origin essentially magnify the epigenetic state of their original cell type. We demonstrate that DNA methylation of tumors manifests patterns consistent with cell-specific epigenetic states, that these states correspond roughly to previously posited normal breast cell types, and that estimates of proportions of the underlying cell types are predictive of tumor phenotypes. Taken together, these findings suggest that the epigenetics of breast tumors is ultimately based on the underlying phylogeny of normal breast tissue.
Introduction
Historically, taxonomy of a disease entity has been based on an underlying biology that explains the pathogenesis of a particular disease. Once a disease is established as a single uniform entity from the perspective of a common pathophysiology, various clinical and molecular prognostic features are used to define the severity of the disease.
This paradigm has been difficult to follow for cancer classification, because of our lack of understanding of the underlying mechanisms. In the case of breast cancer, an empirical system developed over the past three decades without a clear underlying organizing principle. Clinically, human breast cancers are currently grouped into three categories based on the presence of estrogen receptor (ER+), progesterone receptor (PR+), and human epidermal growth factor receptor 2 (HER2+) or by their absence in triple-negative breast cancers (ER/PR/HER2–-). These categories are based on biomarkers that correlate with response to different treatments such as ER-antagonist tamoxifen and anti-HER2 treatment herceptin. Though pragmatic, such an ad hoc classification scheme does not provide insights about the pathogenesis or true phylogeny of breast cancer. A comprehensive discussion of inaccuracies of breast cancer classification appears in a recent review. 1
With the emergence of high-throughput molecular statistical tools, several purely prognostic classification schemes have been proposed for breast cancer. For example, messenger RNA (mRNA) expression profiles of breast tumors have been used to define four prognostic subgroups of breast cancer: Luminal A, Luminal B, Basal-like, Claudin-low and Her2-like. 2 DNA methylation patterns have been used to identify five distinct groups 3 and 10 different breast cancer clusters have been identified in a DNA copy number-based genetic classification system.4,5
However, while prognostic categories subdivide diagnostic categories into distinct outcome groups, they cannot be the sole basis of a comprehensive classification approach. The principal reason for this is that in a purely prognostic approach, the only criterion that distinguishes two entities is their difference in clinical outcome. Hence, two different entities with the same outcome but with different pathogenesis cannot be distinguished by this approach. This is a nontrivial issue as they may require different treatment approaches because of the differences in pathophysiology. Conversely, a purely prognostic approach may end up categorizing two different stages of a single disease as different entities.
Consequently, purely molecular prognostic approaches to classify breast cancer have not led to a comprehensive classification. There has been little overlap among the mRNA expression, DNA copy number, and methylation-based prognostic groups, because they are not based on a common pathophysiology. A breast cancer task force recently concluded that molecular tools do not currently provide sufficiently robust information beyond histological type, grade, and ER, PR, and HER2 status, 6 and these molecular tests are therefore not routinely performed at most institutions. 7
We set out to provide a pathophysiological framework that can provide a biological setting in which prognostic categories can be discovered. The phylogeny of normal cell types have been successfully used as a reference point to classify lymphomas and leukemias. 8 The discovery of the molecular similarity between leukemias and lymphomas with normal lymphocytes and leukocytes was important in this process.
In solid tissues, characterization of the normal cell subtypes has been difficult. Until recently, only two cell types -luminal versus myoepithelial cells – had been described in the human breast. 9 This has precluded a normal cell-type-based classification system for breast cancer. Inspired by the classification of hematopoietic malignancies, we hypothesized that a more detailed description of normal cell types in the human breast may be important for classification of human breast tumors.
Recently, we analyzed more than 15,000 normal breast cells and described the normal phylogeny of cell subtypes in the luminal layer of human breast. 10 These cell types conform to four novel hormonal differentiation groups (HR0, HR1, HR2, and HR3) based on estrogen receptor, androgen receptor, and vitamin D receptor (ER, AR, and VDR) in normal human breast. When normal cell types were compared with more than 3000 human breast tumors, we found that each patient's tumor could be placed precisely in this normal cell-type phylogeny.
In this study, we examine breast tumor “taxonomy” based on normal tissue differentiation: triple-positive tumors (HR3) that co-express ER, AR, and VDR; double-positive tumors (HR2) that are ER/AR[+] (HR2ea), AR/VDR[+] (HR2av), or ER/VDR[+], (HR2ev); single-positive tumors (HR1) that only express one of the hormone receptors, ER[+] (HR1e), VDR[+] (HR1v), or AR[+] (HR1a); and hormone receptor–negative tumors (HR0) that are negative for ER, AR, and VDR.
In general, normal tissue differentiation and cellular phylogeny is regulated by epigenetic mechanisms. It remains to be demonstrated that an epigenetic basis exists for the breast-specific phylogeny we have described. DNA methylation, tightly associated with alterations in the nucleosome DNA scaffold (and hence chromatin), is in part responsible for coordination of gene expression in individual cells.11–13 Differentially methylated DNA regions (DMRs) distinguish cell lineages with high sensitivity and specificity,
14
and considerable research has been underway to delineate precise DMRs that define and specify a particular cell lineage. Our recently published set of statistical methods exploits this association to infer changes in cell mixture proportions solely on the basis of a DNA methylation profile. These methods are based on linear mixing assumptions, ie, that latent linear structures within DNA methylation profiles reflect phenotypic associations with cell mixture. In particular, we have demonstrated the use of a reference DNA methylation data set to deconvolve a separate target DNA methylation data set into constituent cell-type proportions
15
and have more recently demonstrated the reference-free deconvolution of DNA methylation data sets, which allows for inference of latent linear structures reflecting cellular mixtures when no reference data sets exist.
16
Both methods assume that DNA methylation is measured on an average beta scale roughly corresponding to a fraction of methylated cytosine molecules and that an m X n matrix Y of average beta values (m = # CpG sites, n = # subjects) is linearly generated via E(
No reference data set currently exists for normal breast cells types. However, we propose that breast tumors, arising from a particular cell-of-origin in a more-or-less clonal fashion, will essentially magnify the epigenetic state of their original cell type. In particular, any phenotype that reflects histologic information will also contain information about the epigenetics of normal breast cells. Specifically, if the proportions Ω of constituent cell types vary with available phenotypic information
In this paper, we use three publicly available breast tumor methylation data sets to test our hypothesis. All three data sets were obtained from Gene Expression Omnibus (GEO), and each contain data assayed by the Illumina Human-Methylation27 BeadChip array. Table 1 describes the data sets, GSE20712,
17
GSE31979,
18
and GSE32393.
19
Note that each of the three data sets contains additional samples reflecting normal breast tissue, and GSE20712 also includes companion mRNA expression data set, GSE20711. Regressing DNA methylation data on phenotype matrices
Summary of data sets.

A total of 103 total samples were available, but 13 had missing/ambiguous histology.
Six healthy tissues matched to tumor and 15 to normal breast organoid.
Results
Comparison of Delta and Beta Coefficients
We applied the method of Houseman et al.
16
to tumor data obtained from the three GEO data sets described in Table 1. The phenotype matrix

Overlaps in CpGs and genes having significant Δ or B coefficients. Each panel reports the number of features that significantly distinguish clinical phenotypes within three breast cancer data sets (described comprehensively in Tables 1 and 2). Panels (A) and (B) report significant (q < 0.05) CpG loci, while panels (C) and (D) report unique genes to which significant CpG loci are mapped. Panels (A) and (C) report significance based on Δ coefficients (representing cell-composition effects), while panels (B) and (D) report B coefficients (representing effects not mediated by cell composition).
Summary of analysis.

Figure S2 illustrates correlation among estimates of
Figure 2 shows the GeneDecks annotation terms most significantly associated with lists of genes to which significant (q < 0.05) CpGs are mapped, either via Δ or via
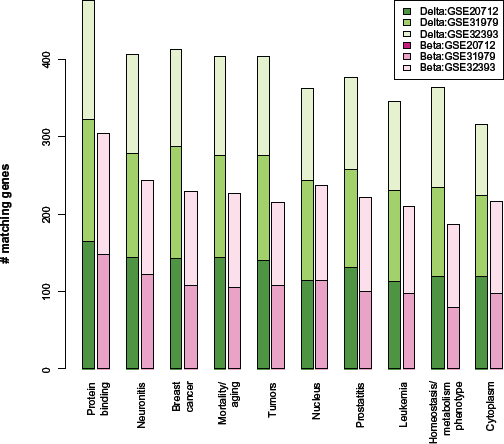
Annotation terms associated with significant Δ or B coefficients. Bars indicate the number of unique genes within three breast cancer data sets (described comprehensively in Tables 1 and 2) that map to top GeneDecks terms. These were unique genes, up to 500 for each of six analyses that map to the CpG-specific coefficients having the smallest P-values for distinguishing clinical phenotypes. Green bars are based on Δ coefficients (representing cell-composition effects), while pink bars are based on B coefficients (representing effects not mediated by cell composition). Note that for GSE20712, no significant B coefficients mapped to these genes associated with these 10 terms. The 10 terms shown are those that had the highest average count across all six analyses.
Comparison with Normal Breast Tissue
We next sought to compare the biological significance of Δ-based coefficients with

Correspondence of estimated normal cell proportions. Panel (A): left subpanel indicates estimated proportions; right subpanel illustrates variation among bootstrap samples. Panel (B): distributions of cell proportions inferred from tumor data or normal cell data obtained from Santagata et al. 10
Normal breast tissues available.

Normal breast cell types.

Numbers of tumors available in both GSE20712 (DNA methylation) and GSE20711 (mRNA expression).
Comparisons with Tumor Tissue
Finally, we applied the deconvolution method described above to tumor data from GSE31979 and GSE32393. Clustering heat maps appearing in Figures 4 and 5 depict the correspondence of tumor histology with inferred cell proportions (via Delta coefficients):

Clustering heat map showing estimated proportions of normal cell types within tumors available in GSE31979. Left annotation bar represents tumor phenotype; top annotation bar represents HR classification of normal breast cell types, further described by bottom labels.

Clustering heat map showing estimated proportions of normal cell types within tumors available in GSE32393. Left annotation bar represents tumor phenotype; top annotation bar represents HR classification of normal breast cell types, further described by bottom labels.
Discussion
We hypothesized that the coefficient matrix A, representing the effects of tumor phenotype on DNA methylation mediated by cell composition, would more stably reflect tumor biology than the coefficient matrix
For the prominent annotation terms that match genes to which CpGs having DNA methylation significantly associated with phenotype are mapped, more genes are mapped to CpGs with significant Δ coefficients than with significant
To distinguish between these two explanations, we analyzed DNA methylation data from normal breast cell tissue, using a supervised deconvolution approach,
15
where cell types were determined by applying expression-based normal breast cell categories
10
to existing mRNA expression data (available for the breast tumors in GSE20712), choosing CpGs that had the most significant Δ coefficients and choosing additional CpGs that identify known immune cell types.
15
The rationale for this analysis was the following: if cell-type heterogeneity in breast tumors is driven by the clonal expansion of a specific type of normal breast cell, then the set of CpGs for which heterogeneity in DNA methylation is explained mostly by cell composition will represent, for the most part, the set of CpGs that serve to identify each normal breast cell type, in the same manner that has been previously characterized for leukocytes.15,30 In other words, tumorogenesis acts to magnify the typical epigenetic state for one type of normal breast cell, thus enabling a plausible (if imperfect) characterization of such states. Emerging from this deconvolution analysis were estimated proportions within normal breast cell tissue of each expression-based normal cell type, described in Table 4, adjusted for immune infiltration. While we did not observe perfect correspondence between these estimated proportions and those obtained from an independent data set,
10
there was general semiquantitative agreement. The greatest discrepancy was that, in our deconvolution analyses, there was a smaller estimated proportion of L1–3 (HR0) cells and a greater estimated proportion of L11 (HR3) cells, when compared to the independent data set based on normal breast tissue, reflecting a potential bias in the use of tumor data to define representative sets CpGs. When we repeated the analysis using the most significant
We applied similar deconvolution analysis to tumor data appearing in GSE31979 and GSE32393; we found negligible correlation of cell-type proportions to HER2 status and substantial agreement in ER status between predicted cell type and tumor histology. We also observed low estimated proportions of leukocytes, suggesting that cell-compositional effects are explained principally by underlying normal cell histology and negligibly by immune infiltration. Finally, we note that the correspondence between tumor phenotype and estimated cell-type proportion was greater for the compositionally based estimates
To date, the most comprehensive integrated molecular profiling of breast tumors is that undertaken by the Cancer Genome Atlas (TCGA) network. 3 The DNA methylation profiling in the TCGA study did not attempt to establish correspondences with normal tissue, so the potential of a direct comparison with our results is limited. However, TCGA found a significant correspondence of DNA methylation with mRNA expression in the Wnt signaling pathway (associated with ERs31–33 and also a child term of the GO “protein binding” term), and also found at most a modest association of DNA methylation with HER2 status. A slightly older study 34 found no associations between DNA methylation and ER status, parity, or oral contraceptive use (ie, hormonal signaling), but this study used the relatively sparse GoldenGate platform (Illumina, Inc) for assaying DNA methylation.
We note that a substantial proportion of the tumors in GSE31979 and GSE32393 were apparently members of the triple-positive HR3 lineage, while smaller fractions were members of the triple-negative HR0 lineage. While these proportions are biased by selection of tumors in the original study and thus do not necessarily represent population-based estimates, we note that in our earlier study
10
we found that nearly half of the breast cancer patients belonged to the HR3 group and that patients with these triple-positive tumors (HR3) were up to seven times more likely to survive compared to patients with triple-negative tumors (HR0). Compared with many existing genetic/molecular tests with 2–5 fold survival differences, this cell-type-based approach can become a powerful new tool in predicting patient outcomes, thus representing great prognostic potential. Additionally, we note that the selection of CpGs based on cell-composition effects (Δ) led to greater consistency in significant associations across distinct data sets and better apparent correspondence with normal breast cell phylogeny compared with results obtained by selection of coefficients than CpGs presumed to have an effect independent of cell composition (
A major limitation of this analysis, reflected in the imperfect correspondence between estimated normal cell proportions obtained from the two distinct analytical approaches we employed, is that our CpG sets that putatively distinguish normal breast cell types as well as the normal DNA methylation states estimated for those CpGs were determined from tumor data, thus potentially biased by epigenetic changes related to carcinogenesis. We would expect much cleaner correspondence if the CpGs and their normal methylation states could be obtained by profiling DNA methylation for isolated cell types from normal breast tissue. While no such data sets yet exist, we anticipate that such data sets will exist in the near future, thus potentially validating the findings in the present article.
Finally, it is worth noting that we initiated this study based on eight cell subtype lineages defined by protein expression for ER, AR, VDR, and K5 detected by immunostains. The CpG methylation results corresponding to these eight lineages suggest that they may have distinct DNA methylation signatures. Hence, this result supports the notion that these protein-based phenotypic categories may have an epigenomic underpinning. These results indicate that the novel analytical approach we used for estimating normal cell proportions from protein co-expression cell counts could be applied more generally to estimate normal cell proportions for heterogeneous tissue.
Materials and Methods
Data Sets
Data sets were obtained from GEO. All three sets (accession numbers GSE20712, GSE31979, and GSE32393) represent DNA methylation data assayed via the Illumina HumanMethylation27 BeadChip Array platform. Beadchip identifiers were available for data sets GSE20712 and GSE32393, so these were used to preadjust logitaverage betas for BeadChip batch effects using the ComBAT algorithm, 35 protecting histology, and ER status against over-adjustment. As beta values are required for the method published by Houseman et al. 16 adjusted values were subsequently transformed back via inverse-logit to the average beta scale. Only CpGs having fewer than three missing values were used in analysis. We attempted to minimize the size of the models used in this analysis by omitting covariates that displayed only weak overall associations with DNA methylation by preliminary assessment via limma analysis. 36 For GSE20712, paired mRNA expression data assayed via Affymetrix Human Genome U133 Plus 2.0 Array exist in GEO via accession number GSE20711; these were used to assign cell-of-origin categories to individual tumors in GSE20712.
Delta and Beta Coefficients
For each of the three data sets analyzed, we used the recently published reference-free deconvolution algorithm
16
to estimate CpG-specific DNA methylation effects adjusted for cell mixture, as implemented in the R package RefFreeEWAS (version 1.01) within R version 3.0.0. For each data set, the covariate matrix
In order to estimate the variation in estimators
Comparison with Normal Breast Tissue
To estimate the distribution of normal breast cell types, we used data from Tables S2A through S2D in Santagata et al.
10
Each of these tables provides co-expression frequencies of five proteins: K5, VDR, ER, AR, and Ki67. In particular, for two proteins G1 and imaging-based cell counts N10, N01, and N11 are given for
Gene expression arrays were available for 88 of the 119 tumors profiled in GSE20712; paired mRNA expression data appear on GEO via accession number GSE20711. These data were used to assign each of the 88 tumors to one of eight categories based on AR, ER, and VDR expression (collapsing categories L1–2 and L3 in one category and L6 and L7 in another). Bimodal probe 226197_a was used for AR expression, dichotomized approximately between modes at the value 8.0. Bimodal probe 205225_at was used for ESR1, dichotomized approximately between modes at the value 9.0. None of the VDR probes were bimodal, so probe 204254_s_at was used for VDR, dichotomized just below the mean at the value 8.0. Sample sizes for each category are shown in Table 4. Figure S8 in the Supplement depicts the histograms of the expression data as well as the chosen thresholds. The top 5000 CpGs ranked by Delta P-values
To compare

and

with
Comparisons with Tumor Tissue
We also applied the approach described above (to obtain estimates
To evaluate concordancy between cell-type proportions and histological/molecular classification, we fit Dirichlet models to each tumor-specific cell proportion vector, a null model that assumes no concordance and another model that allocates a portion of each sample to the cell-type categories according to histological/molecular classification. Table 2 indicates the variables that were used to define the classification. Note that for GSE31979, 13 tumor samples with missing or ambiguous classification were included in this analysis, assigned to a separate histology category of Ambig, producing seven overall histology categories. Chi-square likelihood-ratio test (LRT) statistics and the corresponding P-values were computed for each data set and statistic (Delta and Beta). Details of the Dirchlet model fitting appear in the Supplementary Methods document.
Author Contributions
Developed statistical algorithms, provided epigenetic expertise, and composed the manuscript: EAH. Provided expertise on breast cancer, breast cancer typing, and edited the manuscript: TAI. Made critical revisions: EAH. Both authors reviewed and approved of the final manuscript.