





Abstract
Almost 800,000 strokes occurred in the United States in 2011 (Centers for Disease Control and Prevention, 2013), and Legh-Smith, Wade, and Hewer (1986) documented that 40% of people with stroke return to active driving. Fisk, Owsley, and Pulley (1997) found that only 15% of people who wished to continue driving poststroke received a comprehensive driving evaluation (CDE), potentially putting themselves and the public at risk (Petzold et al., 2010). Although crash studies involving people with stroke reveal inconsistencies in regard to risk of a motor vehicle crash prospectively, some studies of drivers with stroke have shown marginally elevated crash rates compared with healthy control drivers (Sagberg, 2006), impaired performance on road tests (Fox, Bowden, & Smith, 1998), and difficulty with traffic skills on driving simulators (Akinwuntan, Wachtel, & Rosen, 2012). Bacon, Fisher, Morris, Rizzo, and Spanaki (2007) noted that colleagues, families, and the department of motor vehicles may need to assist with the difficult decision of whether a person with stroke is fit to drive, a determination that could ultimately lead to driving retirement. Driving cessation has been associated with a decrease in social integration (Mezuk & Rebok, 2008), decreased out-of-home activities (Marottoli et al., 2000), an increase in depressive symptoms (Fonda, Wallace, & Herzog, 2001), and increased risk of nursing home placement (Freeman, Gange, Muñoz, & West, 2006).
Impairments related to sensorimotor function, visual perception, and cognition may occur in people with stroke depending on the lesion site. Key domains necessary to determine fitness to drive typically include visuospatial and visuoconstructional skills, which are governed by the executive system of the brain and require significant attentional capacity. Specific tests that have been found to be predictive of driving performance after stroke and that tap into these functional abilities include cube copy (Nouri & Lincoln, 1992); traffic sign recognition (Lundberg, Caneman, Samuelsson, Hakamies-Blomqvist, & Almkvist, 2003); the Stroke Drivers Screening Assessment (Söderström, Pettersson, & Leppert, 2006); the Compass Test (Nouri & Lincoln, 1993); the Trail Making Test Part A (Trails A); and, especially, the Trail Making Test Part B (Trails B; Mazer et al., 2003). The Useful Field of View® (UFOV) Subtest 2 was recently noted to have a high degree of sensitivity in identifying people with stroke who failed a standardized road test (George & Crotty, 2010).
In the current study, we aimed to develop a predictive model of driving performance for people with stroke by using a combination of brief cognitive screens that could be easily administered by clinicians and adopted at low cost in a variety of settings. A similar approach by Carr, Barco, Wallendorf, Snellgrove, and Ott (2011) with a sample of older drivers with dementia was recently published. If similar findings are confirmed, these tests might be adopted to determine who is most appropriate for referral for performance-based on-road testing.
Method
Research Design
This study used a cross-sectional observational research design to determine whether off-road tests of key functional abilities were predictive of performance on a standardized road test in an occupational therapy–based driving clinic at an academic rehabilitation center. The Human Studies Committee at Washington University in St. Louis approved this study.
Participants and Recruitment
Physicians and rehabilitation staff were notified about the driving study at rehabilitation meetings, by word of mouth, and through e-mail and letters. Recruitment was targeted at subspecialty clinics at Washington University School of Medicine and The Rehabilitation Institute of St. Louis, a 96-bed acute medical rehabilitation hospital adjacent to the Washington University Medical Center campus in mid-town St. Louis. Participants were referred for a CDE, which includes a comprehensive assessment of vision, motor, and cognitive skills as well as an on-road assessment. Referrals were made between January 2008 and July 2009 and required a physician or nurse practitioner to complete a medical referral form.
Inclusion Criteria.
Inclusion criteria were being an licensed driver with at least 10 yr experience so as not to include novice drivers (thus requiring age >25 yr), having an informant available to participate (typically a spouse or adult child), having a physician referral with a primary diagnosis of stroke, being able to communicate in English, and having a score between 0 and 13 on the National Institutes of Health Stroke Scale (NIHSS), a brief physical examination to detect the clinical presence of stroke (National Institute of Neurological Disorders and Stroke, 2003). Our intent was to capture the people with stroke who had the most egregious driving performance for whom termination of driving privileges would be clinically recommended. Participants were not evaluated at a specific time poststroke but simply when the referring physician believed they were clinically stable and ready to participate in a CDE. People with both right- and left-sided hemispheric strokes were recruited for this study. Informants were included in this study to determine whether they had observed any driving behaviors or functional impairments that might be predictive of road test performance (data not presented here), to participate in the driving recommendations meeting, and to be able to drive the participant home if the participant was deemed unsafe to drive.
Exclusion Criteria.
Exclusion criteria were active depression, unstable illness (e.g., recent seizure), severe physical limitations (e.g., amputation), sensory or communication impairments that would interfere with psychometric testing or following instructions during road testing (e.g., severe vision or hearing impairment or language deficit such as severe receptive or expressive aphasia), use of medications causing excessive sedation (indicated by being too fatigued or impaired to adequately follow instructions on the clinical assessment portion of the road test), inability to participate in the road test (e.g., was clinically judged by the assessing occupational therapist to be too fatigued to follow directions, did not meet state vision requirements for driving after clinical testing or an ophthalmology consult, lacked a driver’s license), or participation in a CDE within the previous 12 mo.
Telephone Screening.
After referral to this study, participants and their informants underwent a 20-min telephone screening 1 to 2 mo before the CDE to ensure that inclusion and exclusion criteria were met.
Location and Data Collection
This study was based at an outpatient driving assessment clinic that performed CDEs at a rehabilitation center with academic affiliations. Off-road clinical assessments and on-road testing were performed on the same day. Pertinent data for this study were collected from the clinical record and entered into a research database.
Psychometric Test Administration and Training
The lead occupational therapist was a driver rehabilitation specialist (OT/DRS) who had more than 15 yr experience as a DRS and was trained by a psychometrician in the standardized administration of the psychometric tests. The lead therapist trained an occupational therapist, an occupational therapy assistant (supervised by the occupational therapist), and an occupational therapy doctoral student in the administration of the standardized clinical assessment. These practitioners were present and participated in the final recommendations and discussion meeting with the participant and informant after the CDE was completed. The occupational therapists performing the clinical assessment were different from the occupational therapist who performed the on-road assessment.
Off-Road Clinical Assessment
Once the participant and informant (typically a spouse or adult child) had read and signed informed consent and completed the questionnaires, the occupational therapist in the driving clinic proceeded with standardized tests of vision, cognition, and motor abilities, in that order. The off-road clinical assessment lasted approximately 90 min.
Vision.
Participants were tested for both far and near visual acuity and visual fields with the Optec 5500P (Stereo Optical Co., Chicago). Determination of the presence of visual field cuts was based on whether participants missed any of the 8 possible stimuli (4 each in the left and right field of view) that were presented during testing. Contrast sensitivity was tested using the Pelli–Robson contrast sensitivity chart (Pelli, Robson, & Wilkins, 1988).
Cognition.
The Short Blessed Test (Katzman et al., 1983) was included as a brief mental status screen of orientation, memory, and concentration. The Clock Drawing Test (Freund, Gravenstein, Ferris, Burke, & Shaheen, 2005) and the Snellgrove Maze Task® (SMT) were included as measures of executive function and visual–spatial abilities. Additonally included in the off-road tests were the Trail Making Test Part A, a test of attention, psychomotor speed, and visual scanning, and the Trail Making Test Part B, which adds the complexity of switching attention sets and executive function (Reitan, 1958). The Digit Span Forward and Backward Test (Gerton et al., 2004) measured immediate and working memory, respectively. Finally, two subtests were administered from the DrivingHealth® Inventory (TransAnalytics Health & Safety Services, Quakertown, PA): Subtest 2 of the UFOV (Visual Awareness Research Group, Punta Gorda, FL), a measure of divided visual attention, visual memory, and speed of processing, and the Motor-Free Visual Perceptual Test (Staplin, Gish, & Wagner, 2003), a test of visual closure (Ball, 2006). For all cognitive tests, higher scores indicated more impairment, except for the Clock Drawing Task (using the 0–7 point Freund scoring method) and the Digit Span Forward and Backward Test. Each test has its own psychometric properties and scoring criteria. Some of the tests were adopted later, after the study was initiated (e.g., DrivingHealth Inventory, UFOV, Motor-Free Visual Perceptual Test), which accounts for a smaller sample size on these tests.
Motor Abilities.
Muscle testing was measured using the traditional 0–5 scale. Range of motion of all joints was documented by observation using standardized positioning format and categorized according to restrictions (i.e., normal, less than 1/2 range, between 1/2 and 3/4 range). These categories were later reduced to a dichotomous value of normal or restricted. Cervical range of motion measurements in degrees were obtained using standard goniometric techniques. Grip strength was assessed using the Jamar grip dynamometer (Sammons Preston Rolyan, Chicago) for each hand, averaging the sum of three trials (Bohannon, Peolsson, Massy-Westropp, Desrosiers, & Bear-Lehman, 2006). The Rapid Pace Walk (Ball et al., 2006) and the Nine Hole Peg Test (Grice et al., 2003) were used as measures of motor speed and coordination. Brake reaction time of the right lower extremity, measured using the Braking Response Time Monitor (Delta Integration, Lancaster, PA), was included as a measure of both cognitive and motor reaction time difficulties that could result poststroke.
Outcome Measure: Performance-Based On-Road Test
The route for the original Washington University Road Test (WURT; Hunt et al., 1997) could no longer be used because of changes in the roadway and building construction. The modified WURT (mWURT), which takes place in an urban setting, consists of varying levels of traffic conditions. It begins in a small, quiet parking lot in a public park area. Driving in the parking lot allows the participant to become familiar with the automobile. If the participant is able to demonstrate proficiency with the basic operations of the automobile and follow instructions, testing slowly progresses from less complex traffic conditions (driving in the park itself) to more complex traffic conditions (driving on urban streets). In more challenging traffic conditions, the driver has to maintain speed, obey traffic signs, signal, turn, yield the right of way, change lanes, and react to other drivers. The course consists of 14 right turns (5 at stop signs, 3 at traffic lights, 6 unprotected), 11 left turns (6 at traffic lights, 5 unprotected), 33 traffic lights, and 10 stop signs. Additionally, a small part of the course includes self-navigation (i.e., being able to find the way out of a parking lot independently and then return to the correct road). The mWURT course is 13 miles long and takes approximately 50 to 60 min to complete.
Rating.
An occupational therapist certified driver rehabilitation specialist (OT/CDRS), separate from the occupational therapists performing the off-road testing, was contracted to provide the on-road testing. At the time of the study, the OT/CDRS had more than 5 yr of experience evaluating medically impaired drivers in traffic. The testing occurred in a four-door sedan (Chevrolet Impala) equipped with a dual set of brakes. The OT/CDRS sat in the front seat monitoring the safety of the vehicle and evaluating driving performance. The OT/CDRS provided directions during the course. At the end of the drive, the OT/CDRS provided an overall score or qualitative rating of driving performance (pass, marginal, fail) consistent with previously published WURT studies. Drivers who received marginal and pass ratings were grouped and compared with drivers who failed.
A fail rating on the on-road testing using the mWURT was the outcome measure of this study because this rating identified the drivers with the most impaired driving, and this rating resulted in a recommendation to discontinue driving. Our aim was to identify the clients for whom safety concerns were the highest. The OT/DRS (with more than 15 years of experience) was present in the back seat of the car during 33 randomly chosen tests (with 46% of the sample) to provide a measure of interrater reliability with the front-seat driving evaluator. The interrater reliability for pass–marginal and fail ratings was high, κ = .94, 95% confidence interval (CI) [0.81, 1.0].
Blinding.
The occupational therapists who performed the off-road tests were different from the OT/CDRS who performed and rated the on-road evaluation. These occupational therapists were allowed to communicate to the OT/CDRS who did the on-road test any key safety concerns (e.g., severe visual field cuts, severe initiation or processing deficits based on psychometric test performance, significant language impairments) that they believed would affect the safety of car occupants and the public. In 39 cases, it was documented that the off-road evaluators provided safety-related information to the driving evaluator. In 22 cases the on-road tester was blinded to all off-road test information, and in 11 cases the documentation was unclear on whether communication had taken place.
Data Analysis
To predict a failure rating on the mWURT, simple logistic regression (SAS Version 9.2 logistic procedure; SAS Institute, Cary, NC) was performed on each explanatory variable (Tables 1 and 2). These results were used to identify a set of key variables with a Wald test p < .05. Categorical regression tree analysis (R Version 2.10.1, R Foundation for Statistical Computing, Vienna, Austria) was used as a diagnostic aid to further reduce the set of variables to Trails A, SMT, NIHSS total, and acuity–far (results not shown). Stepwise multiple logistic regression was not used because listwise deletion of cases with missing values reduced the data set. All 10 combinations of variables were fit in multiple logistic regression models. Among the models with good fit, we used the model with the greatest receiver operating characteristic (ROC) area under the curve (AUC) using standard techniques for prediction. To predict failure for each participant, leave-one-out cross-validation was used with a cut point of .70 for probability to fail.
Demographics and Noncognitive Measure Results, by Road Test Outcome
Note. LogMAR = logarithm of the minimum angle of resolution; SD = standard deviation. A total of 62% of participants passed the road test, and 38% failed the road test.
Psychometric Test Results, by Road Test Outcome
Note. SD = standard deviation. A total of 62% of participants passed the road test, and 38% failed the road test.
Results
Of the total of 121 participants referred to this study, 49 were excluded for reasons including not having had the NIHSS administered (n = 18), refusal (n = 10), not having a valid driver’s license (n = 8), having an unstable medical condition (e.g., seizures, severe visual impairment; n = 3), not having a physician who would provide a referral (n = 2), scheduling difficulties (n = 2), not participating in any aspect of the road test (n = 2), having had a previous CDE (n = 1), admission to a nursing home (n = 1), age (n = 1), or having no informant (n = 1). The final sample size was 72.
Table 1 summarizes the participants’ demographic information, driving behaviors, and results of noncognitive measures. The average time to CDE after the stroke was 8 mo ± 9.7 mo (range = 1–60 mo). Of the 7 participants who were referred after 2 yr, only 1 passed the road test. Age and years of driving experience (also a factor of age) revealed differences between pass and fail groups. Of the visual and motor variables, the measure of contrast sensitivity, left-handed Nine Hole Peg Test, and brake reaction time were significantly related to road test failure (ps = .050, .018, and .013, respectively). Table 2 lists the standardized cognitive–perceptual test results. Some tests have smaller sample sizes because they were adopted later during the course of the study, participants may have been fatigued or refused testing, the computer may have had hardware problems, or data may have been missing.
We found no differences (Pearson χ2 p = .71) in the fail rate between groups for participants who required vehicle adaptations because of motor deficits (e.g., left foot accelerator, spinner knob, hand controls) during road testing (n = 15, fail rate 33%) and those who did not (n = 57, fail rate 39%). The fail rates were equal for participants whose evaluators were blinded (n = 22, fail rate 36%) versus definitely unblinded (n = 39, fail rate 36%).
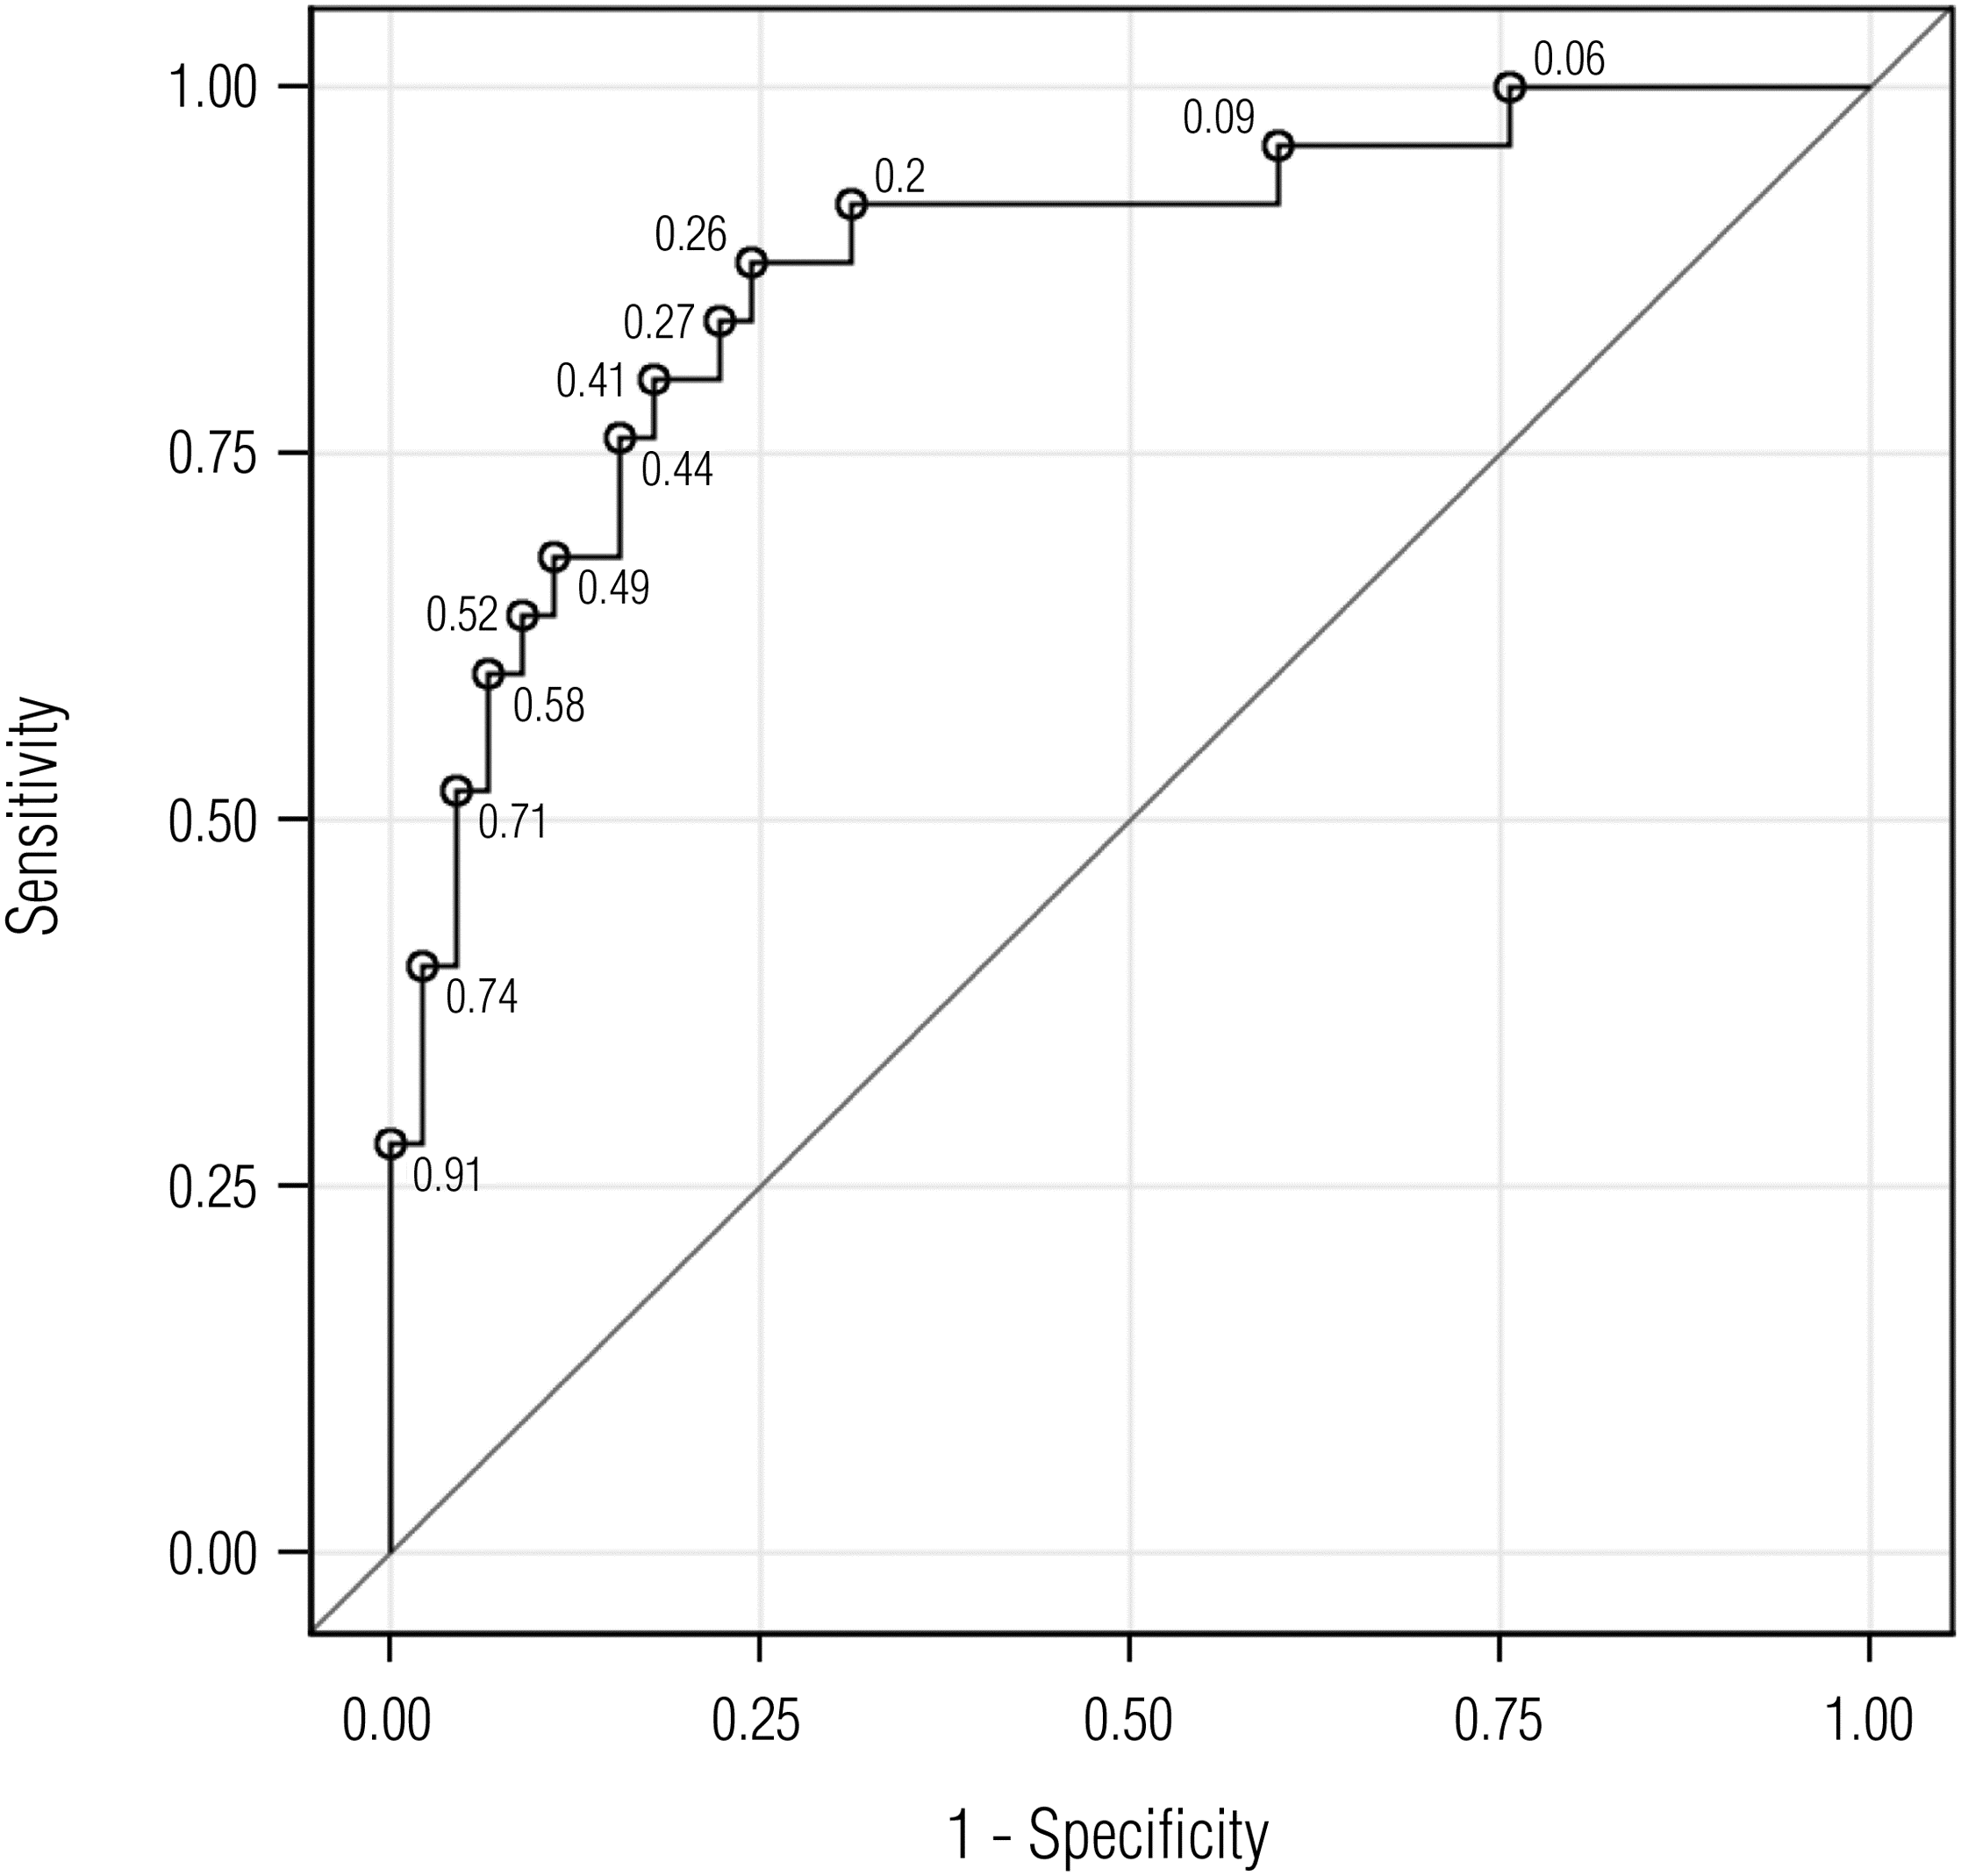
Among the models with good fit, the combination of Trails A and the SMT had the greatest ROC AUC of .87 (Figure 1). Age or driving experience did not influence the model.
A probability of road test failure equation was derived from the following logistic regression equation:

where x′β = −5.9858 + (0.0587 · Trails A) + (0.0532 · SMT) and 
Discussion
The wide age range reflects in part the inner-city demographics of our sample, which entail vascular risk factors (e.g., hypertension, diabetes) that place residents at risk for stroke at a relatively young age. We did not find any gender differences in road test performance in clients with stroke. More than one-third of the drivers with stroke in this study sample failed the road test, a finding compatible with other previously reported studies (Akinwuntan et al., 2006; Radford & Lincoln, 2004).
A combination of screening tests of visuospatial and executive function skills, particularly those pertaining to planning and foresight (SMT) and visual search and attention (Trails A), was able to classify with some degree of accuracy performance on a standardized road test in participants with stroke. Recent reviews have found that similar tests of visuospatial skill, psychomotor speed, and attention are predictive of driving ability in stroke survivors (Devos et al., 2011; Marshall et al., 2007), providing convergent validation for our approach. Furthermore, studies in older adults with cognitive impairment have reported utility for these types of tests (Ott et al., in press) and for both hand-drawn (Snellgrove, 2005) and computerized mazes (Ott et al., 2008; Staplin, Gish, Lococo, Joyce, & Sifrit, 2013). Therefore, further development of such tests is indicated. Trails A and SMT were both highly acceptable to our participants, and together they can be performed in less than 5 min in a clinician’s office.
As has been demonstrated in a separate sample of drivers with dementia (Carr et al., 2011), the logistic regression equation and the appropriate coefficients, intercept, and specific scores on a combination of tests can create a probability of road test failure calculator. The concept of a probability statement of a fail rating on a road test could serve as a practical discussion point for clinicians and clients. For instance, if the scores on the two tests indicate a high probability of failure, as noted by our .70 cutpoint with a high likelihood ratio, the clinician may find it appropriate to counsel the participant and family to consider either driving cessation without spending resources (e.g., time, finances, safety risk) on a CDE or participation in cognitive retraining or simulator practice. Alternatively, if the scores on the two tests indicate a low probability of failure, the clinician might elect to allow the client to continue driving with monitoring over time. Finally, scores indicating an intermediate fail might result in a recommendation for a road test. Given the cost and availability limitations and anxiety inherent in on-road testing, reducing the number of referrals could be of potential benefit to both clients and society.
Additional studies are needed with larger sample sizes and in a variety of settings to validate these results; no test or set of tests has been studied with sufficient rigor to warrant adoption (Bédard, Weaver, Darzins, & Porter, 2008). Although we report on specific cutpoints, more debate is needed on the placement of cutpoints; the level of test uncertainty that is acceptable to clients, families, and professionals; and an acceptable correct classification rate to consider adopting such a test paradigm. It is also interesting that participants referred more than 2 yr after the diagnosis were unlikely to pass the road test. Although the number was small, this finding might indicate that a critical window exists for testing and training clients with stroke.
Limitations and Future Research
This sample was recruited from a university academic center, and many of the referrals were from subspecialty clinics. The participants did not incur any costs for the CDE, likely enhancing recruitment. In addition, the number of participants excluded was relatively high. All of these factors may make generalization of our findings to other driving clinic settings limited. The OT/CDRS who performed the on-road evaluations frequently was not blinded to the participants’ off-road clinical test results because key information was communicated when safety concerns were raised. Thus, although safety was better ensured, this information may have negatively influenced the road test ratings and biased the results toward higher test predictability. In addition, some domains were not studied that may have improved the predictive power of the model (e.g., test anxiety, personality traits, lifelong driving habits).
The off-road clinical assessment and on-road test were performed on the same day, which is often standard procedure in performing CDEs but can result in participant fatigue. Thus, fatigue, which was not measured objectively in this study, could have been a potential confounder. Only 6% (n = 4) of the participants in this sample had a history of living in or adjacent to the zip code that contained our driving course, making it unlikely that route familiarity affected our outcome measure, as noted in other studies (Uc et al., 2009). Last, we did not collect specific information on stroke location from brain imaging or neurological deficits identified by referring physicians. Stroke cohorts are by nature heterogeneous and involve a variety of brain lesions. Future research focusing on these key domains, regardless of the type of test adopted, and on novel tests will likely be needed to improve brain–behavior correlations with driving performance.
Implications for Occupational Therapy Practice and Research
A combination of screening tests of visuospatial and executive function skills, particularly those pertaining to planning and foresight (SMT) and visual search and attention (Trails A, SMT), was able to classify with a modest degree of accuracy performance on a standardized road test in participants with stroke. The screening tests are easy to administer and score. Therefore, this approach may be useful to outpatient and community clinicians in determining whether a driving evaluation is indicated. Appropriate training of staff, time to administer the screens, and reimbursement issues may limit their utility and adoption. Practitioners who address driving safety must use sensitivity in the evaluation process and be prepared to counsel clients and families regarding driving retirement and alternative modes of transportation. The findings have the following additional implications for occupational therapy practice and research:
Brief psychometric screens of visuospatial and executive function may aid in the prediction of impaired driving abilities as assessed by a performance-based on-road test.
Occupational therapy generalist practitioners who practice in driving clinics or who use off-road clinical tests to determine whether to refer a client with stroke for a CDE may consider adopting the Trails A and SMT or similar tests to assist with driving decisions.
Larger sample sizes and testing in additional driving clinic settings are needed to validate these findings.
Footnotes
Acknowledgments
We acknowledge Steven Ice at Independent Drivers, LLC, for providing automobile and instructor expertise in evaluating our participants. This work was supported in part by the Missouri Department of Transportation Division of Highway Safety, the LongerLife Foundation, and National Institute on Aging Grant No. AG16335 (Brian R. Ott, principal investigator) to the Department of Neurology, Warren Alpert Medical School of Brown University, Providence, RI. This article is based on a research paper presented at the Academy of Physical Medicine and Rehabilitation, Seattle, September 2010. Peggy P. Barco received support from the Missouri Department of Transportation, Division of Highway Safety.
Disclosures: David B. Carr has received support over the past 2 years from the National Institutes of Health (NIH), Pfizer, Jannsen, Missouri Department of Transportation–Division of Highway Safety, MedScape, the Traffic Injury Research Foundation, ADEPT Driver, and the American Medical Association. Brian R. Ott has received support from NIH, Jannsen, Pfizer, Baxter, Eli Lilly, and Univita.