





Abstract
Occupational therapists are constantly searching for engaging, high-technology interactive tasks that provide immediate feedback to evaluate and train clients with visual scanning deficits. This study examined the relationship between two tools: the VISION COACH™ interactive light board and the Functional Object Detection© (FOD) Advanced driving simulator scenario. Fifty-four healthy drivers, ages 21–66 yr, were divided into three age groups. Participants performed braking response and visual target (E) detection tasks of the FOD Advanced driving scenario, followed by two sets of three trials using the VISION COACH Full Field 60 task. Results showed no significant effect of age on FOD Advanced performance but a significant effect of age on VISION COACH performance. Correlations showed that participants’ performance on both braking and E detection tasks were significantly positively correlated with performance on the VISION COACH (.37 < r < .40, p < .01). These tools provide new options for therapists.
Visual scanning, which involves both eye movements and fixation, is the primary means by which the central nervous system obtains visual information from the environment. Visual scanning disorders can interfere with the independent performance of many daily activities, such as reading, writing, driving, and self-care (Scheiman, 2011; Warren, 1990). Given the high prevalence of visual deficits in client populations served by occupational therapists (Scheiman, 2011), it is potentially beneficial for occupational therapists to have a variety of engaging tools that offer both evaluation and training of clients with reduced visual scanning ability. Paper-and-pencil assessments and other low-technology techniques for remediation and compensation support rehabilitation for clients with limited functional scanning. By incorporating new technologies as resource tools used in conjunction with standard therapeutic practice, occupational therapists have the ability to provide their clients with a broad range of motivating and engaging tasks that are relevant and appropriate.
The field of medicine has seen a dramatic increase in the number of computer-based assessments, such as the Useful Field of View (e.g., Clay et al., 2005); diagnostic tools (e.g., Shortliffe, 2012); and training tools that range from the relatively inexpensive (e.g., Lange, Flynn, Proffitt, Chang, & Rizzo, 2015) to sophisticated virtual reality simulators for surgical skills training (e.g., Gallagher et al., 2005). A benefit of many of these computer-based tools is that clients can receive immediate results regarding their capabilities and limitations, which may allow them to experience a sense of competence when they see personal improvement.
Tools that measure target detection performance and reaction time related to vision and psychomotor responses have proven utility in occupational therapy practice. Recently published research has presented data supporting the reliability of the VISION COACHTM interactive lightboard (Perceptual Testing, Inc.; San Diego, CA; http://visioncoachtrainer.com) as an evaluation and training apparatus for measuring visual perception and psychomotor skills (Xi et al., 2014). With minimal training needed, occupational therapists may find VISION COACH useful for a range of clinical applications, including physical, cognitive, visual, and fine motor modalities. In addition, driving simulator–generated tasks that measure Functional Object Detection© (FOD; Drive Safety, Inc.; Salt Lake City, UT) and reaction time (Goodenough, Brooks, Crisler, & Logan, 2010; Goodenough, Brooks, Crisler, & Rosopa, 2012) offer occupational therapists supplemental therapy methods that use a DriveSafety CDS driving simulator (see http://www.drivesafety.com). Using the FOD tasks with clients in a driving simulator allows therapists to identify specific deficits in visual scanning ability, inattention, awareness, and physical functioning (i.e., trunk control) while offering a realistic training environment.
When using either of these tools, therapists are able to look at the client’s ability to scan and process dynamic visual information in a controlled environment. Being able to assess this ability allows the occupational therapist to set the parameters for the amount of information being processed, for example, the degree of the visual field being challenged, ranging from central vision only to the inclusion of peripheral information. The therapist can also challenge the client to process more cognitively loaded information while attending to the visual stimuli (e.g., playing a word game along with the task). The ability to control or grade the incoming visual and cognitive information during an on-road driving assessment is nearly impossible; the incoming visual information will be different each time the client is in the natural environment even if the exact same route is taken. On a simulator, however, this information can easily be controlled, replicated, and scored. Thus, having the opportunity to standardize tasks can ensure the exact same information is presented to each client. Successful completion of these tasks can also ensure that a potential driver is ready to tackle the dynamic demands of on-road driving assessments.
The purpose of this study was to examine the performance of three different age groups of healthy, community-dwelling drivers on two new rehabilitation tools: (1) the VISION COACH interactive light board and (2) the FOD Advanced DriveSafety driving simulator scenario. The relationship between these tasks was also investigated. The data presented in this article were part of a larger study, the HFCV Mobile Device and Vehicle Integration Assessment, sponsored by the National Highway Traffic Safety Administration.
Method
Participants
Participants included 54 healthy, community-dwelling drivers between ages 21 and 66 yr (mean [M] = 38.28 yr, standard deviation [SD] = 13.87; 31 men, 23 women). All participants held a valid driver’s license and had a minimum of 1 yr of driving experience. All had corrected visual acuity of at least 20/40 and no self-reported injuries or conditions that affected their vision, legs, or arms. Participants were encouraged not to participate in the study if they had a history of motion sickness (e.g., getting sick when riding as a passenger through the mountains) or were pregnant; no participants experienced simulator sickness in this study. The participants were divided into three different age groups: younger, middle, and older. Twenty-two participants (13 men, 9 women) were in the younger age group (M age = 25 yr, SD = 2, target range = 20–30). Fifteen participants (10 men, 5 women) were in the middle age group (M age = 38 yr, SD = 6, target range = 30–50). Seventeen participants (8 men, 9 women) were in the older age group (M age = 56 yr, SD = 4, target range = 50–70). Participants received compensation for taking part in the study. The Clemson University institutional review board approved the study.
Test Apparatus: Driving Simulator and VISION COACH
Data collection was conducted using a DriveSafety CDS-250 driving simulator, based on a partial cab of a Ford Focus with three displays mounted side by side. For this study, the distance between the participants’ eyes and the center of the middle screen was 112 cm (44 in.). The display provides the participants with a 110° geometric field of view of virtual space that occurs within approximately 65° of physical field of view on the screens (Goodenough, Brooks, Pagano, & Evans, 2012). To gradually adapt to driving in the simulator, participants first completed the Lane Keeping Straight Road driving scenario. Afterward, they completed the FOD Advanced driving scenario, which is based on a simulated driving task first developed by Goodenough et al. (2010). This driving scenario involves driving down a two-lane straight roadway while following a lead vehicle. The participants’ goals were to complete four tasks: (1) maintain a speed of 50 mph; (2) respond to the lead vehicle’s brake lights by tapping and immediately releasing the simulator’s brake pedal; (3) press a finger-switch button when target, high-contrast Es popped onto the screens in varying locations and at random intervals; and (4) stay in the center of the lane. There were also distractor Es that were either upside down or facing the wrong way. The participants were instructed to press the finger switch only for correctly facing target Es. Figure 1 shows all areas where target Es appeared during the scenario as well as the illuminated brake light of the lead vehicle.
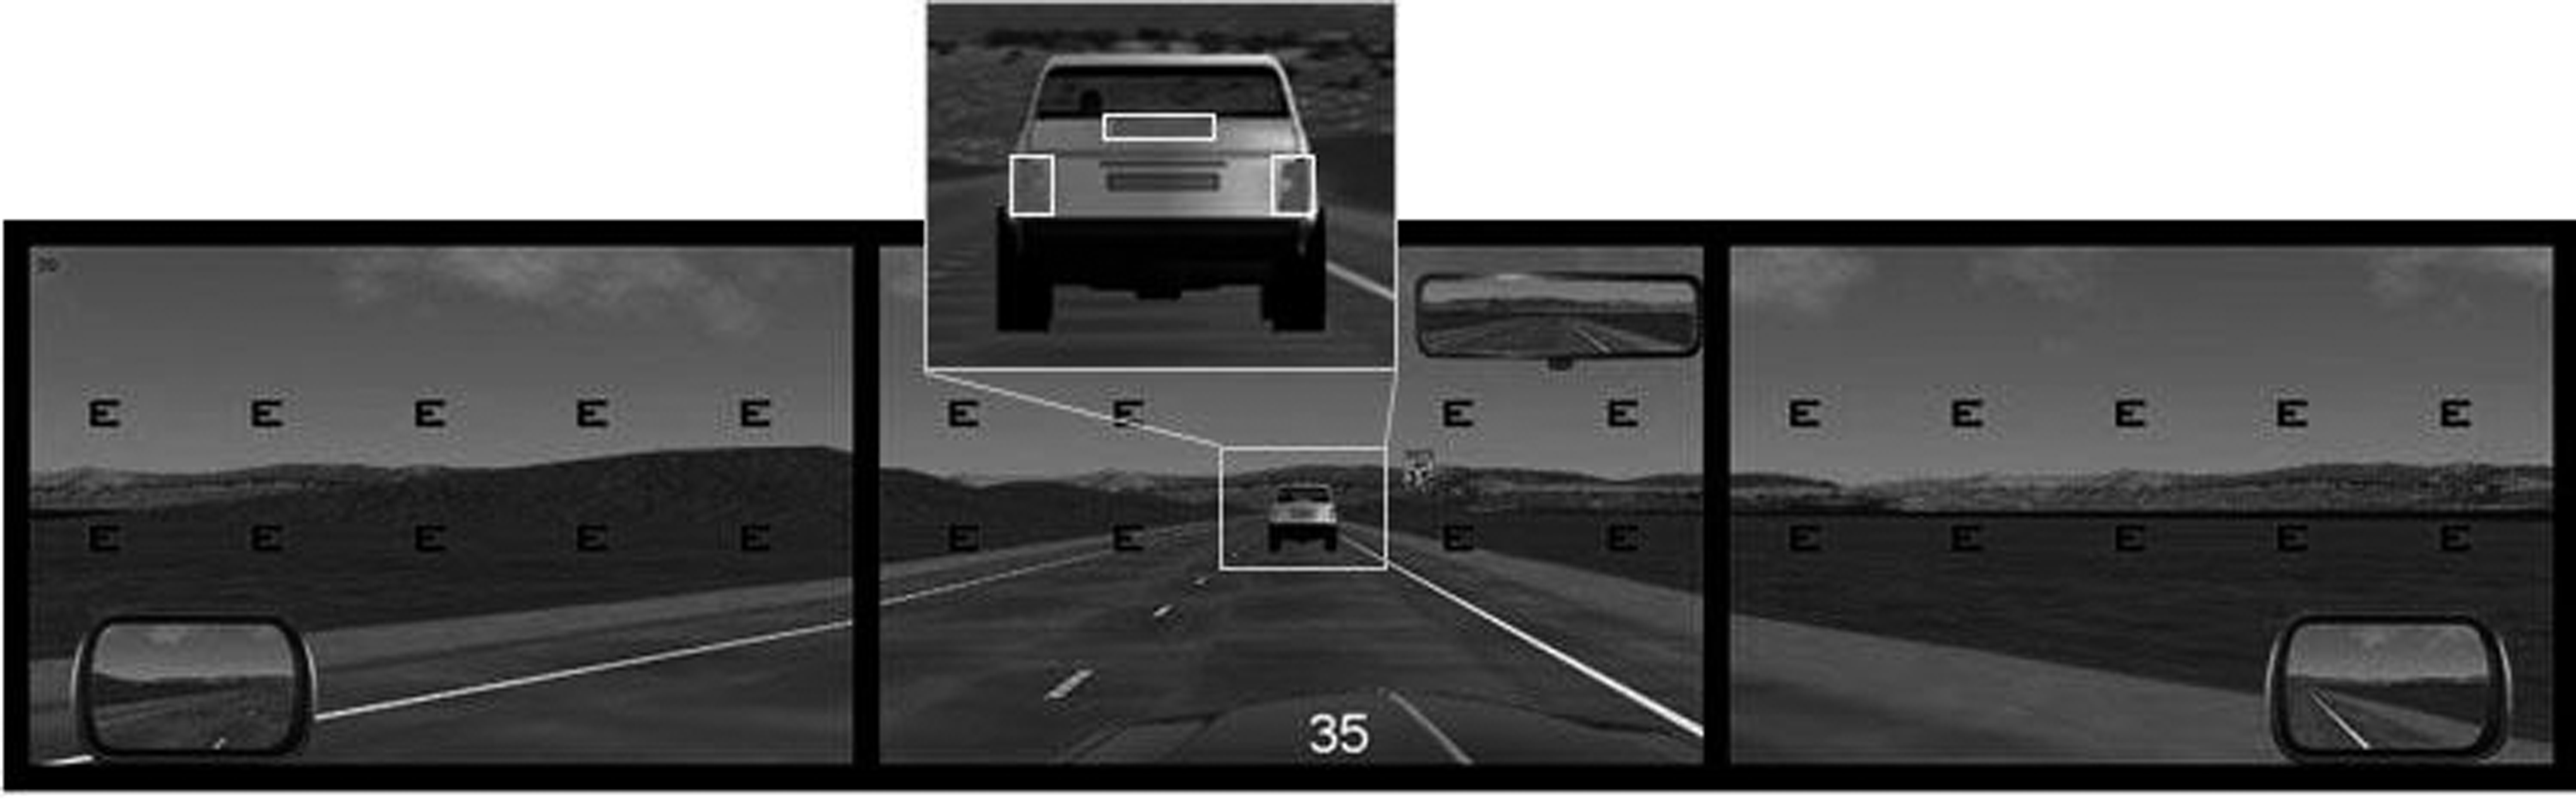
Screenshot of the Functional Object Detection Advanced driving scenario with all locations where the Es may appear.
Participants also completed tasks on the VISION COACH interactive light board. This is a 127- × 86-cm (50- × 34-in.) wall-mounted, black, nonglare board that houses 120 target light dots. With no lights illuminated, the board appears as a flat, matte black surface that provides no visual cues regarding potential target locations. Participants faced the VISION COACH board and responded to each illuminated light by pressing it with a finger as quickly as possible when the light was seen. A fixator light in the center of the screen can be incorporated into a variety of different tasks for various purposes, but in the current study it was used to align the board for each participant. All trials used in the current study were conducted with the Full Field 60 option (speed = 0), in which 60 dots appear one at a time. The presentation of the illuminated lights is random. Each light remained illuminated until the participant depressed the light; at that time, a new light would immediately appear in a different position until all 60 dots had been depressed. The time it takes a participant to successfully respond to a specified number of lights is presented on the top right corner of the board and serves as a common metric to describe performance on VISION COACH tasks.
Procedure
Before the first drive and at the end of each driving task, the participants completed a simulator sickness questionnaire (Brooks et al., 2010). The participants first completed the Lane Keeping Straight Road driving scenario with the following two tasks: (1) drive straight down the roadway with a speed limit of 45 mph while remaining in the lane for 30 s and (2) drive close to and over each lane edge to see what it looks like when the vehicle is near or over the edge lines. After doing this, the participants completed training for the FOD Advanced driving scenario with the tasks described previously. During this training, no simulator data were recorded.
After completion of the background surveys and simulator training, which took approximately 1 hr, the participants exited the simulator to complete the VISION COACH task. The height of the VISION COACH board was first adjusted to the participant’s height using the fixator dot to align the board with the participant’s eyes. The researcher then explained and demonstrated how to use the VISION COACH, and the participants practiced responding to approximately 10 targets. The participants then completed three trials of the Full Field 60 activity.
After the three VISION COACH trials, the participants completed the FOD Advanced drive. This drive was the same as the FOD training simulation. Participants then completed additional driving scenarios for the larger study. Approximately 2.5 hr into the study, the participants then completed three additional trials of the VISION COACH Full Field 60 activity. The VISION COACH activity was used twice as an active break during the larger driving simulator study, which lasted up to 4 hr.
Results
Performance on FOD Advanced and VISION COACH
Table 1 shows the means, standard deviations, and ranges for participants’ performance on all six VISION COACH trials. Table 2 shows the means, standard deviations, and ranges for participants’ performance on the FOD Advanced driving scenario and the third and sixth VISION COACH trials. A one-way analysis of variance (ANOVA) revealed no significant effect of age group on participants’ performance on the FOD Advanced tasks. On the basis of previous research on the reliability of VISION COACH (which used the Full Field 120 lights), only the third trial of each of the two sets of the VISION COACH task (Trials 3 and 6) were included in the data analyses (Xi et al., 2014). In this study, only the last trials of each set of three, Trials 3 and 6, were included in the analyses; the others were considered practice trials. A repeated-measures ANOVA revealed a significant effect of age group, F(2, 51) = 3.59, p ≤ .05, as well as of trial number (3 vs. 6), F(1, 51) = 13.64, p ≤ .01, on VISION COACH performance.
Performance (Reaction Time, in Seconds) by the Three Age Groups on the Six VISION COACH Trials
Note. M = mean; SD = standard deviation.
Performance by the Three Age Groups on the FOD Advanced Driving Scenario and VISION COACH
Note. FOD = Functional Object Detection; M = mean; SD = standard deviation.
Reaction time (in s).
Time to respond to 60 lights.
A Tukey post hoc test showed that participants’ performance decreased from the group of younger participants (M = 48.91 s, SD = 5.95), to the middle group (M = 50.33 s, SD = 7.74), to the group of older participants (M = 54.65 s, SD = 6.85), with the performance difference between the younger and the older group being significant (M difference = 5.74, standard error = 2.18, p ≤ .05). Across all three age groups, participants were faster on Trial 6 (M = 50.28 s, SD = 7.19) of VISION COACH than on Trial 3 (M = 51.94 s, SD = 7.33). Therefore, the two trials, 3 and 6, were not combined into one score but instead were separately included in the data analyses. A one-way ANOVA showed no significant effect of age group on participants’ performance on Trial 3 of the VISION COACH task. A separate one-way ANOVA and follow-up t tests showed a significant difference between the younger and the older age groups regarding performance on Trial 6 of the VISION COACH task, F(2, 53) = 4.17, p ≤ .05. The older group needed significantly more time to respond to the 60 lights (M = 54.12 s, SD = 6.88) than the younger group (M = 47.91 s, SD = 5.90), t(37) = −3.03, p < .01. The mean difference between these two groups was 6.21 s.
Correlation Between Performance on FOD Advanced and on VISION COACH
Pearson correlations were calculated to see how performance on the FOD Advanced scenario and performance on VISION COACH were related to each other. Participants’ performance on the braking task and the E detection task was significantly correlated with performance on both Trials 3 and 6 of the VISION COACH task. Table 3 provides an overview of the correlations and their significance.
Correlations Between Performance on the FOD Advanced Driving Scenario and VISION COACH
Note. Degrees of freedom = 54. All correlations are significant at p ≤ .01. FOD = Functional Object Detection.
Discussion
The purpose of this study was to examine the performance of healthy, community-dwelling participants in three different age groups as well as the relationship between participants’ performance on two tools: the VISION COACH interactive light board and the FOD Advanced driving simulator scenario. Participants performed braking response and E detection tasks as part of the FOD Advanced driving scenario, as well as two sets of three trials using the VISION COACH Full Field 60 task. Only the last trials of each set of three—Trials 3 and 6—were included in the analyses; the others were considered practice trials. Participants’ performance data were analyzed to see whether age had an effect on performance and whether the performance on the two different tools, FOD Advanced and VISION COACH, was correlated.
In addition to the training effect whereby participants performed better on Trial 6 than on Trial 3 of VISION COACH, a significant difference was found between the oldest and the youngest age group’s performance on VISION COACH (overall and on Trial 6). The mean difference between these two groups was 6.21 s, with the older age group needing a mean of 54.12 s (SD = 6.88) to respond to the 60 lights. This is consistent with an earlier study in which Xi et al. (2014) demonstrated that older participants’ performance was slower than younger participants’ performance. It also indicates that an increase in age corresponds with a significantly slower reaction time, which is likely to be exacerbated when fatigue may be involved. In Xi et al.’s earlier study, the participants completed only the VISION COACH tasks, whereas the current study was part of a larger study sponsored by the National Highway Traffic Safety Administration and included a relatively long and mentally demanding driving component, which was outside of the scope of the current study. This study included only healthy, community-based participants. As age, along with age-related visual deficits, increases, reaction times likely increase as well.
When we compared the groups’ performances on VISION COACH Trials 3 and 6 and the braking and E detection tasks of the FOD Advanced driving scenario, we found a significant positive correlation; therefore, these two instruments may be used to measure similar constructs. Therapists often comment on the need to have a diverse tool kit at their disposal. The tasks described in this article appear to have clinical utility as dynamic and engaging methods to address not only reaction times but also visual–perceptual deficits, including scanning, inattention, and awareness.
As the field of occupational therapy progresses, the implementation of new technologies will become more widespread (Breines & Pellerito, 2003). Clients often enjoy using equipment in clinical settings that is not available for home therapy exercises. Occupational therapy clinicians will need to carefully choose simulators and protocols that are designed for clinical settings and that minimize immersion and simulator sickness (Brooks et al., 2010; Classen, Brooks, National Highway Traffic Safety Administration, & American Occupational Therapy Association, 2014). The versatility that such instruments provide in therapy sessions allows interaction and engagement that deliver concrete, immediate, and printable feedback after each session, encouraging clients as they observe self-progress throughout daily or weekly therapy. This feedback is also useful for documentation (billing) purposes. In addition, both of the tools described in this study are highly customizable, which allows occupational therapy practitioners to modify tasks for each client’s treatment needs.
When considering these tools for use in the clinical practice environment, it is important to consider both the advantages and the potential obstacles. For some clinics, the cost can be prohibitive, including payment for the device, the non–revenue-generating time associated with training, space requirements, and information technology support, as well as upgrades or system support. On the positive side, a generalist occupational therapist may find the combination of these two tools useful for a wide cross-section of diagnoses and easily adaptable to clients’ skills and abilities. The time required to combine the two can vary, ranging from around 15 min each to an entire treatment session. Both tools can efficiently address functional deficits and can influence functional improvements across the spectrum of activities of daily living. An occupational therapist who addresses driving can use both tools to assess difficulties in visual and cognitive processing that can be generalized to the client’s on-the-road capability. The tools can also be used to prepare potential drivers for future on-road demands.
Although this study included only a small, healthy, community-based sample, future studies should examine clinical populations, such as clients with peripheral field deficits, who use multiple, customizable features of both tools. Future studies should include participants with a range of educational levels and should counterbalance task order.
Implications for Occupational Therapy Practice
The current study examined the relationship between VISION COACH interactive light board tasks and FOD Advanced driving simulator scenario tasks as efficient clinical screening tools for occupational therapists to evaluate and train clients with visual scanning deficits. The results of this study have the following implications for occupational therapy practice:
Use of interactive tools such as the ones in this study can enhance and add to the occupational therapist’s tool box.
Highly customizable, interactive tools that deliver immediate and printable feedback can be used to address functional deficits and can have an impact on functional impairments in instrumental activities of daily living, such as driving readiness.
Additional research is necessary to examine people with specific diagnoses using these tasks.
Footnotes
Acknowledgments
We thank the National Highway Traffic Safety Administration of the Department of Transportation for sponsoring the larger study, HFCV Mobile Device and Vehicle Integration Assessment, which included the data presented in this article. The study was registered at  (NCT02713503). VISION COACH provided the interactive light board for the research team’s use.