





Abstract
Evidence-based health care delivery requires availability and use of brief, cost-effective, time-efficient, client-centered, and psychometrically sound outcome measures. Although such outcome measures are recognized as important, psychometric development of such measures is underreported (American Occupational Therapy Association [AOTA], 2007). A review of the psychometric evaluation of 35 instruments published in the American Journal of Occupational Therapy highlighted the need for increased publication of instrument development studies to guide interventions and evaluate their effectiveness (Brown & Bourke-Taylor, 2014). The development of accurate and reliable measurement tools is instrumental to measuring change and justifying the efficacy of interventions.
The Health Promoting Activities Scale (HPAS) is a short, 8-item self-rated instrument that purports to measure the frequency with which adults participate in activities that may be beneficial for their health (Bourke-Taylor, Howie, Law, & Pallant, 2012; Bourke-Taylor, Lalor, Farnworth, & Pallant, 2014). The HPAS was initially developed and evaluated with mothers, although the tool is generic and may be applicable to other adults pending psychometric evaluation, extending the tool’s validity. Previous psychometric evaluation of the HPAS has shown acceptable internal consistency (Cronbach’s α = .78; Bourke-Taylor, Law, Howie, & Pallant, 2013).
The HPAS format includes eight broad categories of participation in potentially health-promoting activities. When respondents complete the tool, they use a key to identify the purpose and classification of their chosen activity. For example, for Item 2, a physically active recreational pursuit that you do alone, the key lists walking, jogging, and going to the gym, and for Item 8, a quiet, physically inactive leisure pursuit that you do with others, the key lists celebrating cultural occasions, meeting a friend for coffee or lunch, and playing cards or other games socially (for further details, see Bourke-Taylor, Howie, et al., 2012).
The HPAS has a 7-point response scale measuring self-reported frequency of participation from 7 (once or more every day) to 1 (never). The scores from each category are added for a total score. The potential range of total scores is 8 to 56, with higher scores indicating more frequent participation. Studies have demonstrated differences in HPAS scores among mothers of varied body mass index (BMI), sleep quality, and subjective mental and general health, demonstrating previously established construct and content validity (Bourke-Taylor, Howie, et al., 2012; Bourke-Taylor et al., 2013, 2014).
Development of the HPAS to date has been completed with mothers of children with and without disabilities. The HPAS provides a way for mothers to estimate current and desired participation and permits measurement of change. Participation in health-promoting activity varies from one mother to the next. Health-promoting activity may include active or inactive pursuits, alone or with others, or social or spiritual activities.
Self-rating of one’s own health status is widely used in health research (Eriksson, Undén, & Elofsson, 2001). Health professionals have also used self-rating for leisure assessments, such as the Interest Checklist (Matsutsuyu, 1969). The HPAS uses a self-rating response set to measure respondents’ estimates of the frequency of their participation in leisure and healthy activities. The measurement of participation in meaningful activities is inherently difficult because meaningful and enjoyable activities vary from person to person (Law, 2002). When the HPAS was designed, the authors’ categorization of activities was based on the presence or absence of physical activity, interaction with other people, and spirituality, in line with occupational therapy theory (Bourke-Taylor et al., 2013).
Core assumptions underlying the development of the HPAS are that people seek engagement in meaningful and culturally significant occupations and that engagement in occupation has a profound impact on health and well-being (AOTA, 2015). Reduced participation can have a potentially negative effect on health and well-being (Polatajko et al., 2007). People often describe good health as the ability to do things for themselves and others independently and competently (Hocking, 2009), supporting the close link between engagement in meaningful everyday occupation and health and well-being. In relation to mothers who care for a child with a disability, care responsibilities may reduce the frequency with which mothers participate in meaningful activities that would support their health (Bourke-Taylor, Howie, & Law, 2010). Past research has demonstrated that although other factors, such as additional caring responsibilities, paid work, and sleep interruption, have an impact on maternal mental health, the most significant predictor was participation in health-promoting activities, which can be measured by the HPAS (Bourke-Taylor, Pallant, Law, & Howie, 2012).
Measurable increase in participation in healthy activities is predicted to have positive effects on maternal health (Bourke-Taylor et al., 2013). Other potential benefits include increased self-perception of mothers’ competence in the parenting role (Graham, Rodger, & Ziviani, 2013), improved quality of life, and better ability to participate in goals such as working for pay or interacting with family members and others. Because increased participation and engagement in potentially health-promoting activities are outcomes of interventions that promote health and well-being, professionals delivering such services have a responsibility to ensure that they provide the most appropriate therapeutic interventions to their clients to increase their participation or performance.
To determine which interventions are effective, it is necessary to be able to measure change or improvement in these areas (AOTA, 2015; Hilton, Goloff, Altaras, & Josman, 2013). The effectiveness of interventions can be measured using psychometrically sound tools with substantiated reliability and validity (Polgar, 2009) and with sensitivity to clinically significant change (Mokkink et al., 2010). Evaluating the reliability and validity of a tool is a continuous process, because results influence the clinical and research utility of the tool. Reliability describes a tool’s consistency over time and between users. A tool also needs to be valid, which means that the content of the instrument reflects the theory of the construct that it is measuring and that the test items are related to each other (Streiner & Norman, 2008).
To be used as an outcome measure, a tool must undergo vigorous evaluation of its reliability, validity, stability, and sensitivity to change. Further development of the HPAS requires continued evaluation of its internal consistency and construct validity with different populations, determination of the stability of the instrument over time (i.e., intrarater reliability because the HPAS is a self-rated tool), and calculation of measurement error to determine the minimum detectable change (MDC) between two points in time. Construct validity may be measured in various ways, including investigation of whether scores differ significantly in an expected pattern between known groups. The research aims of the study described in this article were as follows:
• To assess the internal consistency of the HPAS as represented by an acceptable Cronbach’s α;
• To assess the construct validity of the HPAS by assessing differences between median HPAS scores for groups of participants categorized on the basis of aspects of self-reported mental and physical health;
• To investigate the intrarater reliability of the HPAS, including agreement between aggregate and individual HPAS items at Time 1 and Time 2; and
• To calculate the measurement error and minimum detectable change.
Method
This study had a cross-sectional design using an online questionnaire in Qualtrics (Qualtrics, Provo, UT) to collect data. A follow-up questionnaire was readministered at 1 wk. This project received approval from the Australian Catholic University Human Ethics Committee.
Participants
Recruitment occurred over 7 mo. To meet the inclusion criteria, potential participants had to be the mother of a school-age child; a resident of the state of Victoria, Australia; and able to complete questionnaires in English and to have access to the Internet to complete the online questionnaire. Potential participants were recruited through social media and posters placed in various public places. Researchers emailed acquaintances who met the participation criteria with a description of the study. In addition, snowball sampling enabled friends and acquaintances of participants also to participate in the study; the information letter provided to participants included a request that they share the researcher’s contact details with other potential participants.
All participants expressing interest in participation met the inclusion criteria and were provided with the link to the initial questionnaire. The estimated initial questionnaire completion rate was 81.2% (N = 56) from 69 expressions of interest. The completion rate of the follow-up questionnaire was 78.6% (N = 44).
Instruments
A specifically designed questionnaire was used to collect data for this study. The questionnaire included demographic data (Table 1) and three instruments: (1) the HPAS (Bourke-Taylor, Howie, et al., 2012), (2) the Depression Anxiety Stress Scales (DASS–21; Lovibond & Lovibond, 1995), and (3) the International Physical Activity Questionnaire (IPAQ; Fogelholm et al., 2006). The questionnaire included self-reported height and weight, from which BMI was calculated. BMI scores were categorized as underweight, normal weight, overweight, and obese using the World Health Organization (2015) cutoff points to provide information about the participants’ physical health.
Participant Characteristics (N = 56)
Note. Percentages may not total 100 because of rounding. BMI = body mass index; IPAQ = International Physical Activity Questionnaire.
The DASS–21 gathers self-reported symptoms associated with depression, anxiety, and stress over the past week. Research has indicated acceptable reliability and validity (Lovibond & Lovibond, 1995). Participants self-reported their mental health status using a 4-point Likert scale ranging from 0 (did not apply to me at all ) to 3 (applied to me very much or most of the time). Each scale (Depression, Anxiety, and Stress) has cutoff points indicating normal, mild, moderate, and severe symptoms. Lovibond and Lovibond (1995) found Cronbach’s αs of .91 for Depression, .84 for Anxiety, and .90 for Stress, demonstrating acceptable internal reliability. The DASS–21 was found to be a consistent measure of the dimensions of depression, anxiety, and stress and also of the more general concept of psychological distress (Henry & Crawford, 2005). The DASS was also found to be clinically useful in predicting anxiety disorder and depression (Nieuwenhuijsen, de Boer, Verbeek, Blonk, & van Dijk, 2003).
The IPAQ is a self-report questionnaire used to categorize daily physical activity participation. It is widely used internationally to measure data about physical activity participation and has acceptable reliability and validity (Fogelholm et al., 2006). The IPAQ correlates with similar questionnaires, supporting its construct validity, and has a good intraclass correlation coefficient (ICC) of .83 (Arends et al., 2014). Respondents are allocated to one of three groups on the basis of IPAQ score: inactivity, minimal activity, and health-enhancing physical activity (HEPA).
Statistical Analyses
Analyses were conducted using IBM SPSS Statistics (Version 22; IBM Corporation, Armonk, NY). Descriptive statistics were generated for all demographic variables, BMI, and IPAQ scores. Nonparametric tests were used throughout because the data were not normally distributed on some scales. The internal consistency of the HPAS was assessed using Cronbach’s α coefficient (Cronbach, 1951).
Participants were assigned to three groups on the basis of DASS–21, BMI, and IPAQ scores. The Kruskall–Wallis test was used to detect differences in median HPAS score among these three groups. When the difference was statistically significant, post hoc analysis was completed using a Mann–Whitney U test to detect the effect size of pairs of groups.
Intrarater reliability was evaluated from Time 1 to Time 2 using ICCs. Relative reliability was measured using a two-way, mixed, absolute-agreement ICC to measure the amount of variance attributable to the true variance between aggregate scores for Time 1 and Time 2 (Barton & Peat, 2014). We expected that scores on the HPAS, which reflect self-ratings on two occasions without any intervention or deterioration in health, would be stable and similar across times (Barton & Peat, 2014); therefore, we expected the ICC to be close to 1. We used the following cutoff points to interpret ICC scores: almost perfect, >.80; excellent, >.75; good, >.60; and moderate, >.40 (Streiner, Norman, & Cairney, 2014).
To evaluate the absolute agreement of the scores, we investigated the amount of error between each participant’s scores at Time 1 and Time 2. A Bland–Altman plot was constructed to show the distribution of the differences versus means between scores at Time 1 and Time 2 (Bland & Altman, 1986). Agreement between HPAS scores for Time 1 and Time 2 was assessed using measurement error, error range, and limits of agreement. The measurement error was calculated from the standard deviation (SD) of the differences between the two scores from each participant (SD of differences divided by √2). The measurement error was also converted to an error range to show the range in which the actual score lies for each individual measurement (Barton & Peat, 2014). The MDC was also calculated (MDC 95% confidence interval = standard error of measurement × 1.96 × √2) to show the smallest change in HPAS score that exceeds the measurement error (Haley & Fragala-Pinkham, 2006).
Results
Demographic information about the sample (N = 56) is provided in Table 1. The majority of participants were age 41–50 yr (57.1%), were partnered (83.9%), had attained an undergraduate degree or higher (58.9%), and worked part time or casually (42.9%). Most families had two (n = 26, 46.4%) or three children (n = 17, 30.4%), with one (n = 19, 33.9%) or two (n = 25, 44.6%) children of school age. Mothers were relatively evenly distributed among the BMI categories of within normal range (n = 19, 33.9%), overweight (n = 18, 32.1%), and obese (n = 16, 28.6%).
Cronbach’s α for the HPAS was .73. Differences between groups of women for physical activity, DASS–21 scores, and BMI revealed one significant finding, as shown in Table 2. A Kruskal–Wallis test revealed a significant difference in median aggregate HPAS score across the three categories of physical activity participation. Further, the effect size of r = .40 can be categorized as medium to large using the Cohen (1988) criteria (small, >.10; medium, >.30; large, >.50). No significant differences in HPAS scores were found among participants grouped according to DASS–21 or BMI categorization (see Table 2).
Median Scores on the Health Promoting Activities Scale, by DASS–21, IPAQ, and BMI Category (N = 56)
Note. BMI = body mass index; DASS–21 = Depression Anxiety Stress Scales; HEPA = health-enhancing physical activity; IPAQ = International Physical Activity Questionnaire.
ICCs were calculated to demonstrate the relative reliability between scores for each of the individual HPAS items at Time 1 and Time 2, as shown in Table 3. The ICC for the aggregate HPAS scores at Time 1 and Time 2 was .90, meaning that 10% of the variation was attributable to variation among participants and 90% to variation within participants. The mean difference in variation between aggregate HPAS scores at Time 1 and Time 2 was 0.32 (SD = 3.59). The limits of agreement ranged from −6.7 to 7.4, the measurement error was 2.54, the error range was 4.97, and the MDC was 5.00. The Bland–Altman plot showed an even distribution, which indicates that the amount of variability did not appear to change on the basis of a higher or lower HPAS score (see Figure 1).
Frequency of Participants’ Health-Promoting Leisure Activities (N = 56) and ICCs of Comparisons of HPAS Responses at Time 1 and Time 2 (N = 44)
Note. HPAS = Health Promoting Activities Scale; ICC = intraclass correlation coefficient.
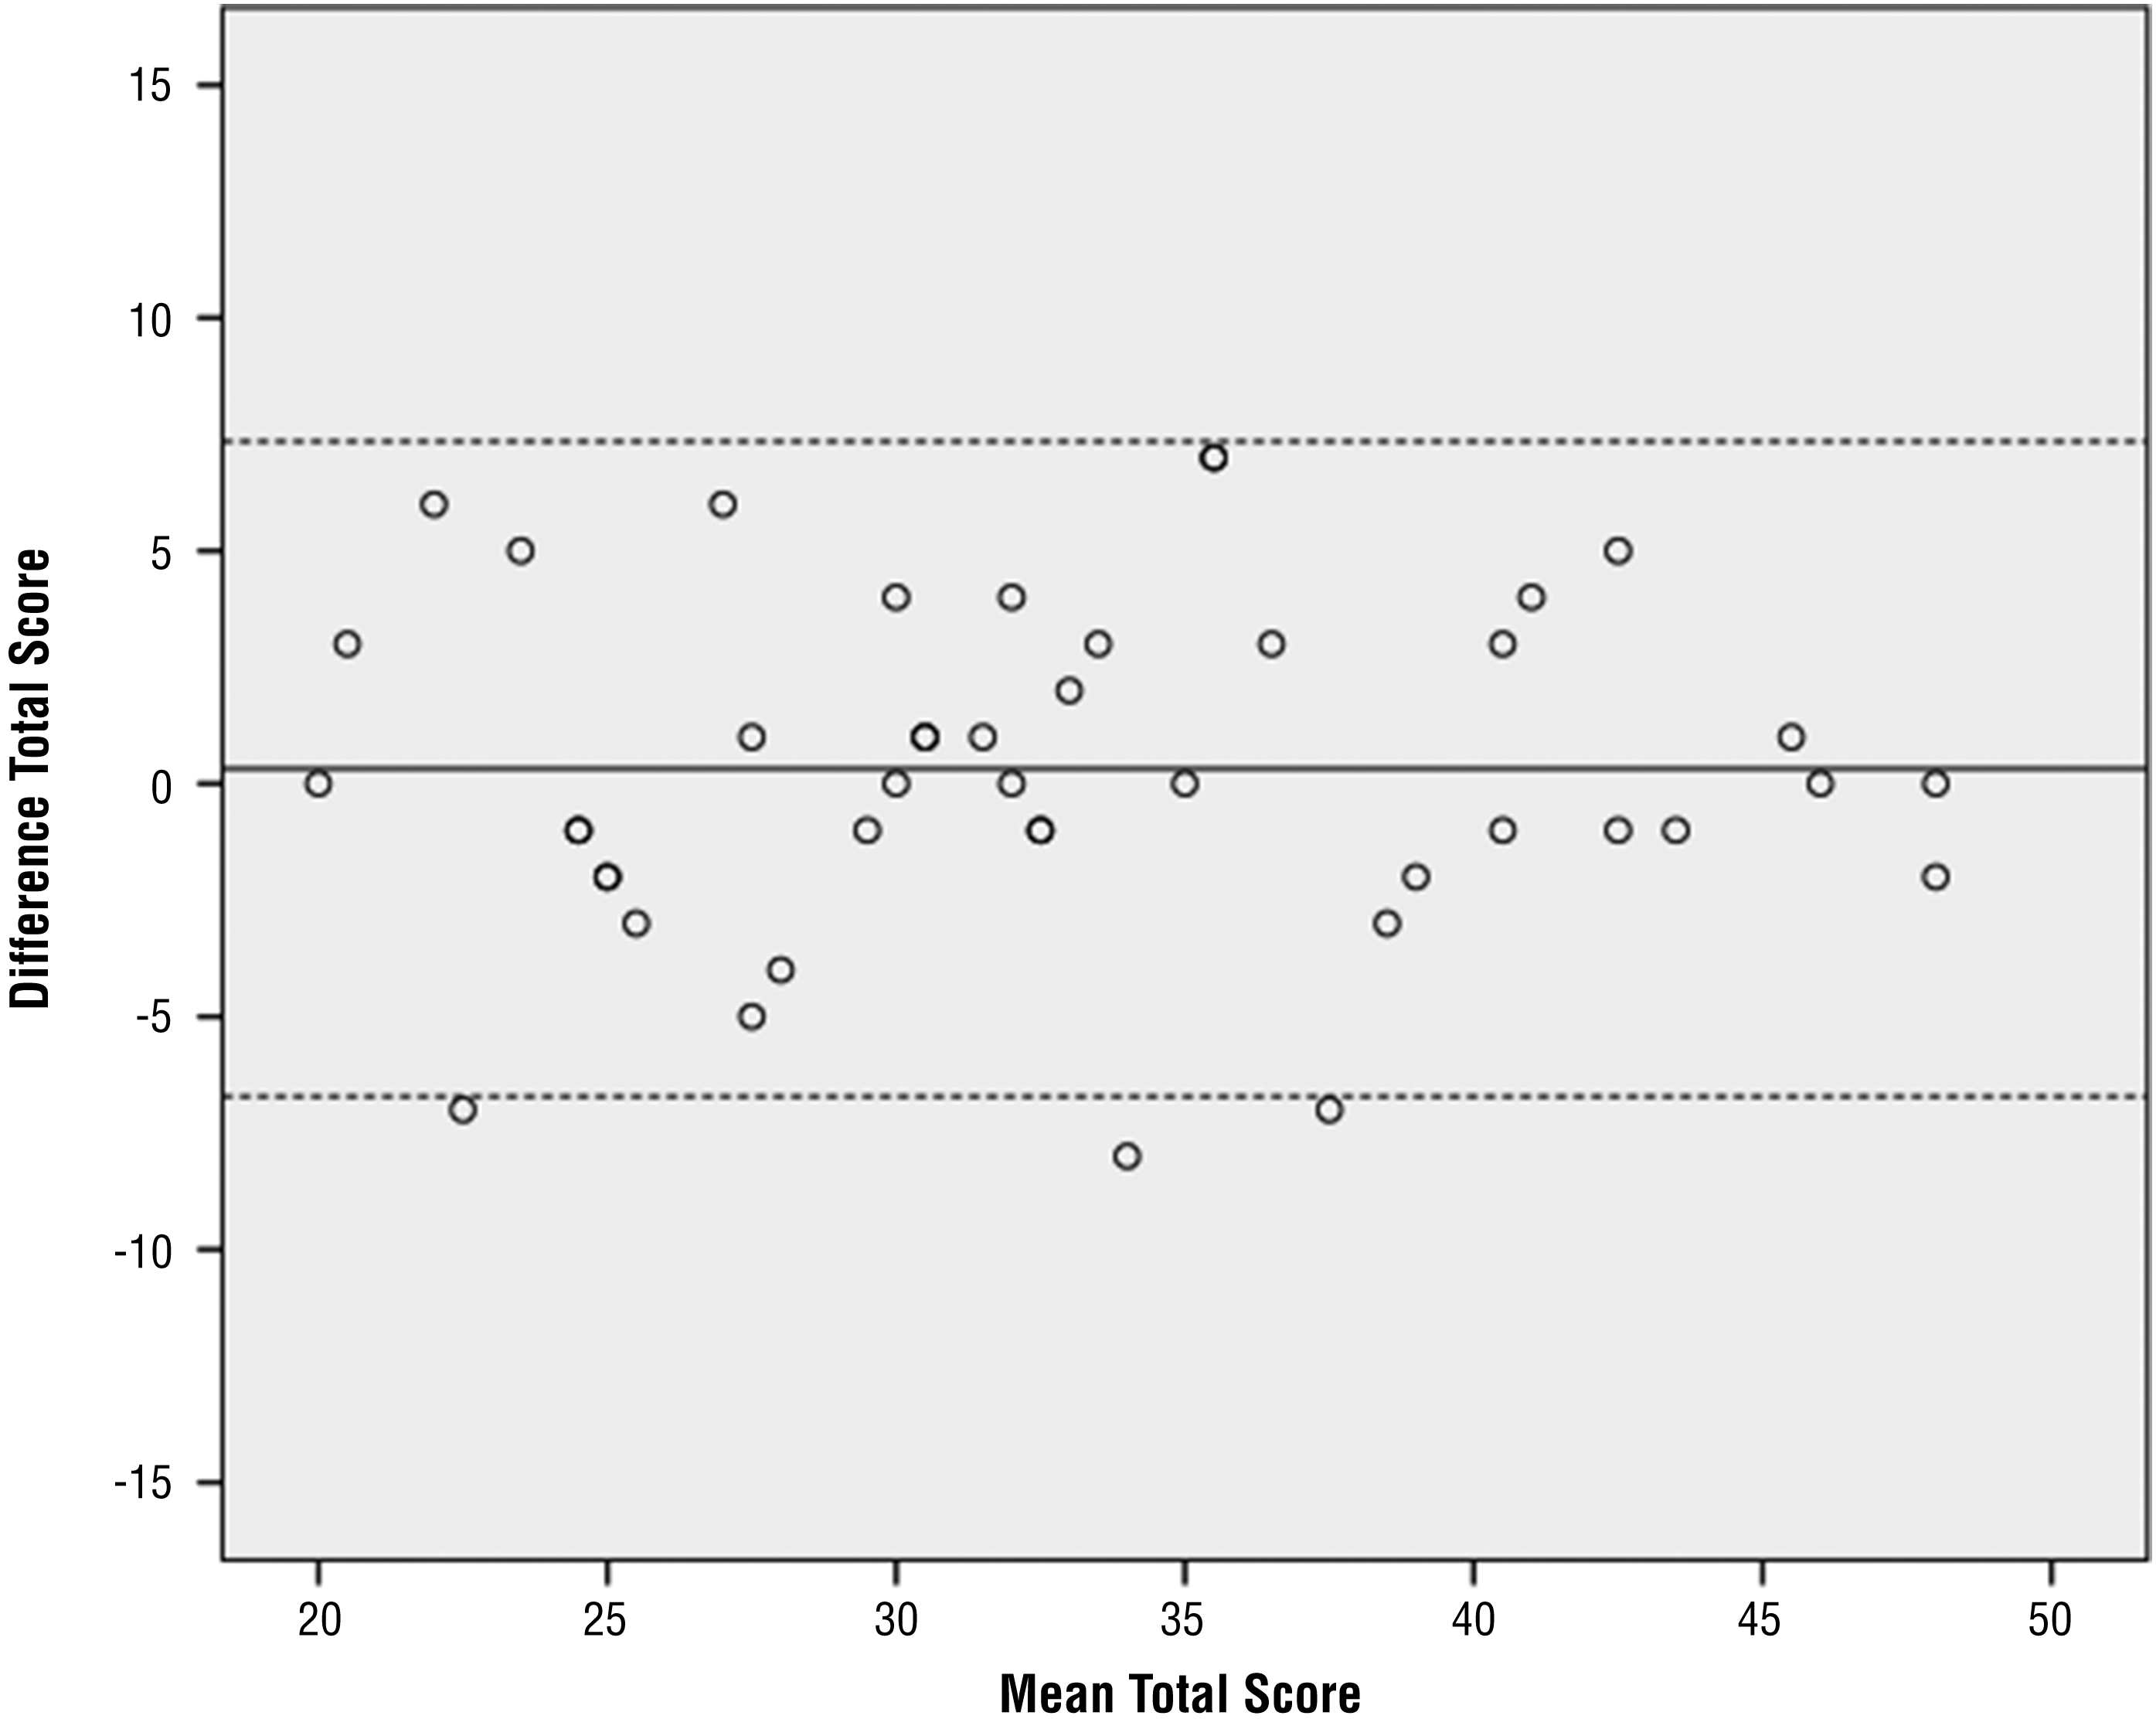
Bland–Altman plot of the distribution of differences versus means between total Health Promoting Activities Scale scores for Time 1 and Time 2.
Discussion
This study evaluated the internal reliability, construct validity, stability over time, measurement error, and minimum detectable change of the HPAS with a sample of mothers of school-age children. Cronbach’s α of .73 for the HPAS scores demonstrates acceptable internal consistency, similar to the previously reported Cronbach’s α of .78 (Bourke-Taylor et al., 2013).
The construct validity of the HPAS was assessed by determining whether the participants reported differences in the frequency with which they participated in health-related activities on the basis of self-reported mental health, BMI, and physical activity levels. The only statistically significant findings in this study were differences between groups based on physical activity levels (i.e., HPAS scores significantly varied between women who reported inactivity and those who reported health-enhancing physical activity); the medium to large effect size further demonstrates this difference between groups based on physical activity participation. Therefore, the study supported construct validation of the HPAS, suggesting that the HPAS does differentiate between women with a school-age child on the basis of reported physical activity level. This is a new finding; no previous research has demonstrated that the HPAS is sensitive to differences in healthy physical activity levels.
Although this study did not find any significant differences based on mental health, previous research has reported a moderate correlation between subjective mental and physical health in mothers (N = 152; Bourke-Taylor et al., 2013). The current study had a smaller sample size, and groups of participants according to mental health symptoms were too small for decisive findings. Future research should include larger sample sizes.
Several studies with larger sample sizes found differences in leisure activity participation among groups of mothers reporting differences in self-reported mental health (N = 263; Bourke-Taylor et al., 2013). The current study found no statistically significant difference in HPAS scores between groups based on BMI. This finding differs from that of previous research with a larger sample of 263 Australian women, which found that participants who were obese recorded significantly lower HPAS scores than those who were not obese (Bourke-Taylor et al., 2014).
The intrarater reliability (ICC) for the aggregate HPAS scores at Time 1 and Time 2 demonstrated that there was little variability between the scores and that approximately 90% of the variation was attributable to differences in scores between participants rather than differences in scores for each participant. The ICC of .90 indicates excellent agreement (Streiner et al., 2014), demonstrating that the HPAS scores were stable over time.
The ICCs of individual HPAS items were also evaluated. Some HPAS items had ICCs indicating good to almost perfect agreement (Streiner et al., 2014). A key factor influencing the range in ICC scores across HPAS items appeared to be whether the activity was completed alone or with others. For instance, the higher ICC of Item 4 (spiritual or rejuvenating personal time) could be attributed to this activity being less dependent on other people (external factors) compared with other HPAS items, such as Item 8 (a quiet, physically inactive leisure pursuit that you do with others), which had a lower ICC and involves participation that is more dependent on the availability of peers.
Further evaluation of the intrarater reliability of the HPAS involved calculating the error range and the MDC. The error range, 4.97, is the range in which the true score lies for any HPAS total score, meaning that a difference of >5 in aggregate HPAS score can be considered outside the error range and therefore a change that is not attributable to error. This is a new finding; previous psychometric evaluation of the HPAS did not investigate its intrarater reliability. The finding of an MDC of 5 indicates potential for further evaluation because, for the HPAS, which has a minimum possible aggregate score of 8 and a maximum of 56, 5 is small enough to be realistic as a minimum change in score. A change of 5 in total score would indicate real change and would involve increased participation in a category of activity by one point (e.g., from 1×/wk to 2–3×/wk) in five of the eight categories. In practical terms, this is an achievable change in score and would demonstrate a change in participation. Future research might examine real-life change for participants through qualitative interview or other means to determine the extent of clinically relevant change.
The Bland–Altman plot (see Figure 1) demonstrates that the amount of error in HPAS score does not increase or decrease with HPAS score, and a lower score demonstrates as much error as a higher score. This consistent error shows that there appears to be no floor or ceiling effect. Future studies might include a larger sample size or apply the scale to a different population sample to examine generalizability of these findings.
This study assessed stability over time; further research might extend this study with a larger population or by investigating the HPAS’s sensitivity to change over time. It would be useful to examine changes in HPAS scores before and after interventions aimed at increasing participation in physical activity or wellness activities. We expect that substantial improvement in mental health and physical well-being will correlate with an increase in HPAS score. Further research is needed to determine a clinically relevant change in HPAS score, which would reflect a meaningful change in participation in potentially health-promoting activities. Further research might also validate the HPAS with other types of adults, such as older women, men, and people with disabilities or chronic medical conditions. The generic items and design of the HPAS might be useful to measure change in participation in healthy activities in other populations.
Implications for Occupational Therapy Practice
The results of this study have the following implications for occupational therapy practice:
• The HPAS measures self-reported participation in self-care and leisure occupations associated with health.
• The HPAS was able to differentiate between groups of women on the basis of their physical activity levels.
• The HPAS demonstrated excellent test–retest reliability with an ICC of .90, measurement error of 2.54, error range of 4.97, and MDC of 5.00.
• The HPAS is a stable instrument; changes in total scores greater than 5 points constitute significant change, supporting use of the HPAS as an outcome instrument.
• Occupational therapists working with clients to improve participation in healthy occupation may select the HPAS as a client-centered, succinct, goal setting, and change measurement tool.
Conclusion
The HPAS was developed by occupational therapists for occupational therapy practitioners to use as an outcome measure to determine change in participation in healthy activities. However, the HPAS has wider application and may be used by any clinician or program evaluator for interventions aiming to increase healthy behaviors and wellness through engagement in activities. This study extends the psychometric support for the HPAS as a reliable, stable instrument for use in measuring participation in potentially healthy activities. This research contributes to an important though still limited range of outcome measures for interventions that aim to increase health through participation in activity.
Footnotes
Acknowledgments
This study was completed as part of an occupational therapy honors degree at Australian Catholic University.