





Abstract
In outpatient settings, occupational therapy can be vital for patients to avoid hospitalization and decrease long-term disability (Clark et al., 1997; Karjalainen et al., 2003; Neuhaus, 1988; Patti et al., 2002; Rogers, Bai, Lavin, & Anderson, 2016; Steultjens, Dekker, Bouter, Schaardenburg, et al., 2004; Werner & Kessler, 1996; Wilkins, Jung, Wishart, Edwards, & Norton, 2003). Both occupational and physical therapy strive to decrease morbidity, improve quality of life, and provide evidence-based interventions to improve functional status of and outcomes for people with disabilities associated with common conditions of aging—stroke, low back pain, and osteoarthritis (Clark et al., 1997; Fransen, Crosbie, & Edmonds, 2001; Karjalainen et al., 2003; Patti et al., 2002). Increased awareness of the role of occupational therapy has spurred research into its use and effectiveness in the postacute setting (Chen, Kane, & Finch, 2000–2001; Freburger, Heatwole Shank, Knauer, & Montmeny, 2012; Freburger, Holmes, & Ku, 2012; Freburger et al., 2011a, 2011b; Holmes, Freburger, & Ku, 2012; Huang, Zhang, Culler, & Kutner, 2008; Huckfeldt, Sood, Romley, Malchiodi, & Escarce, 2013; Ottenbacher & Graham, 2007; Wood, McCrea, Wood, & Merriman, 1999; Young et al., 2007), but few studies have examined the cost of outpatient occupational therapy care in general and for the uninsured patient population in particular (Pendergast, Kliethermes, Freburger, & Duffy, 2012).
Researchers have examined the cost-effectiveness of occupational therapy services in randomized controlled trials. In these trials, they have found occupational therapy to be cost-effective with adults with stroke or dementia, in reducing falls, and when provided as a preventive service (Godwin, Wasserman, & Ostwald, 2011; Graff et al., 2008; Hay et al., 2002; Steultjens, Dekker, Bouter, Jellema, et al., 2004). Most population-based research has focused on postacute care, hospital readmission, or geographic variation in outcomes related to inpatient rehabilitation services (Galloway et al., 2016; Reistetter et al., 2015).
Calls for understanding the cost of care in broader terms are found throughout the literature. Neuhaus (1988) called for “considerable attention” to the ethical ramifications of the cost of health care, asking, “Who is to pay for costs incurred, and what regulator guidelines are necessary?” (p. 292). More recently, Voigt-Radloff, Ruf, Vogel, van Nes, and Hüll (2015) stated that evaluation of costs, especially for older adults, was slim. Most of what is known about the cost of occupational therapy is the burden of cost to the health care system at large (Godwin et al., 2011; Huang et al., 2008; Zorowitz, Chen, Tong, & Laouri, 2009) and from the insurer’s perspective. The majority of the cost of outpatient care, at least for adults with stroke, is for rehabilitation (Godwin et al., 2011). Although the initial cost of occupational therapy may be high and a potential barrier to receiving services, these treatments ultimately prove cost-effective by decreasing disability and improving quality of life in the long term.
Unfortunately, many patients who would benefit from outpatient occupational therapy services do not receive them (Landry et al., 2006; Pergolotti, Deal, Lavery, Reeve, & Muss, 2015). Nearly one in three adults with stroke who were discharged from inpatient acute rehabilitation and recommended to receive outpatient occupational therapy did not receive any services (Landry et al., 2006). Among older adults with cancer in the United States, only 9% received rehabilitation within a year of an identified need for services, and only 1% of those patients received occupational therapy (Pergolotti et al., 2015). Those who start therapy are also less likely to continue services without comprehensive insurance coverage (Ostwald, Godwin, Cheong, & Cron, 2009).
In the United States, many older adults receive coverage for outpatient and physician office services through a Medicare Part B Private Fee-for-Service Plan (Medicare, 2014). With a standard Part B plan, Medicare pays for 80% of the allowed reimbursement and beneficiaries are responsible for the remaining 20% plus monthly premiums. Patients may pay for the 20% of the Medicare-allowed amount out of pocket or use a supplemental insurance plan (MedPAC, 2005).
With the passing of the Balanced Budget Act of 1997, a financial limitation was placed on the dollar amount that Medicare would pay for therapy within a given year regardless of diagnosis. Over the years, there have been multiple attempts to repeal the cap, proposed exemptions, and moratoriums. In 2006, an exceptions process went into effect in which beneficiaries who reach the maximum amount of therapy allowed under the spending cap and who need continued therapy are able to receive an automatic exemption until they reach a second cap. After reaching the second cap, beneficiaries are required to apply for a mandatory manual medical review. If any exemption is denied, patients become liable for 100% of the cost of care provided at the full price billed by the therapist.
To our knowledge, it is not known how many patients applied for extensions and were denied services. One previous study documented that between 19% and 22% of beneficiaries exceeded the first cap for occupational therapy, and only about 5% received services beyond the second cap (Ciolek & Hwang, 2010). The price of outpatient therapy for Medicare beneficiaries is not well understood; specifically, how potential changes in the therapy cap policy might affect the use of occupational therapy for those with Medicare insurance and those without insurance coverage is unclear. Most recently, the American Occupational Therapy Association (AOTA) raised concerns over the new Medicare-suggested audit guidance (Sandhu, 2016). This guidance increases the amount and widens the original scope of claims for review. In particular, Medicare will focus on the units and hours of therapy provided. However, evidence of variation in the use (by service type and by geographic region) and overall cost of services is needed to better understand the impact of the therapy caps and other potential policy changes.
Recently, the Centers for Medicare & Medicaid Services (CMS; 2014) prepared a publicly available dataset revealing the use and costs of outpatient services. Using this dataset, we describe the differences in (1) Medicare reimbursements for the most commonly used occupational and physical therapy services in 2012 and 2013, (2) charges set by occupational therapists by geographic region (state), and (3) expected out-of-pocket spending by patients with Medicare and without insurance. We further estimate the potential impact of the Medicare therapy cap on expected out-of-pocket spending and the number of occupational therapy visits received.
Method
Data Source
This retrospective, population-based study used the Medicare Provider Utilization and Payment Data Physician and Other Supplier Public Use File (PUF), released in April 2014 by the CMS to examine variations in care. The PUF consists of a 1-yr cohort of 100% final-action physician–supplier Part B noninstitutional claims for the Medicare fee-for-service population for 2012 and 2013. The PUF contains information associated with services provided to Medicare beneficiaries, including submitted charges (prenegotiated prices set by the practice), the Medicare allowable cost, and the Medicare payment to the provider (set to 80% of the allowable cost because the beneficiary or supplemental insurance pays 20% of the allowable cost). The public use data are aggregated at the level of the provider, identified via National Provider Identifier, service (Healthcare Common Procedure Coding System code), and place of service (facility or institution). To protect Medicare beneficiary privacy, any aggregated record with 10 or fewer beneficiaries was excluded from the PUF. Demographics were available only for providers and included name, gender, complete address, provider type, and credentials (e.g., occupational therapist, physical therapist, doctor of physical therapy) from the National Plan and Provider Numeration System.
Sample Selection
For this study, we included services delivered by occupational and physical therapists during 2012 and 2013. We included data from services provided by physical therapists to examine variation by service only. We excluded services delivered outside the continental United States. The PUF does not include claims for providers who did not participate in the Medicare fee-for-service program or for beneficiaries enrolled in Medicare Advantage plans.
Key Variables
We defined the price of services to patients and Medicare under three scenarios: (1) the expected out-of-pocket costs to uninsured patients, (2) the expected out-of-pocket costs to Medicare beneficiaries, and (3) the amount paid by Medicare. We assumed that uninsured patients were required to pay nonnegotiated physician-submitted charges for each procedure. For Medicare beneficiaries, we estimated expected out-of-pocket costs by subtracting the Medicare-reimbursed amount from the Medicare-allowed amount. To examine the impact of the therapy cap on the number of visits, we calculated the average cost for an occupational therapy visit by multiplying the unit cost by the average number of services billed for a typical visit.
Analysis
We calculated descriptive statistics to compare the expected reimbursement and out-of-pocket costs for uninsured and Medicare-insured beneficiaries for the 10 most frequently used occupational and physical therapy services. We also compared costs for services between provider type (occupational and physical therapy), assessed geographic variation by state for submitted charges for occupational therapy evaluation, and determined the potential impact of the current and proposed therapy caps on the number of services or visits covered.
To account for expected differences in Medicare service-related reimbursement rates by state, we report state-level differences in physician-submitted charges as a ratio of charges relative to Medicare reimbursement (cost–reimbursement ratio; Roper, 1988). This allowed us to understand variation in provider-set charges after accounting for expected regional adjustments in practice costs. We express geographic cost variation as a percentage.
To consider how the cost of therapy relates to the Medicare therapy cap for services, we considered hypothetical scenarios of common occupational therapy services. We examined the potential number of sessions within the therapy cap–allowed dollar amount, based on the median amount paid by Medicare plus the patient’s costs for each code per visit. We also assumed that a client’s initial visit consisted of one evaluation (not timed) and one code for therapeutic exercises (timed at 8–15 min). From there, we considered a typical therapy intervention session. From our descriptive analysis and through consultation with an occupational therapy manager, we assumed that occupational therapists used on average three common codes (e.g., therapeutic exercise, therapeutic activities) for intervention sessions. From there, we hypothesized that each session would be billed as 45 min.
For the first scenario, we determined the number of visits that would be allowed with a 2012 therapy cap of $1,880 and a 2013 therapy cap of $1,900. For the second scenario, we reduced the therapy cap to $1,270 as was recently recommended by MedPAC (2013), a nonpartisan government agency that provides analysis and guidance on Medicare policies to the U.S. Congress. Last, we compared the potential out-of-pocket cost of occupational therapy for clients with Medicare and for clients without insurance for the same services provided under the Medicare therapy cap.
Results
The analytic dataset included 3,662 (9.2%) occupational therapists and 36,248 (90.8%) physical therapists in 2012 and 3,820 (9.1%) occupational therapists and 38,375 (90.9%) physical therapists in 2013. In 2012–2013, the largest number of occupational therapists practiced in New Jersey (9.1%), California (8.2%), New York (7.8%), and Illinois (6.2%). Across years, the services most frequently billed by occupational therapists included therapeutic exercises (40.2% in 2012; 38.8% in 2013), manual therapy (15.9% in 2012; 16.2% in 2013), and therapeutic activities (15.7% in 2012; 16.0% in 2013).
In 2012, the average per-visit charges billed by an occupational therapist and submitted to Medicare for therapeutic exercise, manual therapy, and therapeutic activities were $95.83 (standard deviation [SD] = $49.04), $73.35 (SD = $40.82), and $85.61 (SD = $42.34). When billed by a physical therapist, they were $96.50 (SD = $44.38), $67.60 (SD = $28.76), and $72.68 (SD = $32.06). In 2013, the average per-visit charges billed by an occupational therapist and submitted to Medicare for therapeutic exercise, manual therapy, and therapeutic activities were $96.50 (SD = $46.65), $74.58 (SD = $40.84), and $88.56 (SD = $42.40); when billed by a physical therapist, they were $97.48 (SD = $44.63), $69.03 (SD = $29.07), and $74.73 (SD = $32.18). Table 1 outlines the differences by insurance status and by service type.
Cost (in Dollars) of Outpatient Visits, 2012 and 2013
Note. Cost to uninsured patients, costs to Medicare, and cost to Medicare-insured patients were calculated by multiplying the per-unit value by the average number of units received at each patient visit. M = mean; NMR = neuromuscular reeducation; OT = occupational therapy; PT = physical therapy; SD = standard deviation.
Attended.
Unattended.
Self-care management was not included in top 10 codes of 2013 but included in 2012 and added occupational therapy evaluation codes for reference.
Comparison Across States
The amounts charged by occupational therapists for evaluation services varied by state. On the basis of the cost–reimbursement ratios accounting for geographic variation in Medicare payments, Wisconsin had the most inflated provider charges for occupational therapy evaluation codes in 2012 (152%) and 2013 (147%). In 2012, Tennessee had the second most inflated charges for occupational therapy (135%). In 2013, Texas (124%) replaced Tennessee, moving the latter to third most inflated (122%; Figure 1).
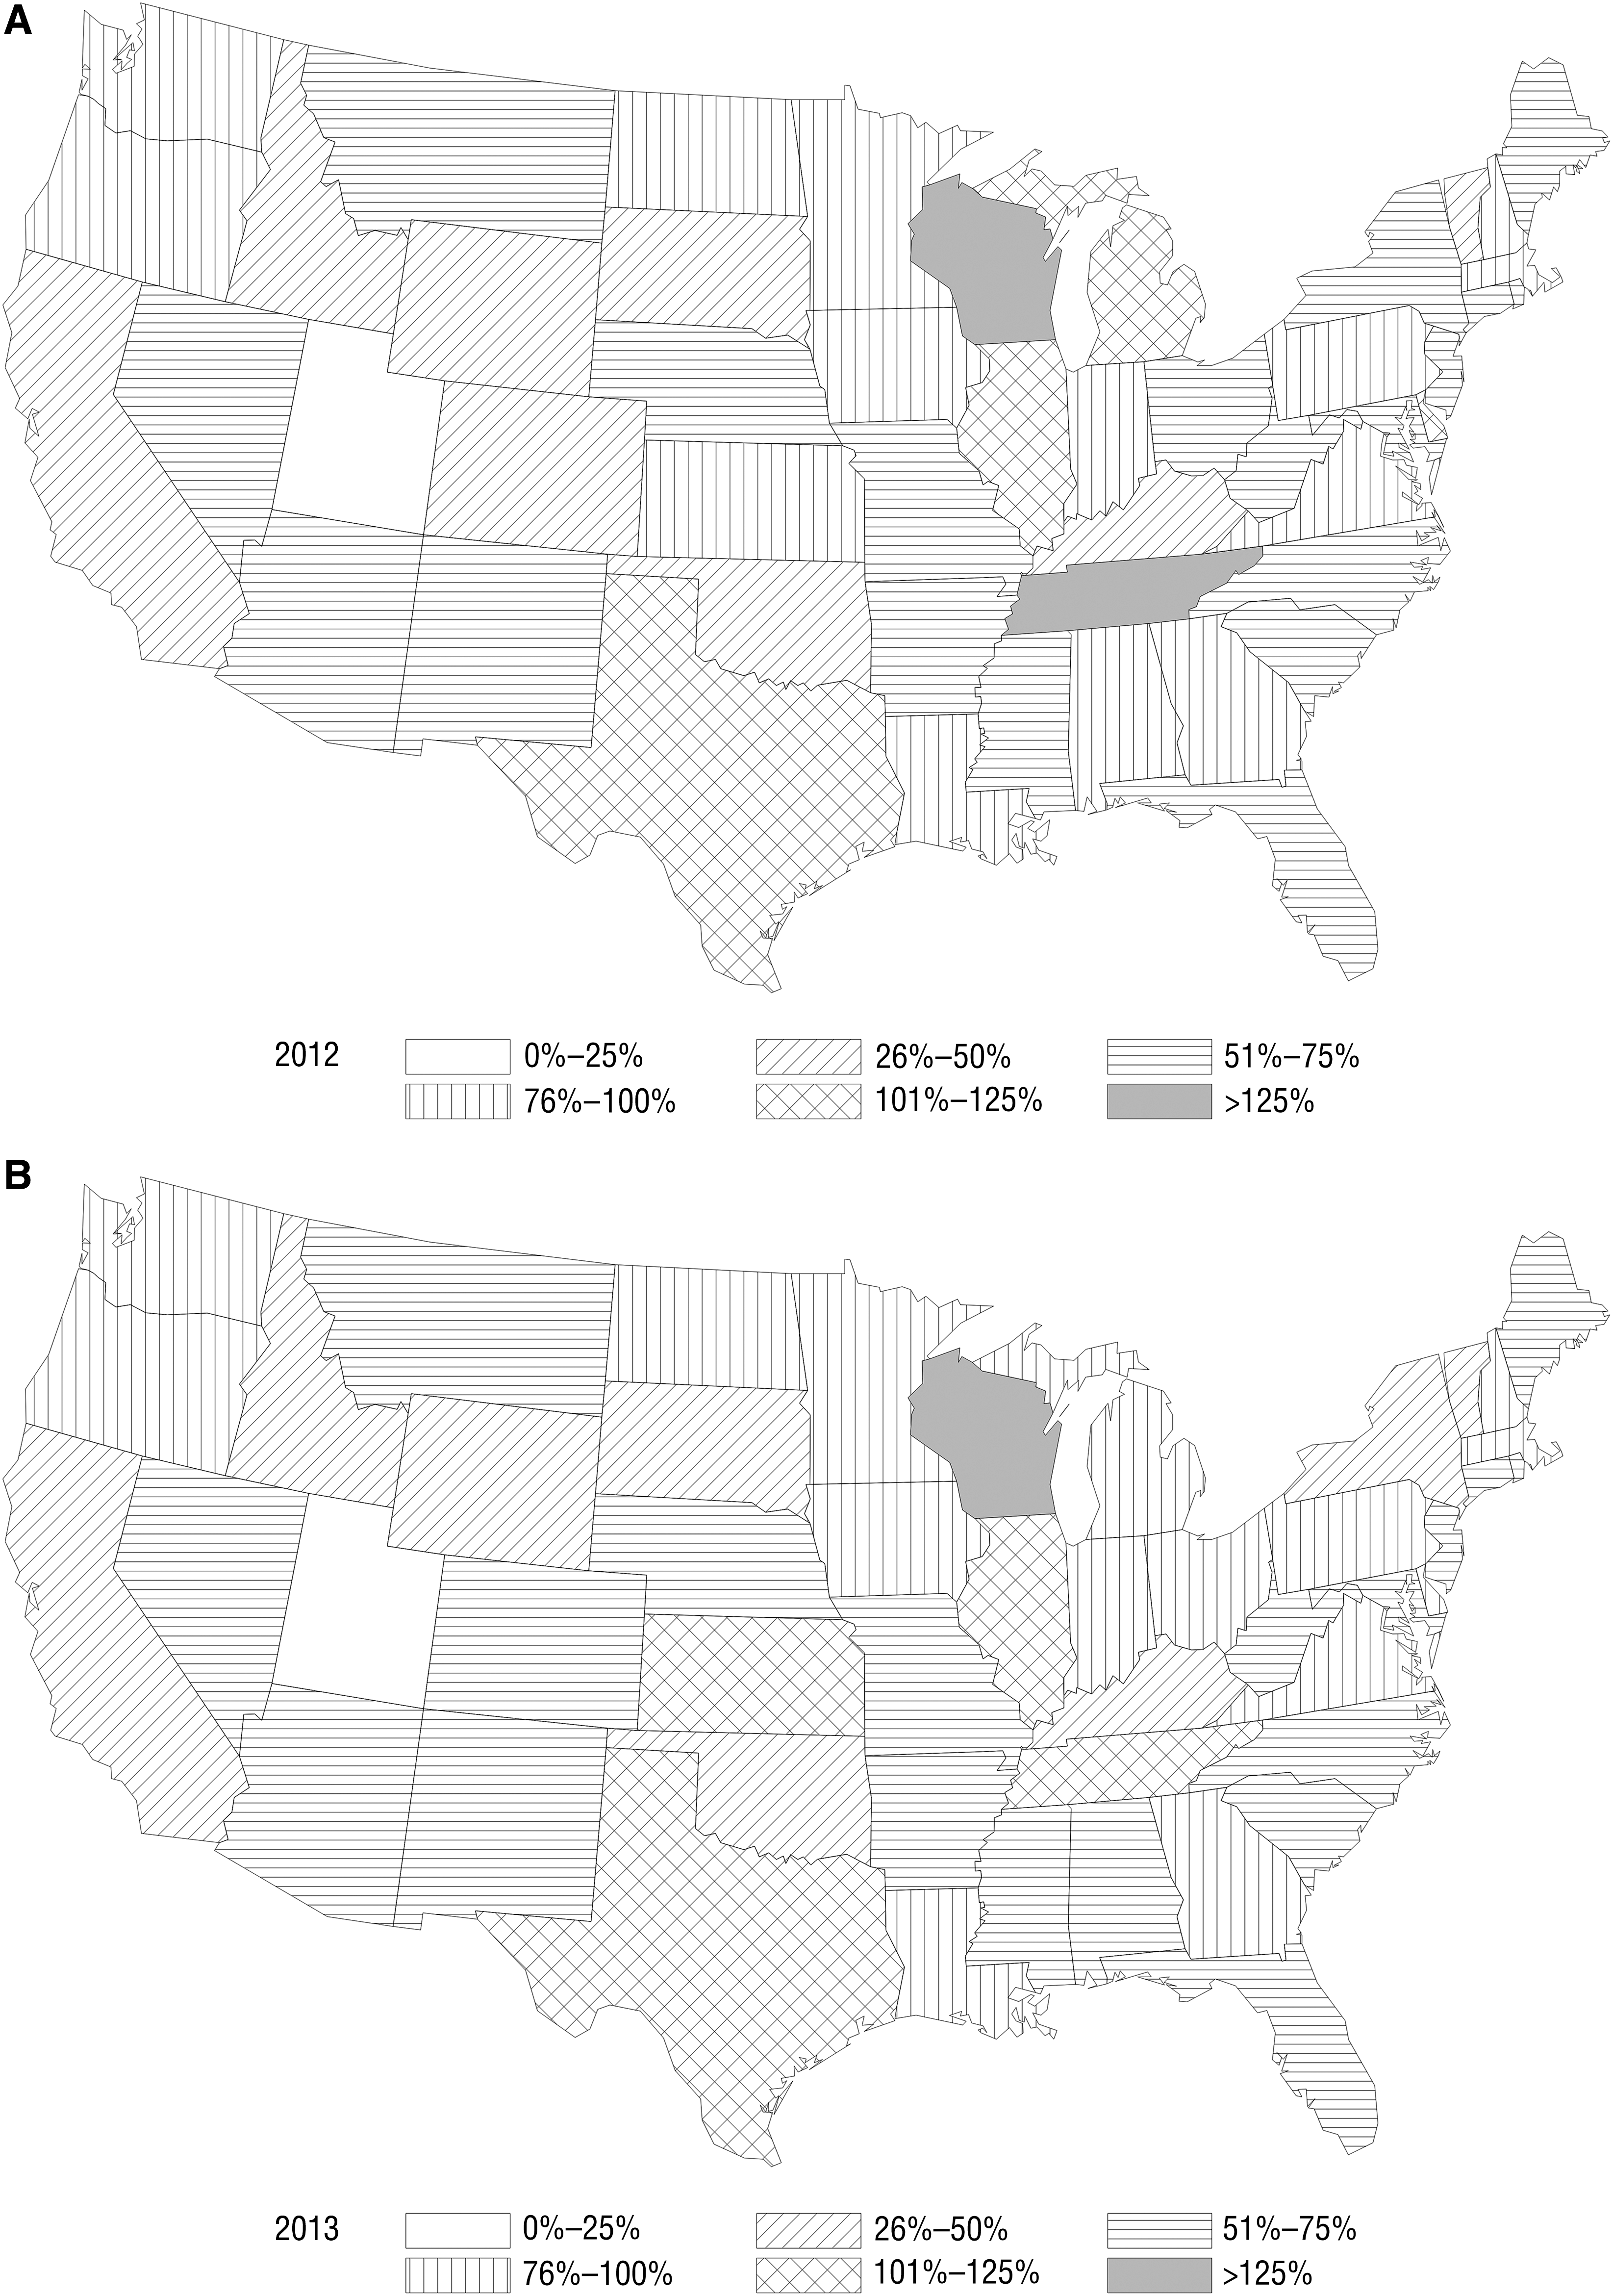
Relative clinician charges for occupational therapy evaluation above Medicare-allowed amounts by state, 2012 (A) and 2013 (B).
Caps
We determined that to reach the 2012 Medicare cap of $1,880 and the 2013 cap of $1,900, a Medicare beneficiary who received outpatient occupational therapy would receive an initial visit that included an evaluation and therapeutic exercise in addition to 12 treatment visits ($1,864.36), consisting of therapeutic exercises, therapeutic activities, and self-care management training. If the cap were lowered to $1,270 (MedPAC, 2013) with no automatic extension, a patient would have received only the initial visit plus 7 ($1,142.02) additional visits before going over the cap. The patient’s potential financial liability for the additional 5 visits would be $1,168, assuming that the patient was required to pay the full provider-set charges for subsequent services (as opposed to Medicare’s negotiated service rate).
Finally, an uninsured patient who needed the same occupational therapy services allowed under the $1,880 cap (evaluation plus 12 treatment visits) would pay an estimated $2,803 if no discounts were offered from the charges set by the provider—a 50% increase over what Medicare would pay and a sixfold increase over the Medicare coinsurance rates.
Discussion
Little population-based data exist on the price of occupational therapy. We summarized physician-set charges and Medicare reimbursements for occupational therapy services for uninsured patients and for patients insured by Medicare, including amounts paid by Medicare and billed to the patient. In this analysis, costs for services varied between providers and by state. Uninsured patients were expected to pay more for the same services, with many potentially paying almost twice the amount for services than was reimbursed by Medicare.
About 86% of the Medicare population has some version of supplemental insurance (either private or Medicaid) to pay for or assist with paying for the coinsurance associated with outpatient care. However, about 14% do not have assistance (Cubanski et al., 2015). In addition, approximately 800,000 older adults (age 65 yr or older) do not qualify for and or are unable to access Medicare and therefore have no insurance (an increase of 1% to 2% from 2000 to 2010; West, Cole, Goodkind, & He, 2014). For those older adults without supplemental insurance or for those with cost-sharing requirements (copayments or coinsurance), the cost of multiple visits to therapy may be difficult to bear, particularly for those on a fixed income. In our hypothetical scenarios, a large difference existed between the cost of coinsurance and the overall price, which likely represented the financial liability for someone who was uninsured. These cost differences could potentially lead to patients receiving a less-than-optimal amount of care (Landry et al., 2006; Neuhaus, 1988).
High financial burden can decrease adherence to therapy and increase risk of disability over time. Prior research has demonstrated that when services become too expensive, patients are unable to or refuse to obtain therapy regardless of their need. In Canada, when outpatient therapy coverage was discontinued in Ontario, adults who were unable to continue with therapy reported increased disability and decreased quality of life (Landry et al., 2006). The same was found in the United States: Adults with disabilities reported that when they were unable to continue therapy because of cost, they suffered physical and psychological consequences along with compromised independence (Neri & Kroll, 2003). With the use of therapy caps or hard limits based on visit count only, many at-risk clients are likely unable to continue with recommended therapy.
As it stands, the therapy cap extension process is in place until December 31, 2017. For the most up-to-date information, see CMS (2016). This extension system allows those who still need occupational therapy to obtain it by continuing to cover the service. The CMS Supplemental Review Contractor will be reviewing providers with a high percentage of clients who go beyond the cap and, in particular, a high percentage of billing unit claims per hour per day. As demonstrated in our study, if the recommendation of a smaller cap amount of $1,270 goes into effect without an automatic cap extension and with only a mandatory medical review, it could potentially lead to clients receiving less care. Mandatory medical reviews have caused notorious delays in processing requests and approvals. If this recommendation or similar policies are enacted without detailed attention and research into the quality, efficacy, and effectiveness of particular durations and intensities of occupational therapy treatment, they may cut costs in the short term. However, imposing financial barriers to access to services for those who are already disabled will decrease the overall quality of care provided and increase the long-term cost of disability for those who need services most (McWilliams, Meara, Zaslavsky, & Ayanian, 2007).
Limitations
Because aggregated codes are summarized at the provider level, we had no information on the beneficiaries to enable us to determine who accessed and used services, who had supplemental insurance, and who was underinsured or uninsured and at the highest risk of liability for the full cost of occupational therapy. Whether beneficiaries had supplemental insurance or what their true out-of-pocket costs were for services received is also unknown. The study may have underestimated clients’ out-of-pocket costs because clients who receive therapy in a hospital facility setting also have an additional facility fee. We were unable to account for this because the PUF contains information from the Medicare physician and supplier file and thus does not include providers operating in hospital outpatient settings.
In addition, we assumed that clients without insurance would be asked to pay physician- or clinician-set charges and would not receive any provider-offered discounts, which may overestimate their financial liability. Whether clinicians offered discounted rates to clients who were uninsured or who chose to receive services outside of their insurance plans is unknown. To our knowledge, there are no data on or literature that discusses the price of therapy for those who are under- or uninsured. Anecdotally, we know that some therapists offer flat rates to clients, do not accept insurance, or provide charity care for those who are unable to pay. The extent to which discounted rates are provided is unknown.
To account for known variations in what Medicare pays for across states, we adjusted our analysis of physician–clinician charges to reimbursement (cost–reimbursement ratios) by the state-level reimbursement rate. We did this to adjust for different wage and cost-of-living rates; however, we may have under- or overestimated the differences between states if reimbursements varied significantly within a state. Also, we considered looking at variation between regions but instead decided on state-level variation to stay consistent with other research comparing cost of services.
For this study, we did not include the potential added financial stress of the combined physical therapy and speech–language pathology cap. Last, very little evidence exists to guide what constitutes the right amount of therapy that should be provided. At this time, each client’s needs are taken into consideration at the individual level when choices regarding duration and intensity of therapy are made, but this individualization makes it challenging to outline specific guidelines for therapy and to examine over- and underuse of services.
Future Research
The inclusion of functional codes (G codes) along with standard billing codes on health insurance claims went into effect in July 2013 (MedPAC, 2013). This information on patient functioning will provide rich specific data that can guide questions about the need for therapy, assuming these codes are adopted and used appropriately. These new codes include categories for walking, moving, handling objects, self-care, memory, functional limitation, and maintaining body position, among others (AOTA, 2014). They will provide valuable information about the type of service billed for a specific deficit, which is lacking in this and most claims-based research and data. Future research could include these codes to examine the need, usage, and effect of the therapy cap on occupational therapy. Future research could also include private insurance to examine patients’ liability with differing insurance coverage. This type of analysis could also examine the variation in usage on the basis of age, disability, working status, and more.
Implications for Occupational Therapy Research and Practice
This study has the following implications for occupational therapy research and practice:
Our study suggests that wide variation exists in the price of occupational therapy services. Unfortunately, it appears that adults without insurance pay a premium for services. Current Medicare reimbursement caps place a limit on the therapy services covered, without substantial research and evidence behind policies, which could potentially provoke substantial financial risk for those with higher therapy needs. This is the first study to examine the costs of outpatient occupational therapy services, not combined with physical therapy, at a population-based level to determine variations in cost.
Variations in the cost of services exist on the basis of state and type of service provided.
Policies that address the therapy cap need more population-based research to support the practice of mandatory manual medical reviews and avoid potential cuts to therapy services for those who need occupational therapy.
Adults without insurance and those with high copays shoulder the highest costs for occupational therapy, and the costs of obtaining needed care may be prohibitive.
Footnotes
Acknowledgments
The research reported in this article was supported by the National Cancer Institute of the National Institutes of Health under Award No. R25CA116339. Dusetzina is supported by the National Institutes of Health Building Interdisciplinary Research Careers in Women’s Health (BIRCWH) K12 Program and the North Carolina Translational and Clinical Sciences Institute (UL1TR001111).