





Abstract
Sensory modulation dysfunction (SMD), a subtype of sensory processing disorder, is a neurodevelopmental condition that affects the sensory processing to stimuli across single or multiple sensory systems (American Psychoanalytic Association, Alliance of Psychoanalytic Organizations Staff, 2006; Interdisciplinary Council on Developmental and Learning Disorders, 2005; Zero to Three, 2005). The estimated probability of SMD in the pediatric and adult population is 5%–16% (Ahn et al., 2004; Bar-Shalita et al., 2015; Ben-Sasson et al., 2009). The sensory overresponsiveness (SOR) subtype of SMD manifests clinically as a condition in which nonpainful stimuli are perceived as abnormally irritating, unpleasant (American Psychoanalytic Association, Alliance of Psychoanalytic Organizations Staff, 2006; Fisher & Dunn, 1983; Interdisciplinary Council on Developmental and Learning Disorders, 2005; Kinnealey et al., 1995; Miller et al., 2007; Reynolds & Lane, 2008; Zero to Three, 2005), or even painful (Bar-Shalita, Vatine, et al., 2009; Fisher & Dunn, 1983). Moreover, SOR interferes with participation in daily routines and activities (Bar-Shalita et al., 2008; Chien et al., 2016; Dunn, 2007), affecting the quality of life, specifically affecting the Bodily Pain subscale of the 36-Item Short Form Survey (Ware et al., 2005) physical health domain measure (Bar-Shalita et al., 2015).
The supposed disruption in the processing of sensory inputs in people with SMD and SOR (SMD–SOR) is also manifested in the pain sensory system. Research indicates that people with SMD–SOR, who are otherwise healthy, demonstrate hypersensitivity to daily painful events and to experimental pain, and they experience longer pain aftersensation (Bar-Shalita et al., 2012, 2015; Bar-Shalita, Vatine, et al., 2009; Bar-Shalita et al., 2014). These psychophysical responses are common in patients with chronic pain conditions such as fibromyalgia, osteoarthritis, and headaches (Sato et al., 2012; Staud et al., 2007; Woolf, 2011).
Although people with SMD–SOR are not considered chronic pain patients, when tested in the lab they have demonstrated pronociceptive (i.e., enhanced activity of pain facilitatory pathways or reduced activity of pain inhibitory pathways; Weissman‐Fogel et al., 2018) behavior, similar to that of pain patients. The interrelation between sensory responsiveness and pain is further evident in our findings indicating that about 40% of migraine and 34% of complex regional pain syndrome patients are characterized as having SMD (Bar-Shalita et al., 2016; Granovsky et al., 2015). We may suggest therefore that hypersensitivity demonstrated in people with SMD–SOR may be reflected in a facilitatory pattern of central neuronal processing.
One of the objective tools for studying pain sensitivity is electroencephalography (EEG) of cortical activity at rest using certain frequencies. Brain activity under task-free conditions (i.e., resting state) represents synchronous neuronal activation patterns that are associated with a specific functional role. Thus, one approach to understanding the mechanisms underlying SOR is to investigate brain activity through its performance under task-free conditions: The EEG activity at α band that emerges from thalamo-cortical feedback loop activations reflects cognitive ability, memory, and expectancy processes (Klimesch, 1999; Mölle et al., 2002; Neuper et al., 2005; Pfurtscheller, 1989). The θ activity reflects hippocampus-cortical feedback loops (Klimesch, 1999; Klimesch et al., 1996), whereas the cortical activity at β band represents local cortico-cortical circuitry (Crone et al., 2006; Kopell et al., 2000). The EEG-α rhythmic activity is the strongest electrophysiological signal measured from the surface of an awake human brain. This activity is most widely explored in the context of experimental pain.
The results of many studies point at a decreased α power and a shift of the peak α frequency (PAF) toward higher frequencies during exposure to experimental pain stimuli (Babiloni et al., 2002; Chang et al., 2002, 2003; Giehl et al., 2014; Huber et al., 2006). Moreover, these brain correlates were found to be associated with greater pain sensitivity in healthy participants (Nir et al., 2010, 2012). Thus, investigating EEG pattern of response under task-free conditions may validate the pronociceptive state found in SOR or other alterations in brain activity. Alterations in brain activity can substrate and explain the behavior observed, validate an endophenotype, and direct effective therapy.
In this study, we investigated the characteristics of resting-state EEG in people with SMD–SOR; more specifically, we hypothesized that because of general SOR, these participants would show neural excitation that would be manifested as lower α power and faster PAF—an EEG pattern reported for healthy participants experiencing pain.
Method
This study was approved by the Institutional Review Board of Rambam Health Care Campus (Haifa, Israel) and was carried out in accordance with the Declaration of Helsinki. A written informed consent was obtained from all participants included in the study before the initiation of each experiment.
Participants
This is a cross-sectional study comparing two groups. We recruited a convenience sample via the laboratory database not having a previous experience with the current testing and also using the snowball sampling method. The study population included 21 young (18–40 yr; 5 men), healthy, White participants. The inclusion criteria were absence of chronic pain history and no use of analgesic or psychiatric medication on a regular basis. Exclusion criteria were psychological, psychosocial, metabolic, and neurological diseases; pregnancy; as well as acute or chronic pain conditions, on the basis of an interview and a medical questionnaire. All participants were able to communicate and understand the instructions of the study and were asked to refrain from any pain relief medications 24 hr before the experimental trial, to not take any caffeine products at least 2 hr before the experiment, and to have sufficient sleep the night before.
Before the experimental session, all participants completed the Sensory Responsiveness Questionnaire–Intensity Scale (SRQ–IS; Bar-Shalita, Seltzer, et al., 2009) aimed at clinically identifying SMD (Bar-Shalita, Seltzer, et al., 2009; Bar-Shalita et al., 2012). The SRQ–IS consists of 58 items representing typical daily scenarios. Each item involves one sensory stimulus in one modality, including auditory, visual, gustatory, olfactory, vestibular, and somatosensory stimuli, excluding pain. Participants are asked to rate the intensity of the hedonic or aversive response to the situation on a 5-point scale ranging from 1 (not at all) to 5 (very much). The SRQ–IS has been demonstrated to have content, criterion, and construct validity; internal consistency (Cronbach’s αs = .90–.93); and test–retest reliability (rs = .71–.84; ps < .01–.05; Bar-Shalita, Seltzer, et al., 2009).
The SRQ elicits two scores: SRQ–Hedonic (26 items), for which cutoff scores are (mean [M] + 2 standard deviations [SDs]) 2.10 + 0.66, and SRQ–Aversive (32 items), for which cutoff scores are 1.87 + 0.52. In this study, the SMD–SOR group was composed of participants scoring more than 2 SDs only on the SRQ–Aversive score; thus, the study group was composed of participants with SOR only. The 2-SD cutoff scores were applied to ensure cautious group placement. On the basis of the scoring, the participants were enrolled in one of two study groups: participants with SMD–SOR (henceforth, the SOR group; n = 9 [2 men]) and participants with sensory-normo-responsiveness (henceforth, the control group; n = 12 [3 men]). No difference was found between SOR and control groups in age (M ± SD = 36.0 ± 7.3 vs. 30.3 ± 6.1 yr, p = .064).
Resting-State Electroencephalography Recording
A 5-min continuous EEG recording was carried out in a quiet air-conditioned room with the participants sitting in a comfortable recliner. The EEG recordings were undertaken by all participants during morning hours. Standardized instructions were delivered. All recordings were performed during wakefulness while participants were instructed to relax, close their eyes, and “clear their thoughts.” Of note, the α activity is best seen with eyes closed and under conditions of physical relaxation and mental inactivity, primarily over the posterior regions of the head (Klimesch et al., 1999; Posthuma et al., 2001). Moreover, blinking can affect the EEG within the α band (Klimesch et al., 1999; Posthuma et al., 2001); thus, participants were instructed to keep their eyes closed.
We recorded the EEG signal using a 32-electrode cap (Easy Cap Q40; FMS Falk Minow Services, Herrsching, Germany) with the Quick Amp EEG system (Brain Products GmbH, Munich, Germany). Additional parameters included a 0.15- to 100-Hz bandpass filter, a 500-Hz sampling rate, an electrode impedance less than 5 kOhm, and a notch filter of 50 Hz to reduce electrical interference; in addition, the average electrodes’ activity was considered as reference. The data were analyzed offline with Analyzer Software (Brain Products GmbH, Munich, Germany).
Resting-State Electroencephalography Analysis
Each EEG recording of 5 min was segmented into 300 segments of 1 s each. All segments contaminated with electro-oculographic or muscle artifacts were eliminated after visual inspection. The total number of segments encompassed in the analysis varied from 250 to 300. Power spectral analysis was computed by averaging the fast Fourier transformation power spectra of the 1-s data windows of all artifact-free segments. The data from 11 recording electrodes (F3, Fz, F4, C3, Cz, C4, P3, Pz, P4, T7, and T8) were analyzed. The choice of electrodes was based on the approach to cover the midline and left–right EEG activity at frontal, central, and posterior cortical areas; the occipital electrodes were not included because of lack of the O2 recording from methodological reasons. The T7 and T8 electrodes were chosen because of our previous reports on association between the α activity and the experimental pain perception (Nir et al., 2010, 2012). Figure 1 depicts the position of the recording and the analyzed electrodes.
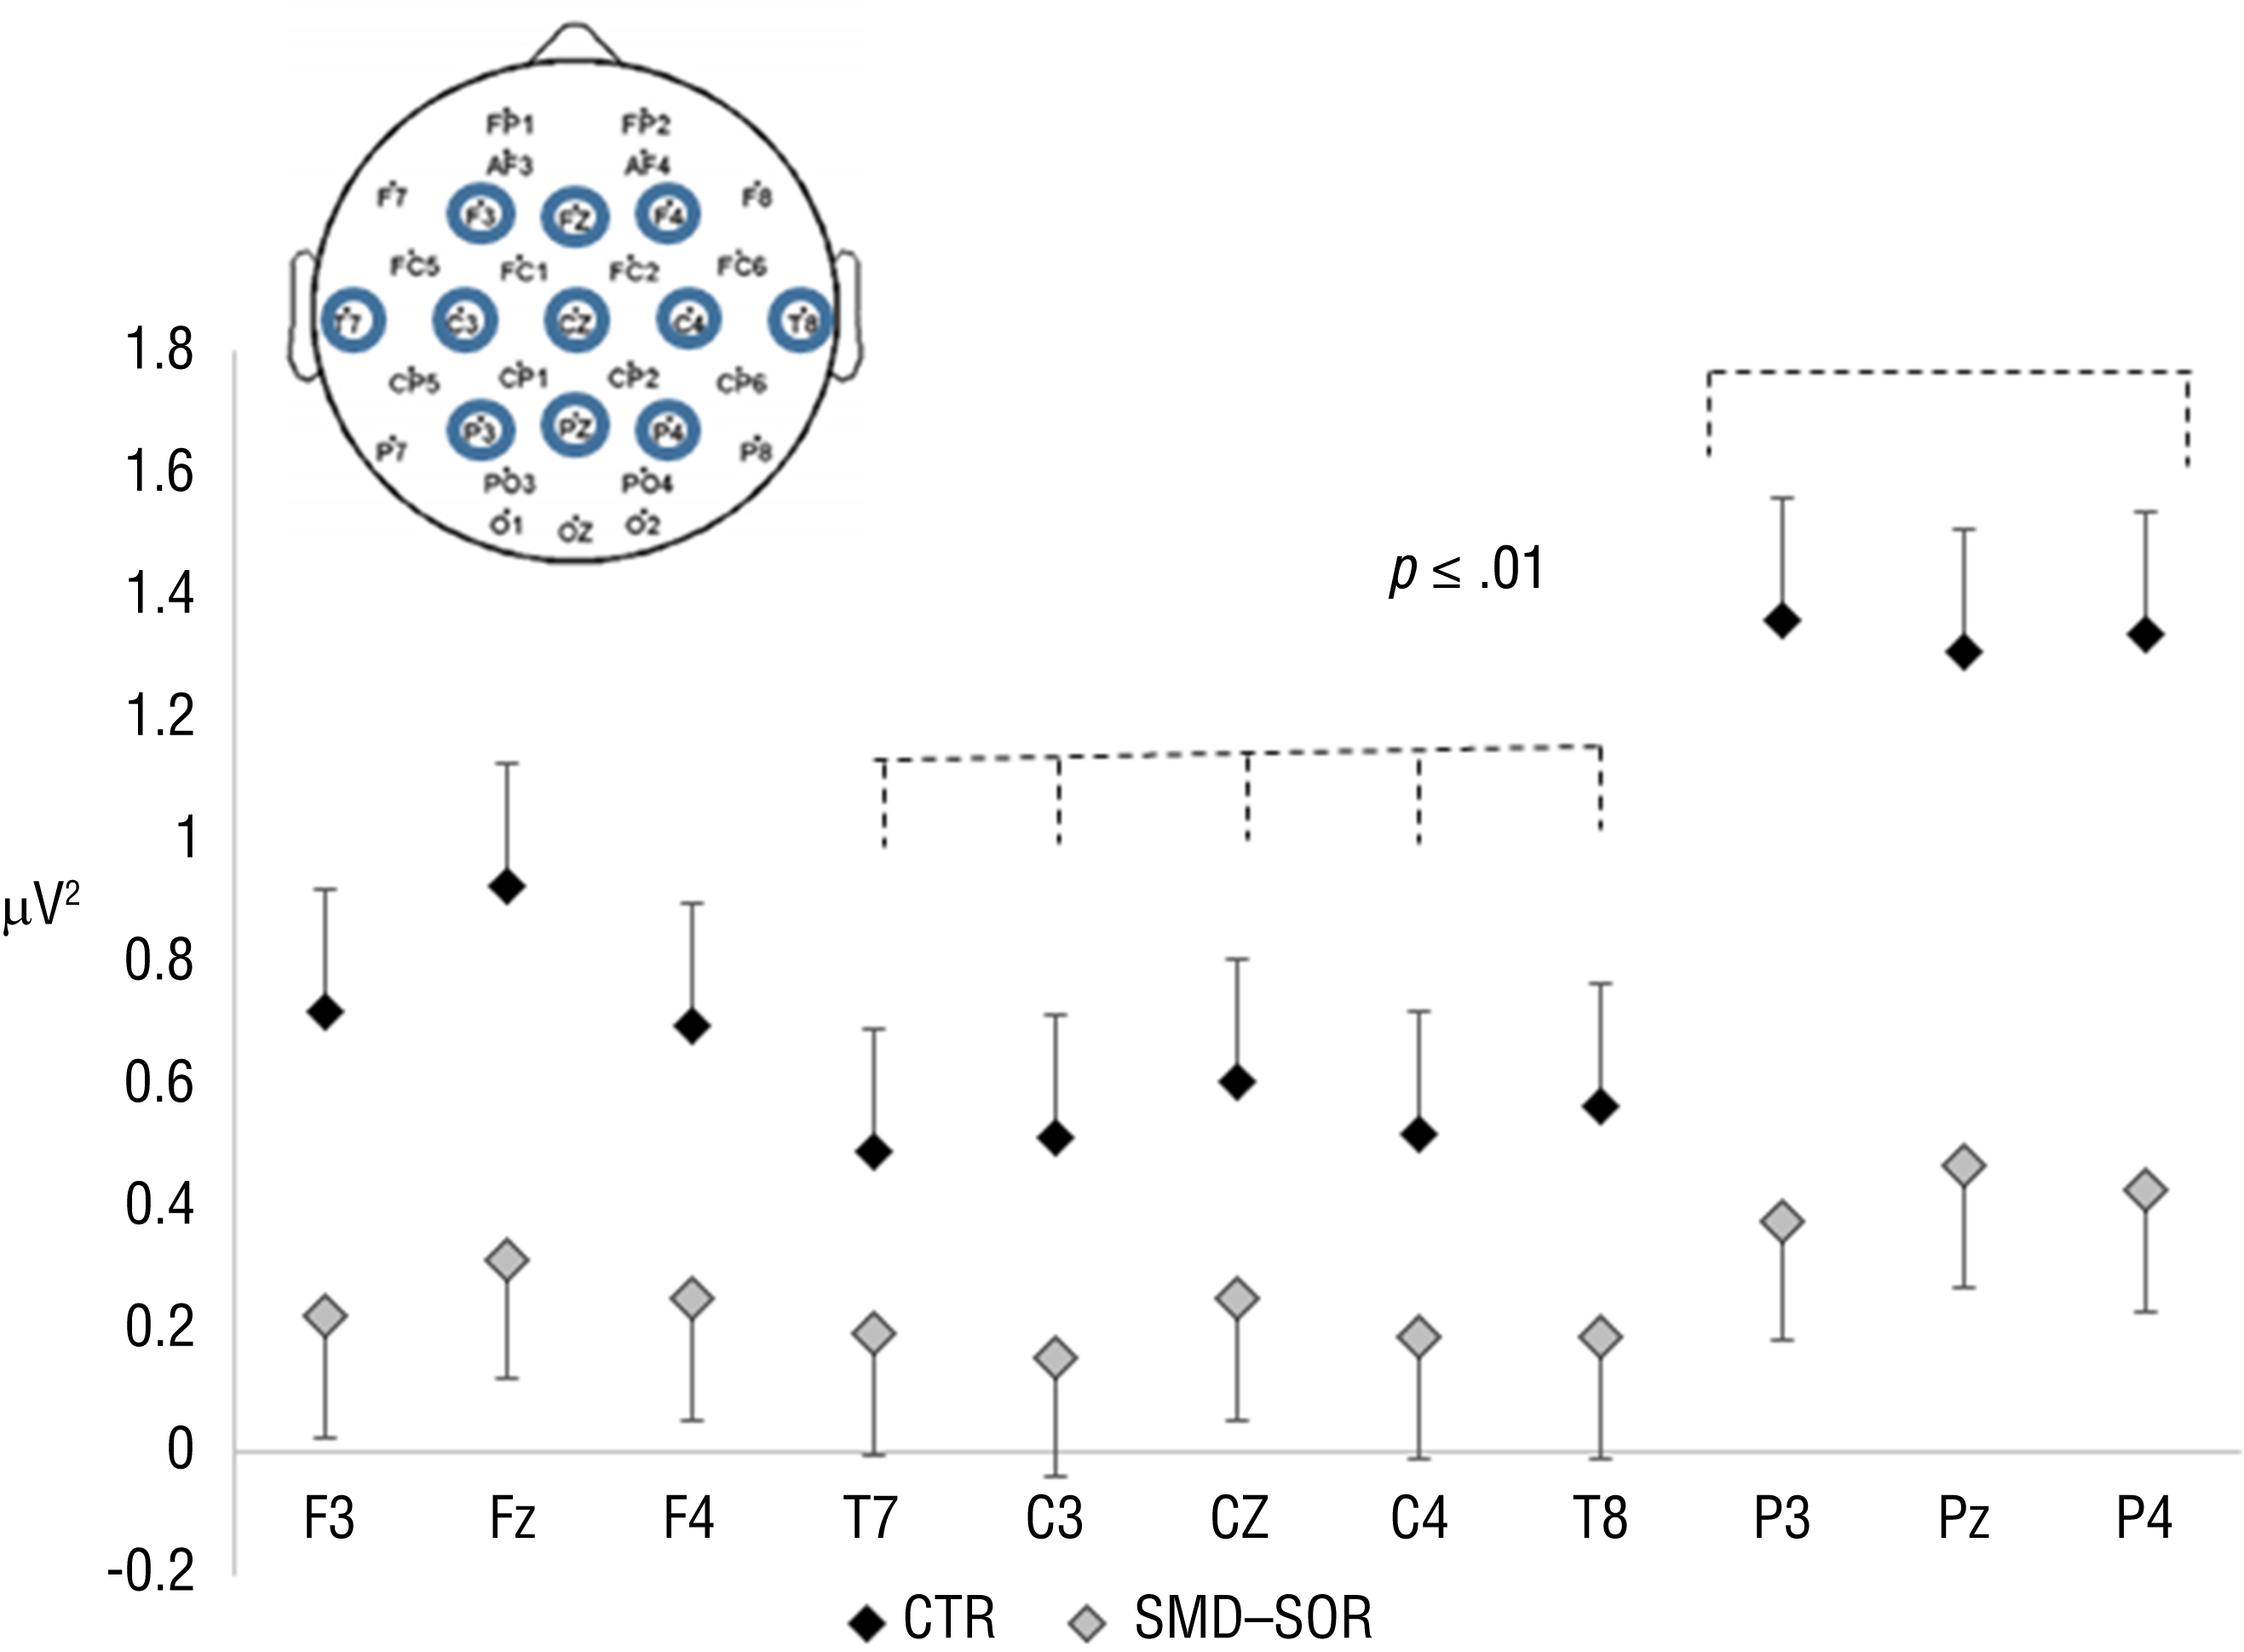
EEG activity within the α1 in the CTR group has a different distribution compared with the SMD–SOR group.
The analyzed EEG frequency bands were defined as follows: 0.5–3.5 Hz for the δ, 3.6–7.4 Hz for the θ, 7.5–9.5 Hz for the α1, 10–12 Hz for the α2 (Egsgaard et al., 2009), 12.5–20.0 Hz for the β1, and 21–32 Hz for the β2 bands. The summarized spectral power (overall EEG activity) within each band frequency was calculated per participant as an area under the curve for each of the 11 electrodes. In addition, for the α band (7.5–12.5 Hz), the peak amplitude (peak α power) and its corresponding frequencies (PAF) were obtained for each of the 11 electrodes defined for the analysis.
Data Analysis
We analyzed data using Excel (Microsoft Corp., Redmond, WA) and JMP (SAS Institute, Cary, NC) software. The results are expressed as means ± standard errors unless mentioned otherwise.
Two-way, repeated-measures analyses of variance (ANOVAs) were performed to identify significant group differences for the EEG activity within each band as well as for the peak α power and PAF. These repeated-measures ANOVAs corrected for multiple comparisons incorporated group (control or SOR), recording electrode position (F3, Fz, F4, C3, Cz, C4, P3, Pz, P4, T7, and T8), and the interaction among them. All ANOVAs were followed by performing the Tukey–Kramer post hoc test. We assessed relationships with the continuous variable of sensory sensitivity (the individual SRQ score) using linear regressions and Pearson correlations.
Results
Group Comparisons for Resting-State Electroencephalography for Each Band
The SOR group demonstrated global reduction in the EEG activity. This outcome was mostly evident for the θ (p = .021) and α1 (p = .044) frequency bands (Table 1). In addition, for the θ, α1, α2, β1, and β2 bands, a significant overall effect of the recording electrode position was found, indicating a difference in the EEG activity responses among the analyzed electrodes:
For the θ band (p = .002), the activity at Fz, Pz, and P3 was higher than the activity at C3.
For the α1 band (p < .001), the activity at the three posterior electrodes (P3, Pz, P4) was higher than the activity at the three central electrodes (C3, Cz, C4) and at the bilateral temporal positions (T7 and T8).
For the α2 band (p < .001), the activity at Pz and P4 was higher than the rest of the recording electrodes.
For the β1 band (p = .01), the activity at Pz was higher than the activity at F3, C3, Cz, and T8.
For the β2 band (p = .022), the post hoc analysis did not reveal any special effect of the electrode position.
Resting-State EEG Power Within Each Frequency Band in SOR and CTR Groups (M ± SE)
Note. Overall, the sensory overresponsiveness (SOR) group demonstrated lower power at θ and α1 bands compared with the control (CTR) group. EEG = electroencephalography; M = mean; SE = standard error.
p < .05 of the group effect from the repeated-measures analysis of variance.
The effect of the recording electrode was unrelated to the group for all bands except for α1. For the activity at the α1 band (Table 2), a borderline Group × Recording Electrode interaction was found (p = .071). The results of the uncorrected paired t test indicated that the SOR group showed similar α1 activity over all the recording electrodes. In contrast, in the control group, the α1 activity significantly increased toward the three posterior electrodes (P3, Pz, P4) compared with the activity at the three central electrodes (C3, Cz, C4) and the bilateral temporal positions (T7 and T8; all ps < .01; Figure 1).
Resting-State Peak α Power and Peak α Frequency in SOR and CTR Groups (M ± SE)
Note. The sensory overresponsiveness (SOR) group demonstrated faster peak α frequency than the control (CTR) group. M = mean; SE = standard error.
p < .05 of the group effect from the repeated-measures analysis of variance.
Group Comparisons for the Resting-State Electroencephalography: Peak α Power and Peak α Frequency Analysis
The SOR and the control groups did not differ significantly in the peak α power (p = .308). However, the PAF was overall significantly faster in the SOR group than in the control group (10.1 ± 0.3 vs. 9.3 ± 0.3 Hz; p = .032), with no interaction with the electrode position (p = .525). The peak α power and the PAF values are presented in Table 2. For both measures, a significant effect of the recording electrode position was found (p < .001), indicating a difference in the peak α power among the analyzed electrodes. More specifically, peak α power was higher at the Pz electrode compared with frontal (F3, Fz, F4), central (C3, Cz, C4), and temporal (T7, T8) electrodes. The PAF at Pz and P4 was faster than the rest of the electrodes.
Association Between the Sensory Responsiveness Questionnaire Score and α Activity
The regression analysis revealed a significant interaction between the SRQ and the group factor (SOR or control) in their relationship with the peak α power in the electrodes position at F3 (model, p = .018; interaction, p = .015), C4 (model, p = .026; interaction, p = .018), P4 (model, p = .002; interaction, p = .001), T7 (model, p < .001; interaction, p < .001), and T8 (model, p = .009; interaction, p = .008). This interaction is based on the positive significant relationships between the SRQ scores and the peak α power in the control group at all electrode positions (F3: r = .62, p = .030; C4: r = .76, p = .004; P4: r = .80, p = .002; T7: r = .87, p < .001; T8: r = .69, p = .013). No significant correlations were found for the SOR (p > .1 in all the comparisons). Figure 2 demonstrates the relationships between the peak α power and the SRQ scores at T7 and T8 electrode positions in both control and SOR participants.
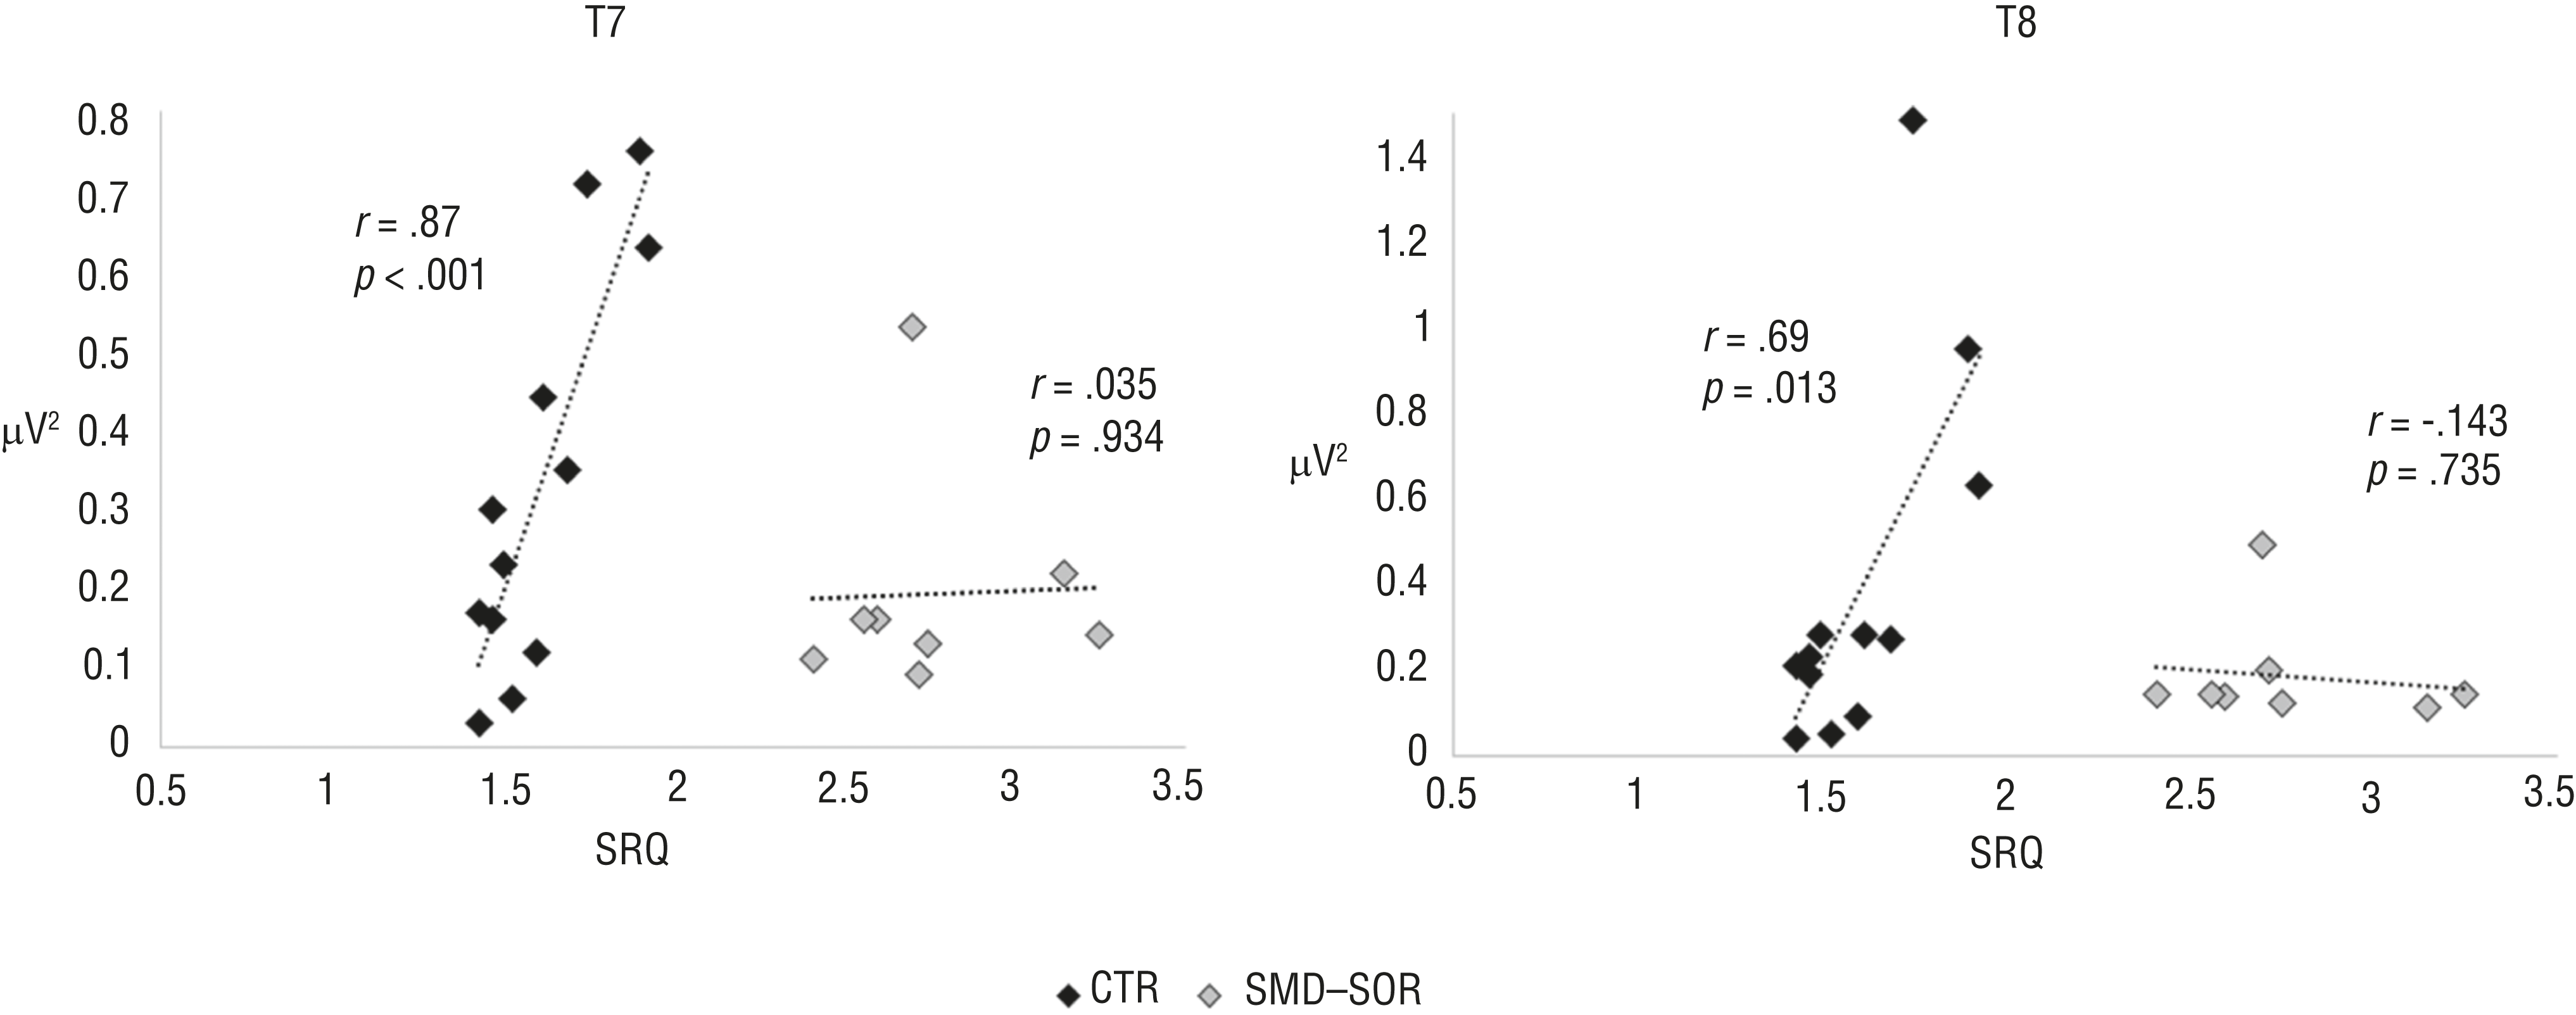
Different associations between SRQ scores and peak α power in the CTR group and the SMD–SOR group at the T7 and T8 electrode positions.
Discussion
This is the first study aimed at characterizing the resting-state EEG activity in participants with SMD–SOR. Our results lead to four main conclusions. Participants with SOR demonstrated global reduction of cortical activity in θ, α, and β bands, although this reduction was most prominent in the α1 band. Additionally, these participants showed faster α activity, mainly over the parietal electrodes. Participants with SOR had different topographical dispersions of the activity within α1 band; whereas participants with typical sensory responsiveness demonstrated increased activity toward parietal sites, participants with SOR did not show this topographical distribution. Finally, in contrast to control participants, the extent of sensory responsiveness did not correlate with the α power in participants with SOR.
Overall, our novel findings point at an abnormal basic neurophysiological activity under a task-free condition, which may play a fundamental role in the altered neural processing of sensory stimuli found in participants with SMD–SOR (Davies et al., 2010).
Electroencephalography Activity Within α Band in Sensory Overresponsiveness
Our main findings of the EEG power spectra differences between participants with SOR and participants with normo-responsiveness account for the α-band activity. During the resting-state recording, participants with SOR demonstrated desynchronization (nonsynchronized activity that results in amplitude decrease) of α1 activity associated with decreased EEG power (within 7.5–9.5 Hz), faster PAF (the peak of α1 activity appears at higher frequency), and a lack of expected power increase toward posterior electrodes (the larger α activity is usually observed at posterior-occipital cortical regions). In our view, these findings should be discussed in two possible contexts: desynchronization (reduction) of brain activity at α frequency as an index of higher cortical activity during resting-state and—probably complementary to that—the association between lower amplitude and faster frequency in α activity and pronociception.
Alpha brain rhythms have been attributed to information transfer through thalamo-cortical and cortico-cortical pathways. High α activity is an electrophysiological indicator of vigilance and arousal, attenuating during targeted cognitive activity and strengthening while the brain is unoccupied by specific mental tasks and devoid of significant sensory input, particularly visual input. The power of α activity is inversely correlated to metabolic function of the widespread cortical areas, further pointing at α rhythm as an index of cortical inactivity (DiFrancesco et al., 2008; Goldman et al., 2002). Alpha functionality is characterized by phasic cycles, in which increase or decrease in activation synchrony reflects states of inhibited or enhanced cortical activity (Anderson & Ding, 2011; Foxe et al., 1998; Pineda, 2005; Romei et al., 2008).
The functional significance of resting-state or prestimulus α oscillatory activity relates to detection and perception of upcoming external stimuli and is therefore considered a sensory gating mechanism, inhibiting task-irrelevant areas and activating task-relevant regions (Jensen et al., 2012; Jensen & Mazaheri, 2010; Ploner et al., 2006b). More specifically, when indexing greater cortical activity, low baseline α power results in stimulus-driven high cortical responses to sensory stimuli of various modalities (Hanslmayr et al., 2007; Roberts et al., 2014; Romei et al., 2008; Thut et al., 2006). Indeed, results from testing auditory event-related potentials in children with SMD–SOR have suggested more extended and intense processing compared with neuro-typical controls (Davies et al., 2010).
Alpha rhythm is not a phenomenon that occurs in isolation or independently of other cortical and subcortical activities; α power is positively correlated with the activity of resting-state networks (Fomina et al., 2015; Kay et al., 2012; Knyazev et al., 2011). Moreover, low resting-state α power reflects a general interruption of intrinsic processes of the brain activity in the resting state, contributing to further deactivation of resting-state brain networks in response to external stimuli (Mayhew, Hylands-White, et al., 2013; Mayhew, Ostwald, et al., 2013). Therefore, we may hypothesize that reduced α power in participants with SOR recorded at resting state, when the brain is unoccupied by external demands, indicates heightened vigilance to external stimuli. This condition can be part of an ongoing physiological activity in participants with SOR, which persists in an “active” state, preparing the brain to overreact to environmental stimuli.
This assumption is supported by our current findings showing that SOR participants (1) lack the expected increase of α power at posterior electrodes normally observed in eyes closed resting-state recordings and (2) have reduced α activity at lower frequencies (α1), which is considered to reflect anticipatory processes and attentional demands (Klimesch et al., 1996, 1998; Michels et al., 2008). We therefore believe that the described pattern of low α resting-state cortical activity probably relates to a general state of heightened cortical activity, which may manifest as a behavioral alert mode characterized by overresponsiveness to environmental stimuli demonstrated by participants with SMD–SOR. This condition may affect and restrict the daily life of participants with SMD–SOR as well as their participation and quality of life (Bar-Shalita et al., 2015; Dunn, 2007; Kinnealey et al., 2011; Miller et al., 2007), leading to a state of perceiving innocuous stimuli as noxious.
Electroencephalography Activity at α Band and Pronociception
Complementary with this approach, reduced α activity may be one of the mediating factors between SOR and pronociception. Reduced α activity was reported in some pain syndromes (Clemens et al., 2008; Hargrove et al., 2010; Jensen et al., 2013), whereas the pain-relieving effect of an analgesic intervention such as acupuncture was accompanied by a global increase in EEG power, including the α band (Sakai et al., 2007). The association among low α power, faster PAF, and anticipation or exposure to experimental pain is widely reported in healthy participants (Babiloni et al., 2002, 2006; Chang et al., 2002, 2003; Giehl et al., 2014; Huber et al., 2006; Nir et al., 2010, 2012). Therefore, on the basis of our findings of reduced α activity and faster PAF in SOR participants tested under a task-free condition, along with the reported pain sensitivity enhancement in SMD–SOR, we may hypothesize that abnormal α activity relates to the mechanisms underlying the behavior of SOR that people exhibit, including pronociception. Taking this hypothesis further we may expect that some treatments used in pain management (e.g., mindfulness, deep breathing, cognitive–behavioral therapy) might act to change brain activity patterns and might also work for SMD.
Sensory Responsiveness and α Activity
Our results point at different associations between the extent of sensory responsiveness and the α peak power in control participants compared with participants with SOR. We therefore assume that when sensory responsiveness is within the normal range, a high SRQ score is associated with higher α peak power, reflecting a physiological association between heightened α activity and normally functioning sensory systems. However, this relationship is probably not valid in the SOR condition, when both sensory and cortical systems work in a different functioning mode, residing in a permanent alert condition of sensory processing and lower resting-state α activity.
Study Limitations
The main limitation of our study relates to a small sample size that may limit generalizability of our results. Yet, the number of participants available for analyses was deemed acceptable because of the nature of data analyses applied. Because these are novel findings that were not reported to date, further studies are needed to confirm our results.
Implications for Occupational Therapy Practice
This is the first study to demonstrate abnormal basic neurophysiological activity under a task-free condition in participants with SOR. This neurophysiological marker indicates a fundamental deficiency in brain activity that may lay the foundation for the difficulties that people with SMD encounter in daily life. Moreover, because the pattern of brain activity found strengthens previous findings associating SOR and pain sensitivity, pain therapy may broaden the therapeutic modalities aimed at ameliorating the well-being of people with SMD. Specifically, this study may suggest a new direction for a remedial approach that uses neurofeedback in people with SMD:
A neurophysiological marker pointing at an alternation in the basic brain activity was found, adding to the evidence presenting SOR as a health condition that warrants intervention.
Findings validate the association previously found between SMD and pain sensitivity, suggesting that pain should be considered when treating SOR.
New treatment modalities that follow the remedial approach could be incorporated into the intervention with SOR adults.
Conclusion
The global reduction in the resting-state EEG power and particularly reduced α activity may suggest a common pattern of overresponsive multisensory brain responses in people with SOR. This study revealed a neurophysiological marker, not previously reported for the SMD–SOR condition, further validating its association with a pronociceptive state.
Footnotes
Acknowledgments
We thank Ofrit Bar-Bachar for her help with English editing.
All authors contributed equally to the article.