





Abstract
Coping is a general term used to describe cognitive and behavioral efforts to manage everyday situations (Zeitlin, 1985). The ultimate aim of occupational therapy for children is participation in everyday life (Lane, 2012). Behaviors used to manage everyday life situations are therefore a crucial aspect of occupational therapy intervention.
Poor coping is common in children with developmental disabilities (Fenton et al., 2003). Many disengage from stressful situations instead of using active strategies to deal with them (Hartley & MacLean, 2008). Poor coping is thought to lead to undesirable adult outcomes (Malhi & Singhi, 2015). Thus, monitoring coping and intervening as needed in childhood are important.
The Coping Inventory (CI; Zeitlin, 1985) assesses strategies that children use to meet personal needs and adapt to changes in the environment. In addition to providing an overall score called the Adaptive Behavior Index (ABI), the CI yields information about the style of coping strategies (i.e., productive vs. nonproductive, active vs. passive, flexible vs. rigid), making the CI particularly useful to occupational therapy practitioners seeking to understand the nature of children’s coping behaviors. Having a valid tool to assess coping is important when planning intervention to improve management of everyday situations. Our review of the extant literature revealed no similar assessments for children. Nonetheless, despite the CI’s potential usefulness, we are not aware that it is commonly in practice.
The CI also has been used, albeit somewhat infrequently, in occupational therapy and physical therapy research to describe the coping skills of various pediatric populations and as an outcome measure (e.g., Chiarello et al., 2012; DeSantis et al., 2004; Hess & Bundy, 2003; Ruckser-Scherb et al., 2013; Saunders et al., 1999). Although the CI could be useful for intervention planning and research, it is more than 30 yr old, and validity and reliability of data gathered with it have not been reexamined in the intervening years. Underuse of the CI may stem, in part, from the fact that it has not undergone rigorous psychometric evaluation.
To date, only Zeitlin (1985) has provided evidence for validity and reliability of data gathered with the CI. In addition to factor analysis, Zeitlin reported a moderate correlation between the CI ABI and a measure of school achievement (California Achievement Tests; r = .71, p < .001) and a low but significant correlation with a measure of self-concept (Piers-Harris Self-Concept Scale; r = .17, p = .02). Zeitlin also found high internal consistency (αs = .84–.98) of CI items and small measurement errors (.026–.030). Zeitlin reported strong evidence for interrater reliability when the CI was administered to children with developmental disabilities (rs = .78–.94, p < .001). To our knowledge, no other consideration of the CI’s psychometrics has occurred since Zeitlin’s study.
Rasch analysis is a psychometric model used for detailed analysis of categorical variables. An additional benefit of Rasch analysis is data for each item that allow one to examine precision of measurement. Items that do not fit clearly along the hierarchy generated in the analysis may be outside the construct being assessed. Even when they fit the construct well, multiple items at the same level of difficulty may indicate redundancy, presenting a possible opportunity to create a more parsimonious set of items to make the test more usable.
The aims of this study were to examine the evidence for construct validity, internal reliability, and test–retest reliability of CI data and to explore whether a more parsimonious set of items could be constructed from existing CI items to measure coping (i.e., whether any items yielded redundant information). We used Rasch analysis (rating scale model) to examine construct validity, internal reliability, and redundancy of items, and we used intraclass correlations (ICCs) and Bland–Altman plots to examine test–retest reliability.
Method
This analysis was part of a larger multiple-baseline cluster repeated-measures trial of five schools in the greater Sydney area of New South Wales, Australia (Bundy et al., 2015). The data for this study came from the first two participating schools. We received written informed consent from school administrators, staff, and parents of the children involved in the study. We obtained ethical approval from the Human Research Ethics Committee at The University of Sydney (2014/155) and the Catholic Education Office of the Archdiocese of Sydney.
Participants
Educators (n = 39) from two Sydney-area primary schools that focus exclusively on children with developmental disabilities participated. School 1 was for children with intellectual disabilities in the mild to moderate range and/or autism spectrum disorder (ASD; n = 40). School 2 was for children with ASD only (n = 39). Table 1 shows child characteristics. All children were age 5–13 yr (mean [M] = 8.0 yr, standard deviation [SD] = 2.0). Although diagnoses were provided for only 47 of the 79 students, a confirmed diagnosis of autism and/or mild to moderate intellectual disability was the criterion for admission to the participating schools.
Child Characteristics (N = 79)
Note. Percentages do not total 100 because of rounding. ASD = autism spectrum disorder; M = mean; PDD–NOS = pervasive developmental disorder–not otherwise specified; SD = standard deviation.
Overall school average.
School personnel completed two assessments (CI 1 and CI 2) for each child a mean of 15 days apart (SD = 1.5, range = 13–19). We deemed this to be enough time to prevent recall of answers from the first test but not so long that genuine change was likely to have occurred. The same adult completed both CIs for each child. Each staff member at School 1 completed CIs for a mean of 2.5 students (range = 1–5); each staff at member School 2 completed CIs for a mean of 1.7 students (range = 1–2). Staff at both schools had been in their role or position for a mean of 7.4 yr (SD = 5.6).
Instrument
The CI (Zeitlin, 1985) is a 48-item survey that can be used with children ages 3–16 yr. Coping behaviors are assessed by an adult who is well acquainted with the child. In this study, the CI was completed by the child’s teacher or teacher’s assistant. Each question is scored on a 5-point scale ranging from 1 (behavior is not effective) to 5 (behavior is effective most of the time). CI questions are divided into two categories: (1) Coping With Self (i.e., behaviors to meet personal needs) and (2) Coping With Environment (i.e., behaviors required to manage the demands of the surroundings). Items from each category are further divided into three dimensions that reflect coping style: (a) Productive (i.e., use of personal resources to influence what happens and have some control over the environment), (b) Active (i.e., mental or physical behaviors used to initiate and sustain action), and (c) Flexible (i.e., adaptability and use of a variety of strategies). Raters calculate scores for the two categories and the three dimensions as well as an overall ABI.
Analysis
All raw data were subjected to Rasch analysis using Winsteps Version 3.81.0 (Linacre, 2014) to convert the raw, ordinal scores to interval-level data. In the context of this study, Rasch analysis assumes that children with greater coping ability are more likely to have higher scores on difficult items than children with lower coping ability. Using logarithmic transformation, Rasch analysis yields measure scores as well as error estimates, expressed as log odds probability units (logits), for each child and each measure. Using these measure scores, all item and child measures are placed along a single hierarchy reflecting item difficulty and child coping ability.
To examine evidence that the data form a unidimensional hierarchy, we considered the direction of the point-measure correlation for each item; item goodness-of-fit statistics; logic of the item hierarchy; and results of a principal-components analysis (PCA) of residuals, which provides evidence for multiple dimensions in the data. We also considered rating scale structure (i.e., match between the progression of average scores on an item and average overall child scores). All item point-measure correlation values were assessed as to whether they were positive or negative; a negative correlation indicates the item is not part of the overall construct (Bond & Fox, 2015). Goodness-of-fit statistics are expressed as both mean square (MnSq) and standardized z values. Ideally, MnSq values are 1 and standardized values are 0. We accepted MnSq values ≤1.5 and z scores ≤2.0 (Wright & Linacre, 1994). Item fit statistics greater than the acceptable values reflect erratic scoring, suggesting either that raters misinterpreted the question or that the item does not belong to the construct. Nonetheless, we examined any item with fit statistics outside the acceptable range to determine the best course of future action (i.e., deletion or clarification). A logical item hierarchy reflects theory related to the construct (i.e., coping); logic of the hierarchy is an important, albeit nonstatistical, indicator of construct validity.
In addition to the Rasch analysis, Winsteps produces a PCA of residuals that reveals unexpected scoring patterns (i.e., children with unexpectedly high scores on difficult items and unexpectedly low scores on easy items or vice versa). We checked any contrast with an eigenvalue ≥3 or significant unexplained variance (i.e., >40%) for evidence of additional dimensions in the data (Linacre, 2015a). To be suggestive of an additional dimension, a contrast had to reflect an identifiable pattern of children (e.g., boys compared with girls, children from one school compared with another) or items (e.g., items from the Coping With Self vs. Coping With Environment categories). As the average score awarded to each item increases (in this case, from 1 to 5), the average measure of children receiving that item score also should increase. This progression reflects the extent to which a basic assumption of the Rasch model is met: Children with better coping abilities are more likely than children with poorer coping abilities to get high scores on difficult items. Moreover, if an item is to be useful for separating children into levels of coping ability, then the average overall measure score of children receiving each item score, from 1 to 5, should differ substantially.
We used an item:person map to examine the match between the ranges of item difficulty and child ability. This also provided an indication of the precision of measurement for individual children. We checked for gaps along the item hierarchy that would result in decreased precision of measurement of children at the corresponding ability level (Boone, 2016). When multiple items were at the same difficulty level, we checked for redundancy (i.e., items offering similar information).
To examine internal reliability, we considered item reliability indexes (a Cronbach’s α equivalent) and item error estimates. We calculated the number of strata (i.e., levels of coping ability) identified in the data from the separation index. To be internally reliable, the CI must separate children into at least two strata levels. Number of strata (H) is calculated as follows: H = (4G + 1)/3, where G is the separation index value (Wright & Masters, 1982). We accepted a person reliability index of ≥.80 as sufficient evidence for internal reliability of this type of measure (Linacre, 2015b). We also sought small item errors (≥.25) to indicate that the item measure scores are a relatively precise estimate of the true score.
To examine interrater reliability, we calculated Pearson product–moment correlations and ICCs between CI 1 and CI 2 scores. We also constructed Bland–Altman plots and computed paired t tests for each like CI item. We examined normality of the data with the Shapiro–Wilk test because this test provides the greatest power in assessing distribution (Ghasemi & Zahediasl, 2012). Data from all variables were normally distributed. Therefore, to assess relationships between scores from the two test administrations, we calculated Pearson’s correlation coefficients and ICCs on the raw data. To assess differences between test administrations, we calculated Bland–Altman statistics and paired t tests for each item. Bland–Altman statistics provide a more accurate representation of agreement between two tests than correlation coefficients (Berchtold, 2016). To test for the effect size of the differences, we calculated Cohen’s d. We interpreted effect sizes as small (d ≤ .20), medium (d = .30–.50), or large (d ≥ .80; Cohen, 1988). We used IBM SPSS Statistics (Version 22; IBM Corp., Armonk NY) to analyze data and set significance levels at p < .05.
Results
All point-measure correlations were positive. Coefficients ranged from .37 to .85.
Fit statistics from three items (6%)—Coping With Self–Active Q1 and Coping With Environment–Active Q6 and Q1—were outside the acceptable range. Data from the remaining 45 (94%) items conformed to the expectations of the Rasch model (Table 2). We deemed the scale structure to progress appropriately (i.e., higher item scores were associated with higher child measures and lower item scores with lower child measures). There was a notable increase in the average overall measure scores of children who received each item score between 1 and 5. The agreement between observed and expected average measure for each category was high (M dif = .06), and all MnSq fit statistics were near 1.0 (M = 1.02).
Item Goodness-of-Fit Statistics and Point-Measure Correlations (Ordered by Most to Least Misfitting)
Note. CWEA = Coping With Environment–Active; CWEF = Coping With Environment–Flexible; CWEP = Coping With Environment–Productive; CWSA = Coping With Self–Active; CWSF = Coping With Self–Flexible; CWSP = Coping With Self–Productive; MnSq = mean square; Zstd = standardized z.
Goodness-of-fit statistics outside the desired range.
Figure 1 illustrates the children’s coping abilities mapped against item difficulty. Items at the top are the most difficult, and children at the top of the figure had the highest CI scores. Children were very likely to pass items below their ability level and very unlikely to pass those above; they had a 50/50 chance of passing items at their ability level. Overall, there was a good match of item difficulty and child coping ability for children with relatively good coping abilities; only 4 children had ability levels higher than the most difficult item. However, there was less precise measurement for children with poor coping ability. The ability levels of 26 children at the bottom of the hierarchy were lower than the difficulty level of the easiest item. Figure 1 also indicates that many items are at the same level of difficulty, which may suggest that some questions could be removed from the CI because of redundancy, particularly items that represent the same category and dimension.
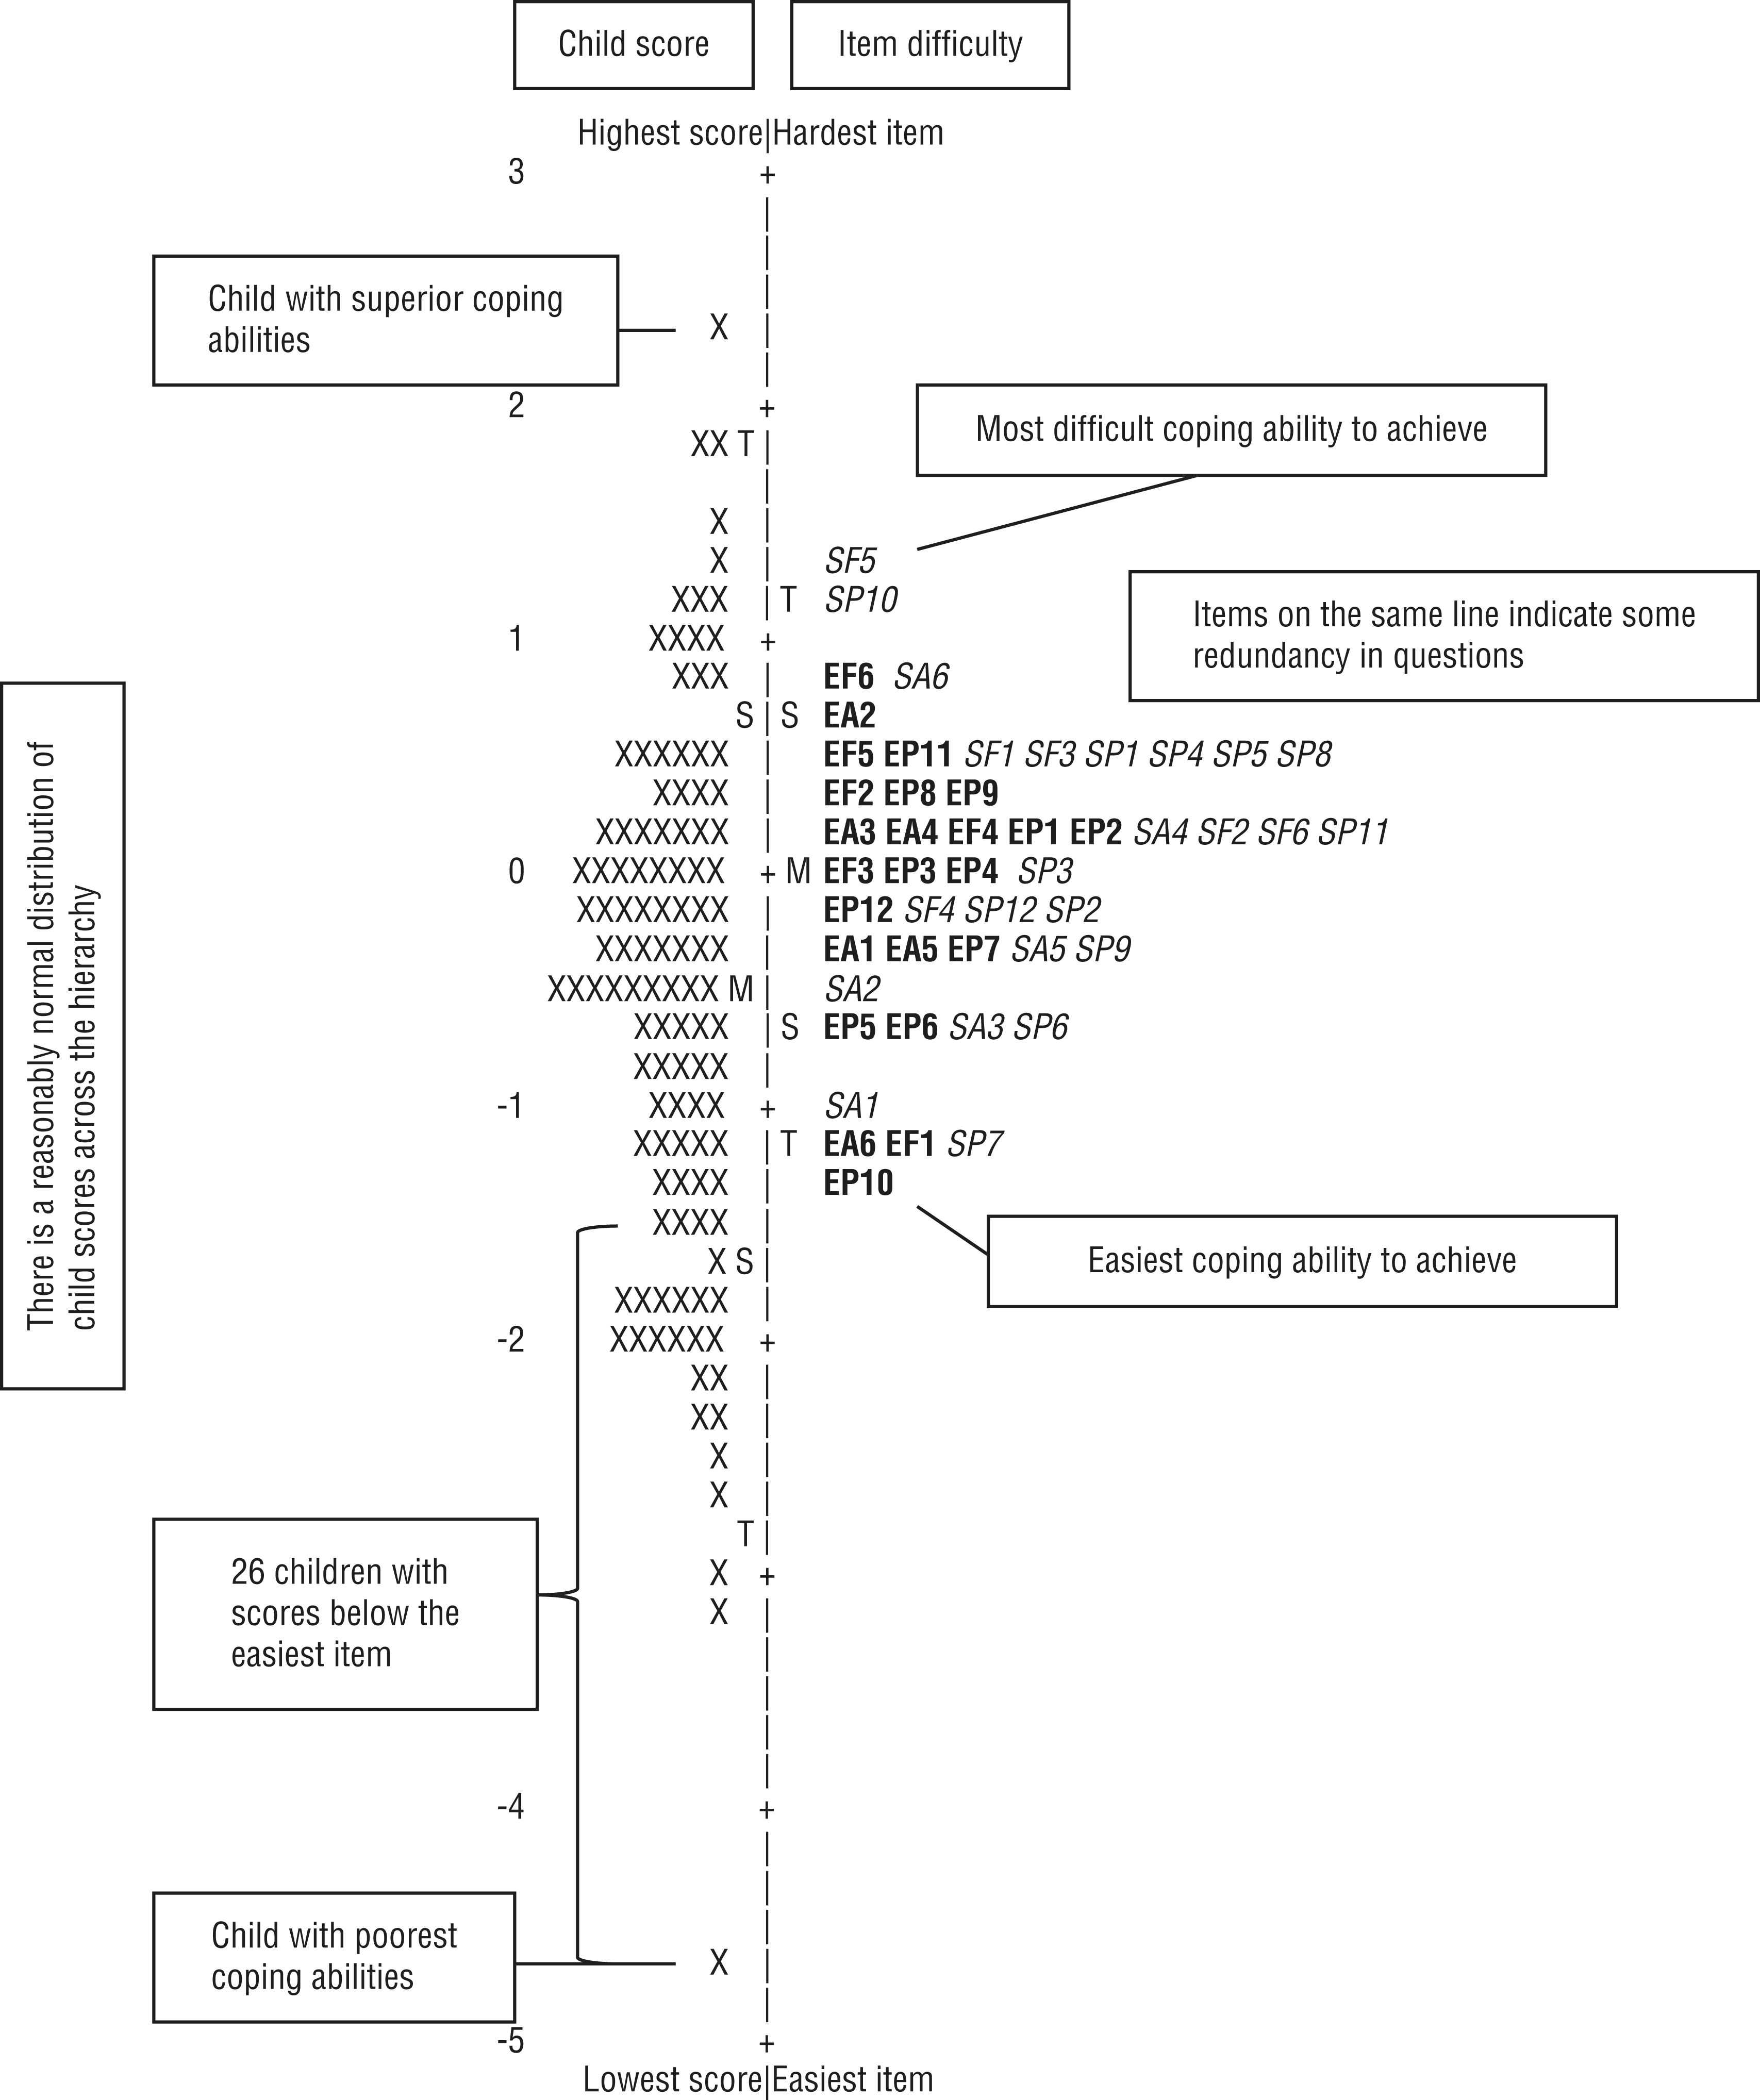
Hierarchy of persons and items.
The PCA indicated that the amount of unexplained variance was relatively high (47.7%), and the strength of the first contrast was 4.3 eigenvalue units, suggesting the presence of a second dimension in the data. The strength of any second dimension would be about four items. The first (strongest) contrast appears to separate children by school. The major difference between the schools was diagnosis; School 1 was for children with intellectual disabilities and/or ASD, whereas School 2 was only for children with ASD.
Item difficulty appears to progress logically. The most difficult items are from the Coping With Self category, which asks about impulsivity and the ability to manage anxiety and high-stress situations. The easiest items are from the Coping With Environment category, which asks about the capacity for fun and pleasure and acceptance of support from others.
The person separation index is 5.27, which translates into 7.36 strata, indicating that the CI separated the sample into more than seven levels of coping ability. The reliability index (Cronbach’s α equivalent) was .97. Standard errors for all items were less than .16.
A one-way random effects model ICC of ABI scores yielded an average ICC of .96 (95% confidence interval [0.93, 0.97]), F(72, 72) = 22.3, p < .001. Moreover, raw scores from all 48 questions correlated significantly (e.g., ABI r = .92, p < .001), and none differed significantly between CI 1 and CI 2 (e.g., ABI t = 0.83, p = .33). Effect sizes were small (e.g., ABI d = 0.03), indicating very little standardized difference between the mean scores on any question. Taken collectively, these findings suggest a close association between overall CI 1 and CI 2 scores (Table 3). We used ABI scores for CI 1 and CI 2 to construct the Bland–Altman plot. Data from only 4 of the 73 children (<5.5%) fell outside the desired range of agreement between the 2 tests, again suggesting excellent agreement between scores on CI 1 and CI 2.
Associations and Differences Between the Two Coping Inventory Administrations
Note. ABI = Adaptive Behavior Index; CWEA = Coping With Environment–Active; CWEF = Coping With Environment–Flexible; CWEP = Coping With Environment–Productive; CWET = Coping With Environment total score; CWSA = Coping With Self–Active; CWSF = Coping With Self–Flexible; CWSP = Coping With Self–Productive; CWST = Coping With Self total score; Self + Env = Coping With Self total score + Coping With Environment total score.
p < .001.
Discussion
This is the first study in more than 30 yr to examine the psychometric properties of data gathered with the CI (Zeitlin, 1985). Using Rasch analysis, with few exceptions, we found that data gathered with the CI demonstrated good evidence for construct validity and internal and test–retest reliability. We discuss that evidence first, then provide recommendations for possible revisions to strengthen the CI.
Data from 45 of the 48 CI items (94%) conformed to the expectations of the Rasch model. This result was only slightly lower than the desired 95% and thus provides reasonable evidence for a unidimensional construct. Nonetheless, we examined each of the three nonconforming items in detail. Unacceptably large goodness-of-fit statistics occur when scoring is erratic (i.e., sometimes larger than expected, given a child’s overall score, and sometimes smaller). Erratic scoring suggests either that the item is not part of the construct and should be removed or that raters understood the items differently; the latter means that item clarity should be improved. We consider the likely cause of the poor fit for the three items and the best course of subsequent action later in this section.
The order of the hierarchy of items revealed by Rasch analysis provided additional evidence for the construct validity of data gathered with the CI. More than one-third (10 of 29) of the most difficult items (i.e., those at or above the mean item difficulty level) reflect flexible (vs. rigid) coping strategies. Children with ASD often have difficulty shifting thoughts or actions in response to change (Hill, 2004). This apparent difficulty with coping is evident in social interactions and daily activities (Geurts et al., 2009). The ability to react flexibly in different situations depends in part on the ability to inhibit undesirable or inappropriate behaviors (Gligorović & Buha Ðurović, 2014). Therefore, it is not surprising that items reflecting flexibility were relatively difficult for our sample. The easiest item was from the Coping With Environment–Productive category, an item assessing a child’s capacity for fun and pleasure. This supports the findings of Eversole et al. (2016), who found similar levels of enjoyment in many activities between children with autism and typically developing children.
In terms of internal reliability and, more important, for measurement purposes, the CI separated our sample of children with developmental disabilities into more than seven levels of coping ability. These findings support the CI as a reliable measure likely to be sensitive to change. However, the coping abilities of four of the most able children were beyond those of even the most difficult item. Although this finding may not be of concern (i.e., the more able children may have adequate coping skills to meet everyday needs), the skills of the 26 children at the bottom of the hierarchy were not great enough to pass even the easiest item. This is indeed of concern because children with the poorest coping abilities are those in greatest need of intervention. The lack of very easy items means that measurement for children with very low coping abilities is imprecise and suggests that the CI will not be sensitive to change in those children. This finding may not be unexpected considering that the original CI was field tested on a sample of 1,119 children, of whom only 132 had a developmental disability (i.e., emotional, neurological, intellectual, or learning). However, it suggests that further research is needed to create additional, very easy items to assess children with very poor coping abilities.
We examined the three items that failed to conform to the expectations of the Rasch model to make suggestions regarding the need for revision of the CI. The three poorly fitting items are based on a child’s (1) anger, (2) energy levels, and (3) gross and fine motor skills. The first two items seem clearly associated with coping, and thus should remain in the CI, but they may require clarification. Our sample included children with ASD and/or intellectual disability, and all had communication difficulties. Raters may have had difficulty reliably scoring the effectiveness of children’s showing others when they are angry because their reference for “effectiveness” differed. Some raters may have compared a particular child with classmates, thinking the child expressed his or her feeling pretty well, considering his or her developmental disability, whereas others may have used typically developing peers as the reference. Alternatively, school staff may have avoided situations in which children became angry and thus may have disagreed about what constitutes an effective expression of anger.
The second item that failed to conform to the Rasch expectations, regarding energy levels, may have yielded erratic scoring for slightly different reasons. Although the protocol sheet has a clarifying phrase to assist with scoring (e.g., low energy vs. good energy), raters may nonetheless have been confused about what the item actually assesses. We recommend that future researchers modify the wording of this item and the item about expression of anger to increase their clarity.
The third item, addressing gross and fine motor skills, does not seem to be part of the coping construct. Rather than being a coping skill per se, difficulties with motor skills may require improved coping skills. This logic suggests the item is outside the construct of coping and should be removed from the CI. A preliminary analysis in which we removed this item did not result in major differences with the other findings.
The item map shown in Figure 1 shows that some items appear to have the same level of difficulty. Considering this possible redundancy of content together with the fact that the CI is a relatively long test, we believe that future researchers should consider removing some items to create a shortened CI without reducing its psychometric properties. A briefer version may be more suitable, especially when time constraints pose a limitation (e.g., for research purposes). Indeed, anecdotal evidence from our research indicates that educators who completed multiple CIs expressed displeasure at the time required for each. On the basis of Figure 1, we assessed items on the same line of difficulty that appear to be asking the same question and highlighted the following items that have the lower point correlations as potential items to delete: SA1, EA6, SP3, EA1, SA3, EA5, EP12, SF4, SP2, EP4, EA4, EF4, SF6, SP11, EF2, EF5, SF3, SP1, SP4, and SP5. Future researchers should test the psychometric properties of data gathered with the remaining items.
Despite the results of the factor analysis, which indicated that all CI items loaded on a single factor, Zeitlin (1985) divided the CI into two sections: Coping With Self and Coping With Environment. And although much of our analysis supports the unidimensionality of the CI, our PCA suggests the possibility of a second dimension in the data. The items providing the contrast primarily were Coping With Self versus Coping With Environment items; thus, it is possible that those two categories actually do reflect two dimensions. However, after examining the content of the individual items and children providing the major contrast, we suspect that the contrast may separate children with ASD and intellectual disability from children with only intellectual disability. If that were the case, it provides evidence that the CI item hierarchy differs for children with different types of disability. Future researchers may want to examine the extent to which this is the case. Such differences, if they are found, could contribute to more targeted interventions. However, they might also suggest the need for different scoring for children with different diagnoses. Although the eigenvalue associated with the first contrast from the PCA was larger than desired (4.3), it suggests that a second dimension is the strength of only about four items. Thus, the evidence is not overwhelming.
Limitations
This study relied on a convenience sample, and all students whose parents provided informed consent at the chosen schools were included in the analysis. This study was conducted using data from children with ASD and intellectual disabilities between the ages of 5 and 13 yr. The results may not be generalizable to typically developing children, to children with other developmental disabilities, or to children younger or older than those in this sample. The data were collected in only one country, and cultural differences and opportunities that influence coping behaviors may differ among nationalities. Future research is clearly needed.
Implications for Occupational Therapy Practice
Evidence for acceptable construct validity and reliability of data generated with the CI is helpful to occupational therapy practitioners looking for ways to examine the effects of intervention on children with developmental disabilities. The CI demonstrated good evidence for construct validity and internal and test–retest reliability. However, redundancy of items suggests that some items could be eliminated on the basis of future research. The findings of this study have the following implications for occupational therapy practice:
The CI is suitable for measuring coping behaviors in children with developmental disabilities and can be used reliably as a pre–post assessment for interventions.
The PCA suggested the possibility of a second dimension in the data of the strength of about four items. This result may reflect diagnostic differences in participants from the two schools.
Redundancy of some items and poor fit of some items to the Rasch model suggest that the CI could potentially be abbreviated to create a more parsimonious set of items.
Conclusion
The CI demonstrated good evidence for construct validity and internal and test–retest reliability. Therapists can thus use it with confidence in practice with children with autism and intellectual disabilities. However, redundancy of items suggests that some could be eliminated after further research.
Footnotes
Acknowledgments
We acknowledge the two schools involved in this project and the time taken by the staff to complete the Coping Inventory with students. This study was funded by the Australian Research Council as part of the Sydney Playground Project–Levelling the Playing Field. The trial was registered with the Australian and New Zealand Clinical Trials Registry (ACTRN12614000549628). We declare that there is no conflict of interest.