





Abstract
Client-centered care is an integral aspect of occupational therapy practice. The term client-centered care has historically been used in the field to describe care that encompasses shared decision making and collaboration throughout the therapeutic process (Mroz et al., 2015). Delivery of client-centered care is dependent on the client’s ability to engage in the decision-making process and the therapist’s ability to include the client in the decision-making process (Maitra & Erway, 2006). The therapist’s ability to effectively engage the client during goal setting may be particularly important, and discrepancies in the therapist’s and the client’s goals have been reported as a barrier to implementation of client-centered care in occupational therapy (Sumsion & Smyth, 2000). One way to address this barrier in practice is through increased utilization of client-centered assessment measures of occupational functioning that can be used to support client engagement and participation in the goal-setting process.
Version 2.2 of the Occupational Self-Assessment (OSA 2.2; Baron et al., 2006) is a self-report measure that can be used to guide client-centered goal setting and intervention planning in occupational therapy. The OSA 2.2 was developed on the basis of Kielhofner’s Model of Human Occupation (Taylor, 2017), a framework for understanding occupation through the person’s volition (i.e., motivation for doing), habituation (i.e., routines and habits), performance capacity (i.e., subjective and objective perception of ability), and environmental context (e.g., social, physical). The OSA 2.2 is a three-part assessment of the client’s subjective rating of occupational competence (i.e., ability to participate in everyday occupations), value (i.e., perceived importance), and prioritization of self-identified goals.
Research examining the psychometric properties of the OSA 2.2 has suggested that the instrument has good structural validity, internal consistency, and sensitivity to detect differences in individual ability levels (Kielhofner et al., 2009; Taylor et al., 2011). Evidence has also suggested that the scores obtained from the OSA 2.2 can be used to track clients’ progress over time (Kielhofner & Forsyth, 2001; Taylor et al., 2011). The client-centered and collaborative nature of the OSA 2.2 administration can support collaboration between the therapist and the client across all stages of the occupational therapy process, including gathering of the occupational profile, analysis of occupational performance, development, implementation and evaluation of the intervention plan, and evaluation of intervention outcomes.
Despite these findings, research examining the utility of the OSA 2.2 in inpatient rehabilitation has not been carried out to date. On the basis of clinical experience and observations of the therapist and participants in our ongoing research, the length of administration time may be considered as a barrier to implementation of the OSA 2.2 in fast-paced rehabilitation settings. Given the mounting evidence for the reliability and validity of the OSA 2.2, justification exists for development of a short-form version for use in inpatient rehabilitation.
The purpose of this study was to develop and validate an OSA–Short Form (OSA–SF) using Rasch analysis. Specifically, in this study, we aimed to evaluate (1) validity of the OSA–SF through examination of rating scale functioning, dimensionality, item and person goodness of fit, item targeting, and item hierarchies and (2) reliability of the OSA–SF through examination of item- and person-separation reliability.
Method
The OSA–SF was developed through iterative item removal and evaluation of psychometric properties of the revised questionnaire in comparison with the OSA 2.2. The study was approved by the institutional review board at the University of Illinois at Chicago.
Participants
In our convenience sample, 220 adults were invited to participate in the study. Participants were screened on the basis of their medical status and ability to provide informed consent. The participants had to be 18–90 yr old, able to communicate in English, and referred for occupational or physical therapy in acute care or acute inpatient rehabilitation. Many prospective participants were excluded because of cognitive deficits, self-reported fatigue, or pain. After consent and inclusion–exclusion screening, 86 (39.1%) participants completed the OSA 2.2 questionnaire. This sample was deemed sufficient for this exploratory work on the basis of the minimum recommended sample size of 50 people for polytomous data (Linacre, 1994).
Participant ages ranged from 27 to 80 yr old (mean = 55.3, standard deviation = 12.0). The majority of participants identified as Black or African-American (60.4%), reported an annual household income of less than $40,000 (63.9%), and had a high school level of education or less (50.0%). Additional participant demographics are outlined in Table 1.
Participant Characteristics (N = 86)
Note. Percentages may not total 100 because of rounding.
Measures
The OSA 2.2 consists of 21 items that are rated on the 4-point Competence and Value scales (Figure 1). An option is given to cross out any items that the respondent deems not applicable. Examining the gap between the respondent’s occupational competence and value can offer insight into the respondent’s occupational satisfaction (i.e., a smaller gap between competence and value ratings indicating higher level of satisfaction; Baron et al., 2006). The final step of the OSA 2.2 administration includes goal prioritization in which the respondent identifies his or her priority areas for occupational therapy intervention. The OSA 2.2 takes between 15 and 30 min to complete, and previous research has suggested that administration time could be as low as 12.5 min (Stuber & Nelson, 2010).
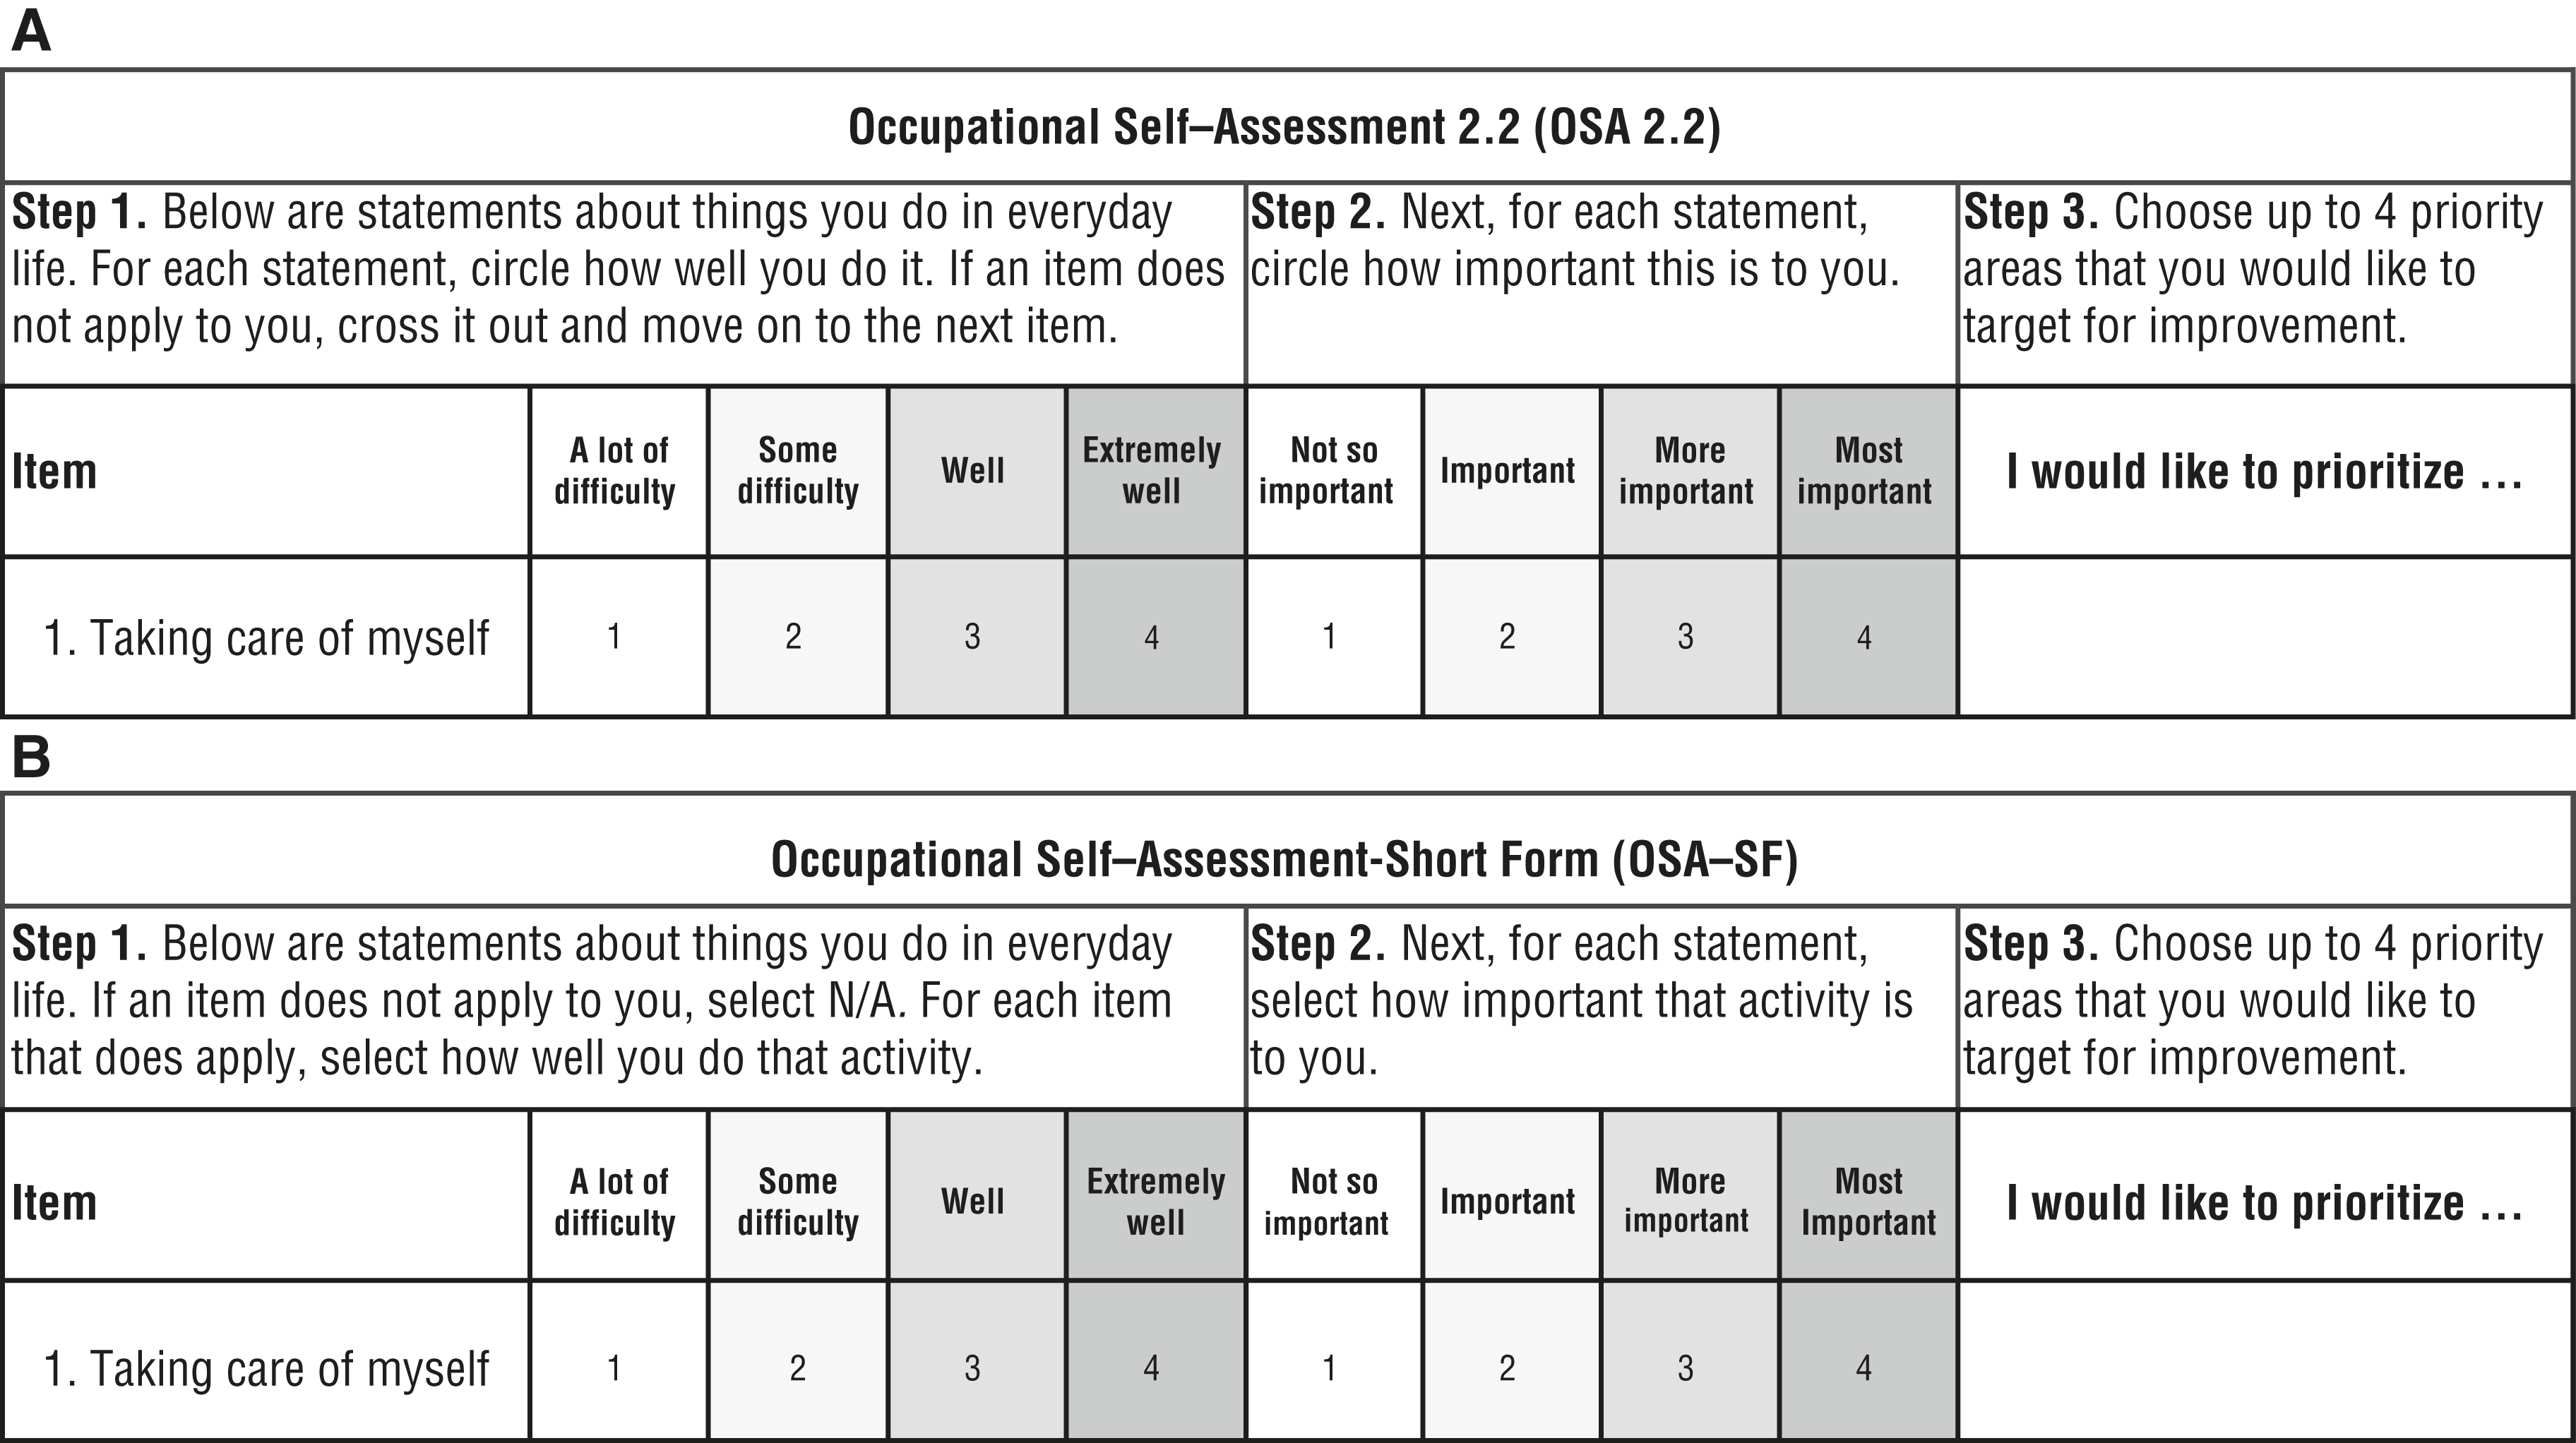
Visual depiction of (A) the layout of the Occupational Self-Assessment, Version 2.2, and (B) the revised layout of the Occupational Self-Assessment–Short Form.
Analysis
We evaluated the psychometric properties of the OSA 2.2 and OSA–SF with a partial-credit Rasch model in which we used Winsteps® (Version 3.93.0; Winsteps.com, Beaverton, OR). The OSA 2.2 and OSA–SF were both examined for validity and reliability within the context of acute care and acute inpatient rehabilitation. The original 21-item questionnaire was reduced to a 12-item OSA–SF through iterative removal of items on the basis of item-fit statistics for both scales. The instrument was evaluated at each iteration to ensure that the item reduction did not significantly compromise the validity and reliability of either the Competence or the Value scale.
Instrument Validity
Rating Scale Functioning.
Rating scale functioning was examined to determine whether the study participants used the scales as intended (i.e., on a continuum from least to most). For each rating scale response category, we expected that across all items there would be a minimum of 10 responses, the outfit mean square (MnSq) would be less than 2.0, and the categories would advance monotonically (Bond & Fox, 2015; Linacre, 2004). The rating scales that did not meet these criteria were collapsed and reanalyzed to improve rating scale functioning.
Dimensionality.
Dimensionality was examined to determine whether the instrument measured a single construct. We expected that at least 50% of raw variance would be explained by the measures and that there would be less than 5% of variance explained by the secondary dimension (Smith & Miao, 1994).
Item and Person Goodness of Fit.
Item- and person-fit statistics were examined to determine whether the items and the people performed in a manner that was consistent with the Rasch model. On the basis of recommendations for evaluating Likert scales, acceptable fit statistics were set to infit 0.6 < MnSq < 1.4 and −2.0 < infit Zstandard < 2.0 for both item and person goodness of fit (Bond & Fox, 2015). For the purpose of item reduction, the items that did not meet the item-fit expectations were removed. Consistent with a more liberal criterion outlined in previous OSA 2.2 publications, no more than 10% of the participants in the sample were expected to demonstrate person misfit (Kielhofner et al., 2009).
Item Targeting.
Targeting evaluation was conducted to examine person reliability by comparing the difference between average item difficulty and average person ability. We expected that the average item difficulty would closely match the average person ability, and the recommended cutoff criterion of 0.5 logits difference was used (Lai & Eton, 2002). Ceiling and floor effects were also examined, and the criterion was set to less than 15% of participants demonstrating the maximum, or the minimum, possible score (McHorney & Tarlov, 1995).
Item Hierarchies.
Item measure scores were used to create a visual continuum of items for the Competence and Value scales. Higher item measures indicate items that are harder to endorse (i.e., harder to receive a maximum score), whereas items with lower item measures indicate items that are easier to endorse (i.e., easier to receive a maximum score). We hypothesized that the hierarchy of the items in this study would be comparable with the item hierarchies described in the previous OSA 2.2 publications, with items related to basic activities of daily living being easier to endorse than the items related to satisfaction and enjoyment (Kielhofner et al., 2009).
Item and Person Separation Reliabilities
We expected that the item and person separation reliabilities would be 0.80 or greater (Arnadóttir & Fisher, 2008). We evaluated instrument sensitivity by converting the item and person separation indexes into strata using the following formula: [4(separation index) + 1]/3 (Wright & Masters, 1982). The strata indicate the number of distinct levels of items and people evaluated by the assessment. We expected that the instrument would be able to separate the items and the people into at least two separate levels of difficulty and competence, respectively.
Results
The 21-item OSA 2.2 was reduced to a 12-item OSA–SF (Table 2). High concurrent validity between the OSA 2.2 and OSA–SF was found for both the Competence and Value scales (r = .95, p < .001, and r = .93, p < .001, respectively). For the purpose of this study, the “not applicable” option was treated as missing data whenever endorsed by the respondent. Across the 86 participants, 3.7% of responses were missing for the Competence scale, and 4.6% of the responses were missing for the Value scale. Because the Rasch approach is appropriate for use irrespective of missing data, all participant questionnaires were included in the data analysis.
Item Infit Statistics
Note. MnSq = mean square; OSA = Occupational Self-Assessment; 2.2 = Version 2.2; SF = Short Form; Zstd = Zstandard.
Item removed from OSA 2.2 on the basis of iterative evaluation of goodness-of-fit statistics.
Misfit with the expectations of the Rasch model.
Rating Scale Functioning
Occupational Self-Assessment 2.2.
The response categories were endorsed at a rate greater than 10 observations per category, and the outfit MnSq was less than 2.0 for the Competence and Value scales. Whereas the response categories advanced monotonically for the Competence scale, category disordering was noted for the “not so important” and the “important” categories in the Value scale. Because the “not so important” category encompassed 2% of all responses and the “important” category encompassed 20% of responses, it was deemed to be most appropriate to collapse the “not so important” category into the “important” category.
Occupational Self-Assessment—Short Form.
Whereas a 4-point rating scale was retained for the Competence scale, the Value scale was reduced to a 3-point rating scale by collapsing the “not so important” category into the “important” response category. For the 4-point Competence scale and the 3-point Value scale, the response categories were endorsed at a rate greater than 10 observations per category, had an outfit MnSq less than 2.0, and advanced monotonically. To address the need for the “not important” response category, we explicitly added the “not applicable” rating option to the rating form to ensure a systematic way to identify any items that were deemed as not important, or otherwise not applicable, by the respondent.
Dimensionality
Occupational Self-Assessment 2.2.
For the Competence scale, the Rasch model explained 42.0% of the variance, with the secondary dimension explaining 7.7% of the total variance. For the Value scale, the Rasch model explained 39.0% of the variance, with the secondary dimension explaining 7.1% of total variance.
Occupational Self-Assessment—Short Form.
For the Competence scale, the Rasch model explained 46.3% of the variance, with the secondary dimension explaining 8.2% of the total variance. For the Value scale, the Rasch model explained 37.2% of the variance, with the secondary dimension explaining 8.0% of total variance.
Item and Person Goodness of Fit
Occupational Self-Assessment 2.2.
Of the 21 items, 9.5% of the Competence items and 16.0% of the Value items misfit the expectations of the Rasch model (see Table 2). Of the 86 participant surveys, 17.4% of people demonstrated misfit for the Competence scale, and 4.5% demonstrated misfit for the Value scale.
Occupational Self-Assessment—Short Form.
On the basis of greater than expected item misfit, a total of 9 items were removed to form the proposed 12-item OSA–SF measure. As a result of item removal, 0% of the Competence and Value items misfit the expectations of the Rasch model (see Table 2). Of the 86 participant surveys, 10.5% of people demonstrated misfit for the Competence scale, and 4.6% demonstrated misfit for the Value scale.
Item Targeting
Occupational Self-Assessment 2.2.
The difference between the average item difficulty and the average person ability was 0.8 logits for the Competence scale and 1.72 logits for the Value scale. There was no evidence for ceiling or floor effects, with less than 2% of participants scoring the maximum possible score, and 0% scoring the minimum possible score on the Competence and Value scales.
Occupational Self-Assessment—Short Form.
The difference between the average item difficulty and the average person ability was 0.97 logits for the Competence scale and 0.93 logits for the Value scale. There was no evidence for ceiling or floor effects, with less than 2% of participants scoring the maximum and minimum possible scores on the Competence and Value scales.
Item Hierarchies
Occupational Self-Assessment 2.2.
Although not identical, the item hierarchies for both the Competence and Value scales were comparable with previous findings reported by Kielhofner et al. (2009), and the items related to basic activities of daily living were easier to endorse than the items related to satisfaction and enjoyment (Table 3).
Occupational Self-Assessment, Version 2.2, Item Hierarchies
Occupational Self-Assessment—Short Form.
The item hierarchies for the Competence and Value scales did not change as a result of item removal (see Table 3).
Item Separation Reliability
Occupational Self-Assessment 2.2.
Item separation reliability for the 21-item Competence and Value scales was 0.88 and 0.80, respectively. The item separation index was 2.68 for the Competence scale and 2.03 for the Value scale, suggesting that the items on both scales could be separated into three distinct strata (i.e., groups).
Occupational Self-Assessment—Short Form.
Item separation reliability for the 12-item Competence and Value scales was 0.85 and 0.82, respectively. The item separation index was 2.43 for the Competence scale and 2.12 for the Value scale, suggesting that the items on the Competence and Value scales could be separated into three distinct strata.
Person Separation Reliability
Occupational Self-Assessment 2.2.
Person separation reliability for the 21-item Competence and Value scales was 0.88 and 0.82, respectively. The person separation index was 2.77 for the Competence scale and 1.94 for the Value scale, suggesting that the Competence scale could separate people into four strata, whereas the Value scale could separate people into two strata.
Occupational Self-Assessment—Short Form.
Person separation reliability for the 12-item Competence and Value scales was 0.84 and 0.68, respectively. The person separation index was 2.29 for the Competence scale and 1.44 for the Value scale, suggesting that the Competence scale could separate people into three distinct strata, whereas the Value scale could separate people into two strata.
Discussion
In this study, we aimed to develop and evaluate a 12-item OSA–SF using Rasch analysis. The OSA–SF Competence and Value scales both functioned in a manner similar to what has previously been reported for the OSA 2.2 (Kielhofner et al., 2009). The findings offer preliminary support for the validity and the reliability of the OSA–SF as a measure of occupational competence and value in acute care and acute inpatient rehabilitation.
Occupational Self-Assessment—Short Form Competence Scale
The original four-item Competence scale functioned as expected and was retained. The scale demonstrated excellent item goodness of fit and good person goodness of fit, supporting the construct validity. However, the level of variance explained was lower than originally expected and warrants further examination of instrument unidimensionality. The Competence scale demonstrated low floor and ceiling effects and was able to separate the items and people into three distinct groups with good reliability. Although these findings suggest that the scale could be used to distinguish between different competence levels, evaluation of item targeting demonstrated that it was easy for respondents to score high on the OSA–SF Competence scale.
Occupational Self-Assessment—Short Form Value Scale
The evaluation of the Value scale functioning suggested that the original scale should be reduced to three rating categories. This finding could be explained by the need for further revision and testing of the Value scale categories, the high level of value the participants placed on the items included in the OSA, and the possibility that items that were not valued by the respondents were deemed as not applicable and were counted as missing data. To ensure that the respondents were able to systematically identify items that were not important, or not applicable, to their everyday life experience, we added a “not applicable” category to the final version of the OSA–SF.
The Value scale demonstrated excellent item and person goodness of fit, supporting construct validity. However, the level of variance explained was much lower than originally expected, suggesting that the scale may be measuring more than one dimension. Similar to the Competence Scale, the Value scale demonstrated low floor and ceiling effects and was able to separate the items into three distinct groups with good reliability. Although the Value scale could separate participants into two distinct groups, person reliability was low. Consistently, evaluation of item targeting demonstrated that it was easy for respondents to score high on the Value scale. These findings suggest that the OSA–SF Value scale may not be as sensitive to individual differences as the OSA–SF Competence scale.
Limitations
A major limitation of the current study is the small sample size. The data were gathered from a convenience sample of people who were willing and able to participate in the study during their acute care and acute inpatient rehabilitation stay. Participation in the study was voluntary, and it is likely that those who agreed to participate in the study had a higher functional status than those who were screened out or were eligible but declined to participate. As such, it is highly likely that this sample is not representative of the full realm of people receiving acute care and acute inpatient rehabilitation services. These sampling limitations also pose a challenge for generalization of these findings to other occupational therapy settings.
The decision to collapse the “not so important” and “important” rating categories for the Value scale poses another limitation. Although the meaning of these categories is inherently different, this decision was based on improvements noted in the rating scale functioning after these categories were collapsed. However, instrument validity may have been affected by this decision, and additional research examining the psychometric properties of OSA–SF is warranted.
Recommendations for Future Research
Additional research is necessary to further evaluate instrument validity, reliability, and utility within a more substantial and heterogeneous population of occupational therapy clients. This type of research is particularly important to ensure that those with lower levels of occupational competence and value are adequately represented. The findings from the current study also highlight the need for additional work aimed at improving the functioning of the Value scale. Alternate versions of the rating categories should be tested to determine the most appropriate rating categories for the OSA–SF Value scale. In addition, future work should focus on examining the clinical utility and benefits of integrating the OSA–SF into practice.
Implications for Occupational Therapy Practice
This study provides preliminary support for reliability and validity of the OSA–SF as a client-centered assessment of perceived occupational competence and value in acute care and acute inpatient rehabilitation. The results of this study have the following implications for occupational therapy practice:
The OSA–SF is a client-centered, self-report measure of the client’s perceived occupational competence and value.
The OSA–SF can be used in clinical practice to guide goal setting and intervention planning.
Conclusion
With the ever-increasing focus on client-centered care in hospital-based rehabilitation settings, it is essential that occupational therapy practitioners be equipped with valid and reliable client-centered outcomes that can guide client-centered goal setting and intervention planning. The findings of the current study suggest that the OSA–SF has adequate validity and reliability and is comparable with the original OSA 2.2.
Footnotes
Acknowledgments
We thank our clinical partners, Kay McGee and Melissa Lara, for assisting us with participant recruitment. We also thank our research assistants, Jenna Colangelo, Kaitlin Ibara, and Ariana Rodriguez.