





Abstract
Attention deficit hyperactivity disorder (ADHD) is a common neurodevelopmental disorder, characterized by inappropriate levels of inattention, hyperactivity, and impulsivity (American Psychiatric Association, 2013). Evidence from the past 2 decades supports an association between ADHD and driving deficits, which may lead to unintentional injury on the road (Barkley & Cox, 2007; Cox et al., 2000; Fuermaier et al., 2017; Groom et al., 2015; Jerome et al., 2006; Ratzon et al., 2017). Cognitive abilities—specifically, those frequently associated with ADHD—have been found to affect driving performance (Classen et al., 2013). Inattention and distractibility, two of the primary deficits of ADHD, were found by Treat et al. (1979) to be major causes of motor vehicle collisions. Deficits in executive functions and risk estimation have also been suggested to underlie risky driving habits, especially in young drivers (McKnight & McKnight, 1993, 2000; Ryb et al., 2006). The driving performance of adults with ADHD has been shown to be more negatively affected by distraction and fatigue than that of neurotypical control drivers (Reimer et al., 2007, 2010).
Medical standards define minimum visual qualifications for drivers to ensure safe driving. These standards include key visual measures for fitness to drive (visual acuity and the extent of field of vision; American Geriatric Society & Pomidor, 2015; European Council of Optometry and Optics, 2017). However, safe driving also involves extensive visual exploration, which consists of a series of rapid eye movements shifting the gaze from one fixated location to the next at a rate of approximately 1–3 times per second. In natural viewing conditions, when there are no explicit requirements regarding eye movements, fixation locations are thought to reflect the locus of spatial attention. Therefore, patterns of eye movement and fixation maps are often used to estimate attentional orienting in free-viewing conditions, such as driving.
Previous studies showed various abnormal characteristics in the eye movements of people with ADHD (Dankner et al., 2017; Fried et al., 2014; Munoz et al., 2003). Despite this, and despite the known importance of eye movements to attentional shifts and driving performance, only two studies have examined gaze patterns during simulated driving in adults with and without ADHD (Groom et al., 2015; Michaelis et al., 2012), and both found no differences in fixation characteristics between these groups. In this study, we hypothesized that participants with ADHD and neurotypical participants would differ in fixation characteristics during driving but that these differences have not been revealed in previous studies because of three methodological weaknesses. First, Michaelis et al.’s (2012) study included only 5 participants per group and was underpowered to reveal group effects; second, Groom et al.’s (2015) study was performed with an eye-tracker of relatively low spatial resolution and sampling rate; and third, both studies were performed with adult drivers of varying driving experiences, some of whom may have learned to compensate for their driving deficiencies through experience, thus reducing differences between the groups.
In this study, the eye movements of adolescents with and without ADHD were monitored with a high-resolution eye-tracker while they were operating a driving simulator. Participants were all below driving age in Israel and had no behind-the-wheel driving experience. We hypothesized that visual exploration during simulated driving in inexperienced drivers would be less effective in participants with ADHD than in neurotypical participants. We predicted that this effect would be evident in longer fixations and more spatially restricted fixation maps in participants with ADHD.
Method
Participants
Data were collected from 34 adolescent participants (ages 15–17 yr) who received monetary compensation for participating. The participants were recruited through posts in relevant Facebook groups and ads published in five high schools. One participant with ADHD was excluded from all analyses because of low-quality recording of his gaze position by the eye-tracking device. Two control group participants were excluded from the main analysis because they scored high on an ADHD symptoms questionnaire (the Revised Conners’ Parent Rating Scale [CPRS–R]; Conners et al., 1998), but they were included in the sensitivity analysis. The scores of the 2 excluded participants (57 and 58) were within the non-ADHD range of the CPRS–R (<65) but were outliers relative to their group (whose range was 9–21). The remaining participants made up two groups: the ADHD group, which consisted of 16 participants (10 girls, 6 boys; mean [M] age = 16.1 yr, standard deviation [SD] = 0.25, range = 15.83–16.58), and a neurotypical (control) group, which consisted of 15 participants (7 girls, 8 boys; M age = 16.13 yr, SD = 0.23, range = 15.75–16.58).
All participants were healthy, with no history of neurological disorders other than ADHD, and with normal or corrected-to-normal vision (based on self-report). All participants attended a regular high school. Participants were included in the control group only if they reported not having a diagnosis of ADHD. Participants with ADHD were included in the study only if they had previously been diagnosed by a qualified professional on the basis of the criteria set forth in the Diagnostic and Statistical Manual of Mental Disorders (5th ed.; American Psychiatric Association, 2013) and provided proof of this diagnosis. Participants in the ADHD group consistently reported having ADHD-like symptoms and scored higher on the CPRS–R than participants in the neurotypical group, after excluding the two outliers, t(29) = 35.56, p < .01 (ADHD group: M = 70.37, SD = 4.54, range = 65–79; neurotypical group: M = 13.8, SD = 4.3, range = 9–21).
None of the participants in the neurotypical group and 5 of the participants in the ADHD group reported having learning disabilities other than ADHD. None of the neurotypical participants and 6 of the participants with ADHD had received occupational therapy. None of the participants were being treated with psychostimulants during the time of the experiment, and none had any driving experience because they were all under driving age in Israel. Experiments were conducted with the written consent of participants and their parents. The protocol was approved by the Tel Aviv University ethics committee.
Simulator
Participants were tested on a driving instruction simulator (3D-Fahrschule; Besier 3D-Edutainment, Wiesbaden, Germany). The simulator scene was displayed on a 24-in. ASUS VG248QE LCD monitor (ASUS, Taipei, Taiwan) and controlled with a steering wheel and gas and brake pedals. The dashboard and rearview mirror were presented on the screen. The driving simulator scenario included driving in a parking lot and then on an urban road, including several different routine driving events (e.g., traffic lights, stop signs, crossing pedestrians, and approaching cars). The simulator provided detailed scores for various driving violations: failures to yield, traffic light violations, speeding, pedestrian hits, wrong turns, wrong signaling, and missed stop signs. An observer, blind to group categorizations, watched all individual simulator recordings and marked the time intervals when the vehicle was stationary or mobile (see the next section for the rationale for this decision). Time periods in which a central text message was displayed were removed from analysis.
Eye Tracking
Eye movements were monitored monocularly using a remote infrared video-oculographic system (Eyelink 1000 Plus; SR Research Ltd., Oakville, Ontario), with sampling rate of 1000 Hz. On the basis of manufacturer report, the parameters of this system using remote mode and no headrest are as follows: spatial resolution <0.05° root mean square and <0.5° average accuracy.
Raw gaze positions were converted into degrees of visual angle, based on a 9-point grid calibration that was performed at the beginning of each experimental session. Fixation intervals and locations were identified on the basis of the Eyelink’s software. We estimated the constraints imposed by a previous fixation location on the location of the next fixation by calculating the entropy of fixation locations. Calculation of vertical and horizontal entropy (randomness) for each participant was based on a previous publication (Althoff & Cohen, 1999) and performed on a grid of 100 × 100 cells covering the screen.
To evaluate whether the observed effects were due to actual driving (i.e., operating the simulated vehicle) or to general exploratory behavior while on the road (i.e., when the vehicle is stationary such as during a red traffic light), we included vehicle mobility (stationary vs. mobile) as a factor in the analysis. Statistical analyses of fixation characteristics were based on a series of two-way analyses of variance (ANOVAs), each on its corresponding dependent measure (fixation location, duration, variance, or entropy), with factors Group (ADHD vs. neurotypical) and Vehicle Mobility (stationary vs. mobile). For each measure, we examined the two main effects and their interaction. In addition, we estimated the discriminability of the examined fixation characteristics in classifying ADHD symptoms by examining the area under the receiver operating characteristic (ROC) curve.
Results
Simulator Driving
Participants in the ADHD group showed reduced driving performance on all measured parameters, including increased failures to yield, t(29) = 4.12, p < .01; wrong signaling, t(29) = 6.36, p < .01; traffic light violations, t(29) = 7.26, p < .01; speeding, t(29) = 6.42, p ≤ .01; pedestrian hits, t(29) = 4.5, p < .01; and missing stop signs, t(29) = 5.97, p < .01 (Table 1).
Simulator Driving Performance
Note. All the measured traffic violations differed significantly between groups at p < .01. ADHD = attention deficit hyperactivity disorder; M = mean; SD = standard deviation.
Dashboard Dwell Time.
Observing the simulator videos (see supplemental videos, available online at http://otjournal.net; navigate to this article, and click on “Supplemental”) revealed that more than half of the participants with ADHD (and none of the neurotypical participants) tended to focus their gaze steadily on the dashboard while avoiding orienting toward peripheral events, including passing cars and crossing pedestrians. (An example of such behavior is marked as “Type II” in the supplemental videos. “Type I” is the typical behavior of non-ADHD participants.) This behavior often resulted in accidents, such as hitting a passing pedestrian. Data for individual participants are depicted in Figure 1A. A two-way ANOVA on the percentage of dwell time on the dashboard region confirmed this observation by showing a significant main effect of group: ADHD versus neurotypical, F(1, 29) = 8.9, p < .01 (Figure 1B), with no interaction with vehicle mobility, F(1, 29) < 1. The percentage of dashboard dwell time was slightly higher in total when the vehicle was stationary relative to when it was mobile: main effect of vehicle mobility, F(1, 29) = 4.23, p = .049.
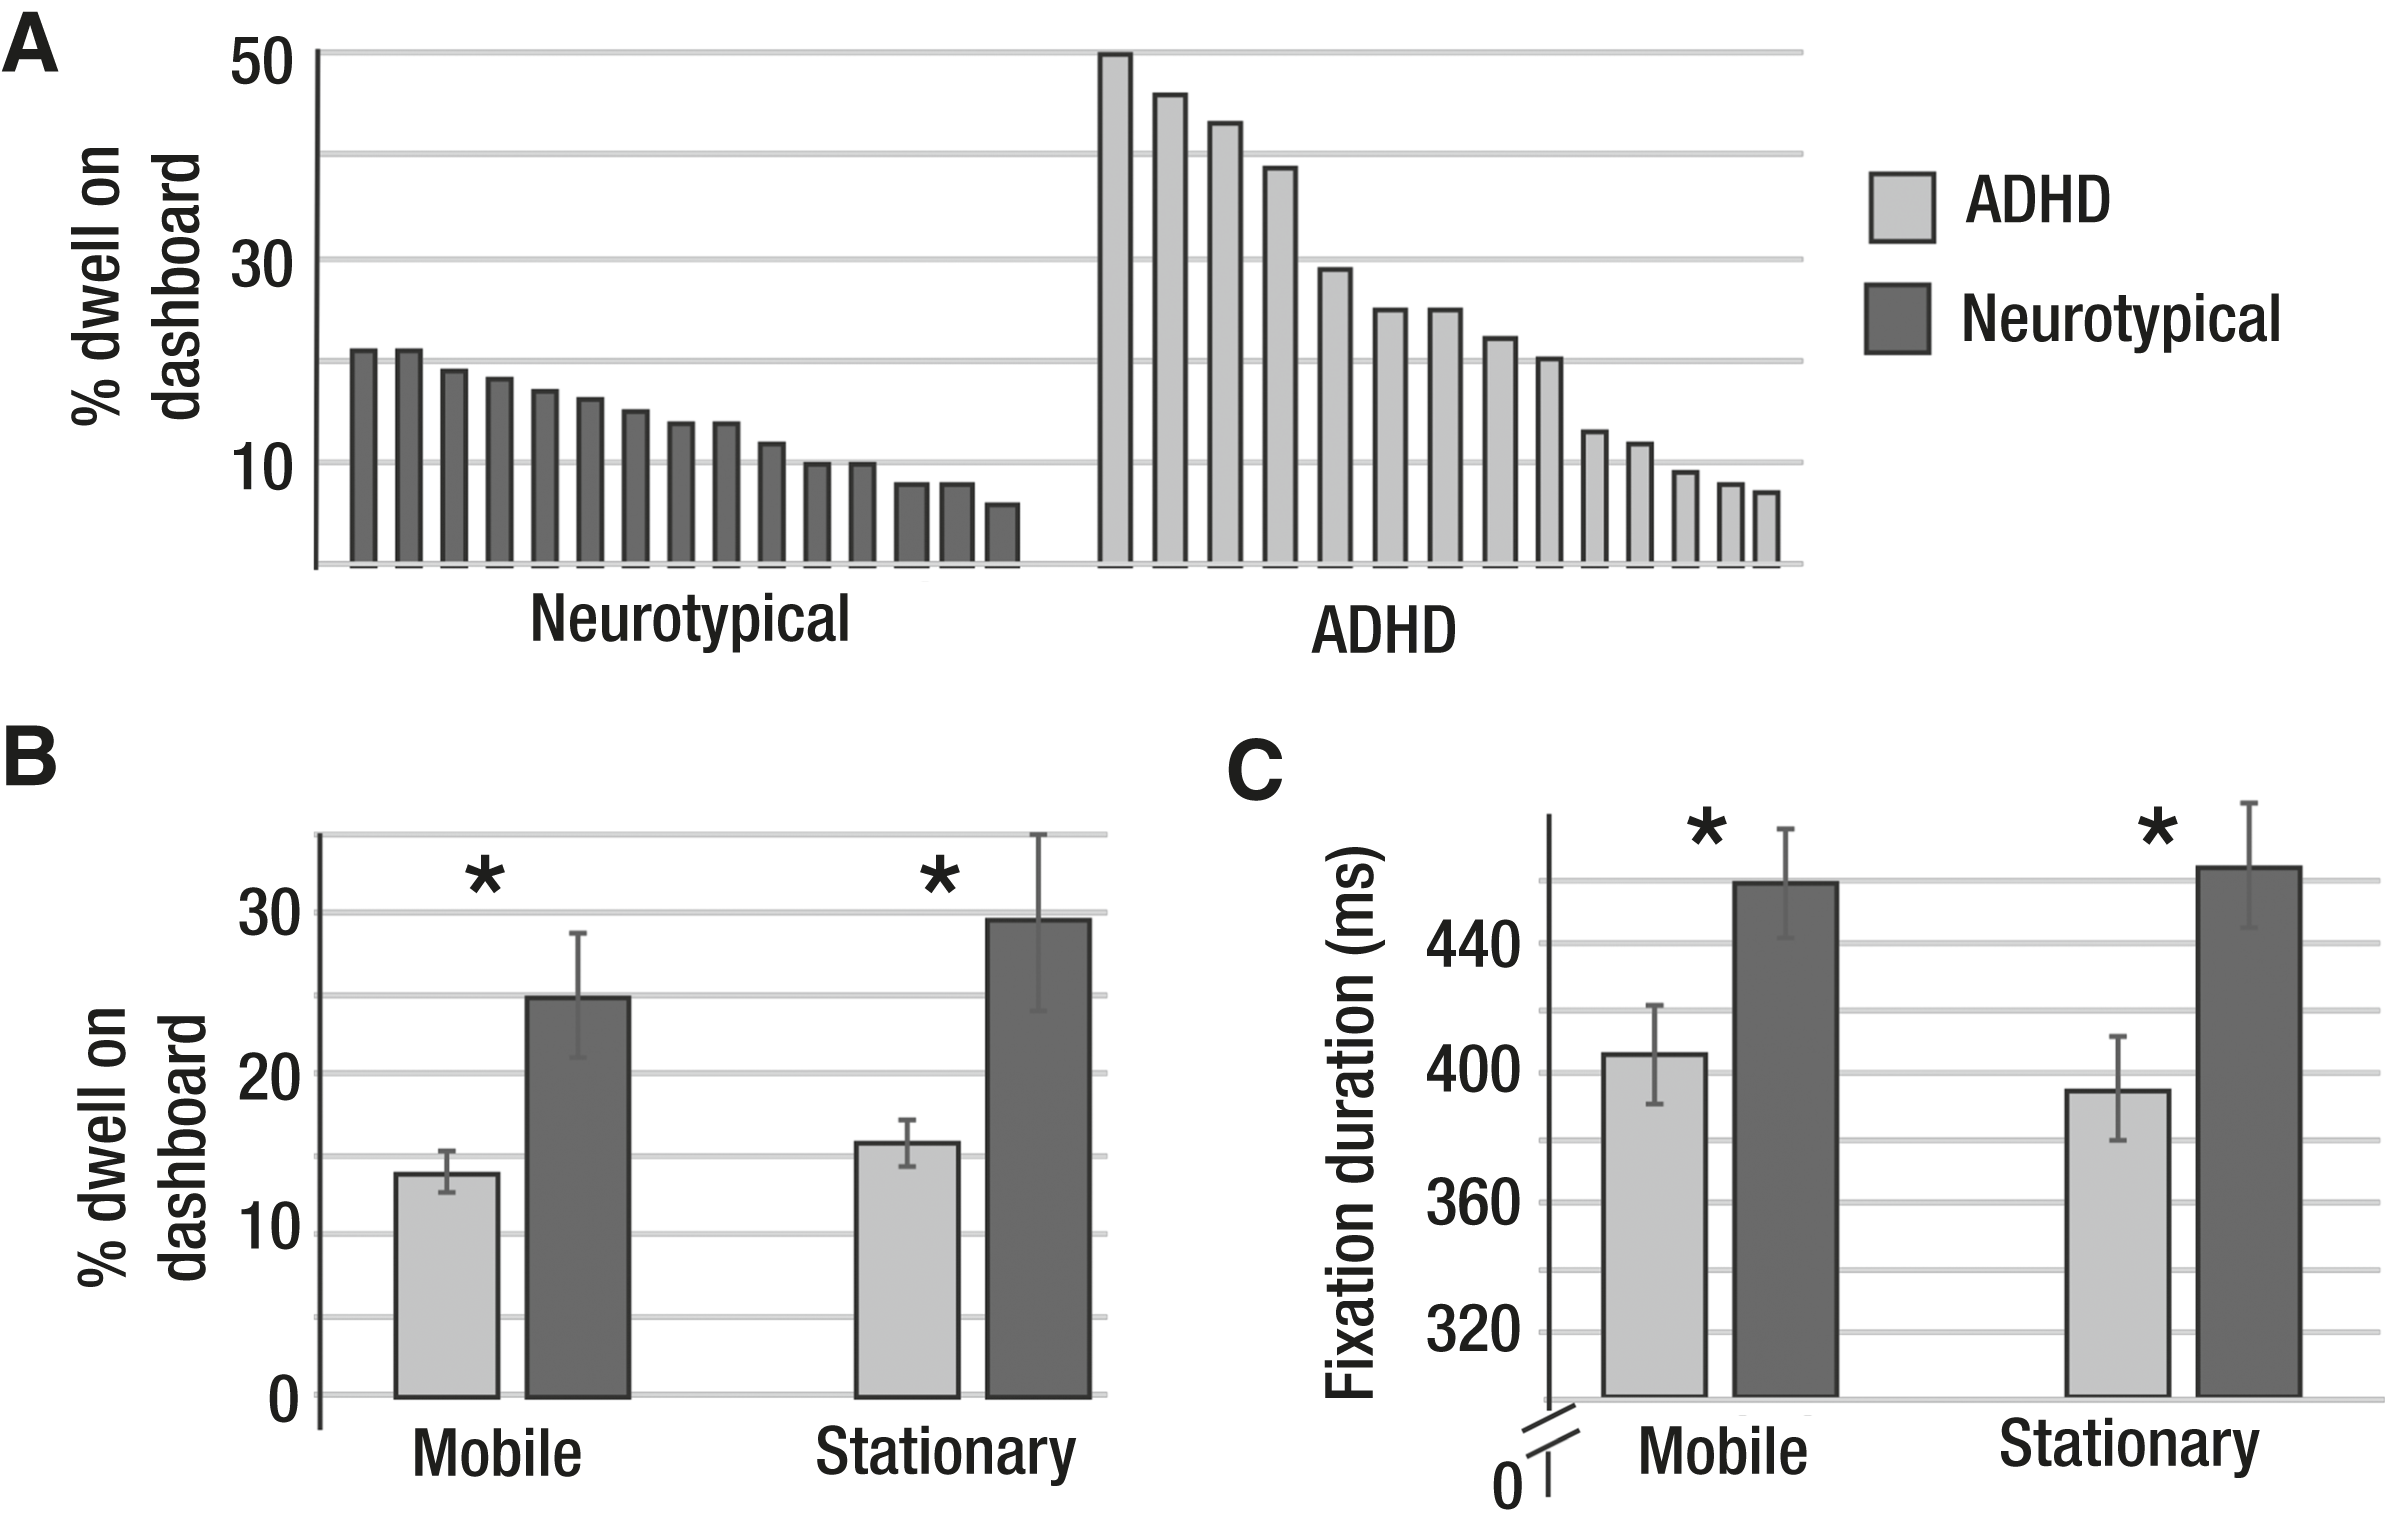
(A) Percentage of dwell time on dashboard for individual participants in both groups, (B) mean percentage of dwell time on dashboard for both groups, and (C) mean fixation duration for both groups, for mobile and stationary vehicles.
We measured the area under the ROC curve to assess the discriminability of the dashboard dwell-time measurement in classifying ADHD. The area under the curve was significantly larger than 50% (stationary: 75.8%, p = .014; mobile: 74.6%, p = .02), suggesting that dashboard dwell time is a positive indicator of ADHD diagnosis (higher dwell time indicated ADHD).
Fixation Variance.
To examine the hypothesis that participants with ADHD showed lower gaze variance, we conducted 2 two-way ANOVAs on the horizontal and vertical standard deviations of fixation positions. We found lower horizontal variability for participants with ADHD than for neurotypical participants: main effect of group, F(1, 29) = 5.39, p = .03. We found no main effect of vehicle mobility, F(1, 29) = 2.71, p = .11, and no Vehicle Mobility × Group interaction, F(1, 29) = 1.53, p = .12. However, further analyses performed separately for the two conditions revealed that the group effect was mostly evident when the vehicle was mobile, t(29) = 3.03, p = .005, rather than stationary, t(29) = 1.1, p = .28 (Figure 2). We found no group effect on the vertical standard deviation, F(1, 29) < 1; only a marginal vehicle mobility effect, F(1, 29) = 4.1, p = .052; and no interaction, both Fs(1, 29) < 1.
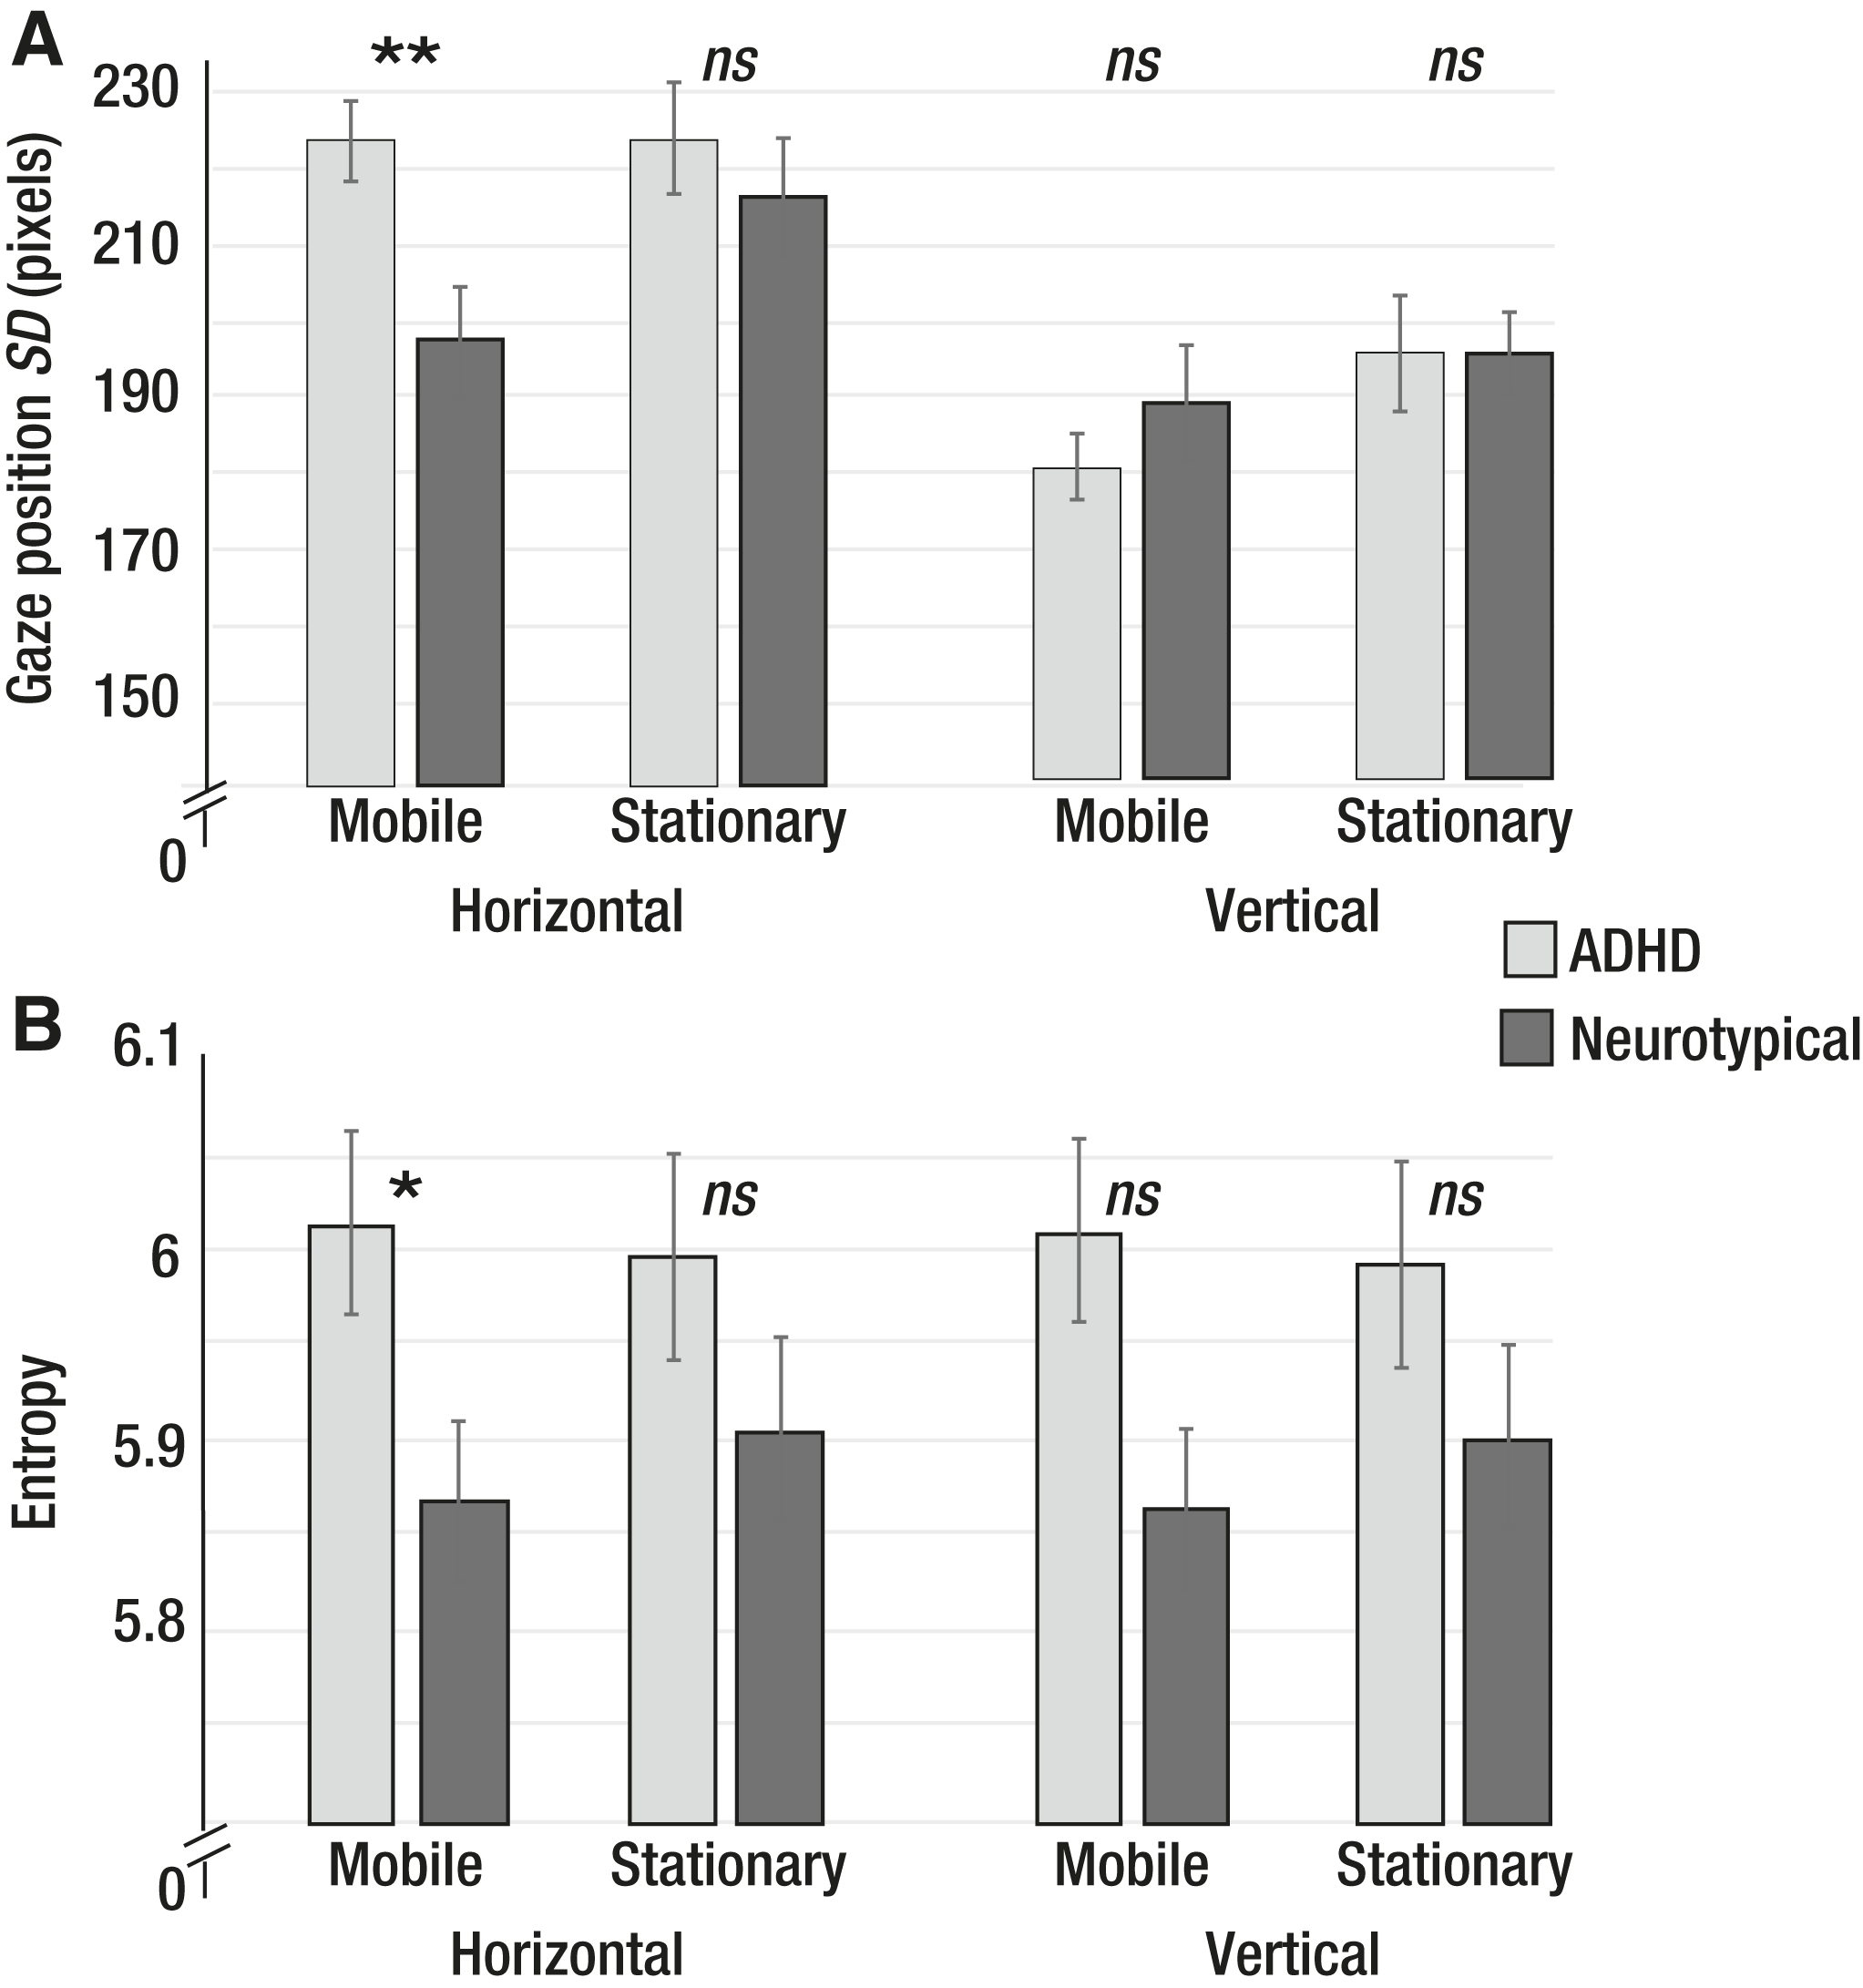
(A) Mean horizontal and vertical standard deviation of fixation locations and (B) mean horizontal and vertical entropy (randomness) of fixation locations, for mobile and stationary vehicles.
Area under the ROC curve was measured to assess the discriminability of the horizontal standard deviation measurement in classifying ADHD. For the time intervals when the vehicle was mobile, the area under the curve was found to be significantly smaller than 50% (21.7%; p = .007), suggesting that horizontal standard deviation of fixations acquired during driving is a negative indicator of ADHD diagnosis (lower variability indicated ADHD). For time intervals in which the vehicle was stationary, the area under the curve was not significantly smaller than 50% (40%; p = .34), suggesting that the measurement was not a good indicator of ADHD in this case.
Entropy.
Entropy is a measure of unpredictability or disorder. High entropy of fixation locations indicates that knowing the location of one fixation does not provide much information as to the location of the next—that is, fixation locations are random. Lower horizontal entropy was found for fixation locations of the ADHD group relative to the neurotypical group, F(1, 29) = 6.25, p = .02. We found no main effect of vehicle mobility and no interaction, both Fs(1, 29) < 1. However, further analyses performed separately for the two conditions revealed that the group effect was mostly evident when the vehicle was mobile, t(29) = 2.57, p = .016, rather than stationary, t(29) = 1.64, p = .11 (Figure 2). We found no significant effects for vertical entropy, all Fs(1, 29) < 1.
Area under the ROC curve was measured to assess the discriminability of the horizontal entropy measurement in classifying ADHD. For the time intervals in which the vehicle was mobile, the area under the curve was found to be significantly smaller than 50% (24.6%; p = .016), suggesting that horizontal entropy of fixations acquired during driving is a negative indicator of ADHD diagnosis (lower horizontal entropy indicated ADHD). For time intervals in which the vehicle was stationary, the area under the curve was not significantly smaller than 50% (32.1%; p = .09), suggesting that the measurement was not a good indicator of ADHD in this case.
Fixation Duration.
Participants with ADHD performed longer fixations than neurotypical participants: group main effect, F(1, 29) = 10.27, p < .01 (Figure 1C). We found no interaction and no main effect of vehicle mobility, both Fs(1, 29) < 1.
We measured the area under the ROC curve to assess the discriminability of the fixation duration measurement in classifying ADHD. The area under the curve was significantly larger than 50% (stationary: 79.2%, p = .006; mobile: 79.6%, p = .005), suggesting that fixation duration is a positive indicator of ADHD diagnosis (longer fixations indicated ADHD).
Discussion
The findings showed a deficiency in exploratory behavior during simulator driving for adolescents with ADHD relative to neurotypical participants. This deficit was evident in the tendency of participants with ADHD to perform longer fixations, to focus more on the dashboard area (which is less relevant for safety than the road), and to demonstrate less horizontal variability and lower horizontal entropy in their fixation positions. The examined fixation measurements (dashboard dwell time, horizontal standard deviation of fixation, horizontal entropy, and duration of fixation) also showed clinical discriminability for ADHD diagnosis, as revealed by analyzing areas under the ROC curves. These deficits were found both when the vehicle was stationary (at a traffic light) and when it was moving, and they were directly linked to errors and serious accidents in simulator driving.
Driving requires frequent shifting of spatial attention, each involving disengaging from one location and engaging in a new one (Pierce & Andersen, 2014). Attention can be shifted covertly, without moving the eyes, but in natural viewing conditions, when there are no restrictions regarding eye position, it is usually accompanied by eye movements. Therefore, gaze shifts during natural viewing are often considered to be a reliable index for engagements and disengagements of attention (Einhäuser et al., 2006).
People with ADHD have been shown to have a reduced ability to disengage from one location before redirecting attention to a new one (Tsal et al., 2005). The present findings of limited visual exploration during driving are consistent with this known deficit in ADHD. Participants with ADHD in this study focused on the “safe zone,” the dashboard, which is the least dynamic region on the simulator display. Despite the immediate negative outcome of this behavior, they avoided extensive exploration and consequently missed many important events in their surroundings. In contrast, neurotypical participants engaged in constant and wide-ranging exploration, focusing mainly on events that are significant for driving, such as crossing pedestrians. This exploration deficit in driving is probably related specifically to ADHD, because it has not been reported in people with other neurodevelopment disorders. An interesting finding is that people with high-functioning autism spectrum disorder (ASD) have been reported to show a different tendency: to focus on the far horizon and not on the dashboard region (Reimer et al., 2013). No studies to date have examined eye gaze during driving in people with both ASD and ADHD.
Two recent studies examined eye movements in adult drivers with and without ADHD and, contrary to our findings, found no differences in fixation duration and variability between the groups (Groom et al., 2015; Michaelis et al., 2012). Michaelis et al.’s (2012) study included only 5 participants per group and was underpowered to reveal group effects. The study by Groom et al. (2015) was likely less sensitive for smaller fixation modulations because of their eye-tracker’s lower spatial resolution and sampling rate. In addition, our study was performed with adolescents with no previous driving experience, whereas Groom et al.’s study evaluated adults with driving experience. Some of the adults with ADHD may have learned to compensate for their deficiencies throughout the years, leading to less robust group effects.
Implications for Occupational Therapy Practice
The implications of these findings for occupational therapy practice are as follows:
Teen drivers with ADHD may benefit from sessions on a simulator before beginning driving lessons.
Clinicians seeking to promote safe driving of adolescents with ADHD should consider the impact of eye tracking as well as how it might be measured, lessened, and eliminated through assessment protocols, intervention approaches, and educational programs.
Occupational therapists should place a greater emphasis on their mandated role as agents of change with respect to policy toward adolescents with ADHD. They should be involved in addressing and promoting training of adolescents with ADHD in safe driving on a simulator before they begin to drive.
Conclusion
To conclude, these findings suggest that participants with ADHD engage in limited visual exploration during driving. These findings raise concerns regarding the driving competence of people with ADHD and open up new directions for potential training programs that focus on exploratory behavior.
Footnotes
Acknowledgment
This work was funded by the Or Yarok Association for Safer Driving in Israel and by Israel Science Foundation Grant 1427/14.