





Abstract
As the number of adults needing rehabilitation services expands due to an aging population, there will be increasing demands for occupational therapy with an accompanying call for documenting treatment outcomes. Occupational therapy treatment in typical rehabilitation settings is delivered to heterogeneous populations with varying degrees of comorbidities, functional levels, and therapeutic needs using a range of intervention strategies (Huebner et al., 2006). Heterogeneity is problematic in outcome research because it increases variability and thus diminishes the statistical power for tests of pre- and postintervention differences (Cohen, 1992). Outcome studies based on what works for all clients may obscure the needs of population subgroups who benefit unequally from similar treatment. Thus, an understanding of the characteristics and needs of differing subgroups of clients served by occupational therapy may promote more tailored treatment protocols and improve the statistical power of outcome research.
This outcome study was designed to demonstrate the effects of occupational therapy as implemented in everyday practice. Kielhofner et al. (2004) described such studies as “research [that] asks whether the program of services produce[s] broad outcomes such as a more independent living status, employment, or enhanced school performance” (p. 17). Outcome research has a high degree of external validity and explores whether and how much clients benefit from services that include occupational therapy. In outcome research, treatment interventions are delivered to participants regardless of comorbidities; heterogeneity is the norm.
Traditionally, heterogeneous populations have been divided into subgroups by diagnostic category. However, people within any diagnostic category may have a range of functional limitations, therapeutic needs, and outcomes, independent of their diagnosis. Statistically, heterogeneity may be managed with analysis of covariance or sequential block designs that control specific variables such as medical severity or age while using a range of dependent variables to predict independent outcome variables.
Beyond these strategies, there is a trend toward identifying naturally occurring but latent subgroups using clustering techniques or cluster analysis (King, 2014). Cluster analysis has been applied in rehabilitation (e.g., Armstrong et al., 2012; Louie et al., 2009) and in occupational therapy (Thibodaux, 2005). Identification of latent subgroup structures using clustering algorithms is an exploratory technique designed to deal with complexity in large populations (Mehrpoor et al., 2014).
In this study, we aimed to identify latent subgroups among a complex rehabilitation population. Because of the tendency for average outcomes to be influenced by heterogeneity, we were particularly interested in understanding subgroups based on client satisfaction and progress in achieving functional self-care. Satisfaction is a client-centered outcome that can only be reported by clients on the basis of their subjective experiences (Hekkert et al., 2009).
Our second aim was to understand subgroup differences in occupational therapy and rehabilitation processes and client discharge status. The specific research questions were, among a population of adults receiving occupational therapy:
What subgroups can be identified based on client intake status and outcomes?
How do rehabilitation and occupational therapy processes vary across outcome subgroups?
How does functional status at discharge vary across outcome subgroups?
Method
This descriptive aspect of our outcomes study was conducted using secondary analysis of an existing dataset and cluster analysis statistical methods. The study was approved by the institutional research boards at both the university and the rehabilitation hospital. This study expanded upon a previous study (Custer et al., 2015) in which logistic regression was used to identify predictors of client satisfaction. Because of the need to dichotomize satisfaction as a dependent variable, this previous study excluded about a third of cases with ambiguous satisfaction. The entire dataset was used in this study.
Participants
Data from clients ages 18 yr and older who were rehabilitation hospital inpatients over a 27-mo period and also completed the Satisfaction with Continuum of Care–Revised (SCC–R; Custer et al., 2015) were included. The 1,099 participants were 40.7% male and 59.3% female with an average age of 68.48 yr (range = 18–100 yr). All the clients received occupational therapy services.
Measures
The design, content, and face validity and psychometric properties of the SCC–R are fully described in Custer et al. (2015). This 23-item self-report measure focuses on specific client perceptions rather than global satisfaction. For instance, items include “I was involved in making decisions about my care.” The 5-point rating scale ranges from 1 (strongly disagree) to 5 (strongly agree). Two subscales, Clinical Quality and Client-Centeredness, were identified using exploratory factor analysis. The Clinical Quality subscale includes measures of timeliness of service, sense of a team effort toward improvement, and perceptions of being helped to improve. The Client-Centeredness subscale includes measures of responsiveness to and respectfulness of client needs and values, with client needs guiding decisions. Internal consistency coefficients for Clinical Quality and Client-Centeredness were α = .91 and .83, respectively. Scores on the two subscales were predicted by theoretically sound conditions such as functional gain (Custer et al., 2015), providing evidence of construct validity.
The self-care items of the FIM™ were used as a measure of function and progress in treatment. The FIM is part of the Uniform Data System for Medical Rehabilitation and is used nationwide in rehabilitation hospitals and research (Shah et al., 2007). For this study, we used the six self-care items assessing the amount of assistance required to perform self-care safely. Ratings range from 7 (complete independence) to 1 (total dependence). Although FIM self-care items are part of the Motor subscale, we used the self-care scores alone because they are often rated by and attributed to occupational therapy intervention. A precedent for using self-care alone is found in other studies (e.g., Hong et al., 2017; Sledziewski et al., 2012). For the six FIM self-care items at admission used in this study, Cronbach’s α = .84 for internal consistency.
The Inpatient Rehabilitation Facility–Patient Assessment Instrument (IRF–PAI; Centers for Medicare and Medicaid Services, 2014) was administered at admission. The IRF–PAI is a standard data collection tool for inpatient rehabilitation that includes a Pain Rating and a medical Severity Index.
Cluster Analysis Variables
We selected the variables for all participants (Table 1) to enter into the cluster analysis in three domains: client demographics, admission status, and outcomes. Using these results, we compared cluster groups based on the rehabilitation processes and self-care discharge status.
Demographics, Intake Status, Outcomes, Rehabilitation Process, and Functional Discharge Status for All Study Participants
Note. IRF–PAI = Inpatient Rehabilitation Facility–Patient Assessment Instrument; M = mean; SCC–R = Satisfaction with Continuum of Care–Revised.
Demographic and Intake Status.
Demographic variables included age at admission and gender. Because 94.4% of clients were Caucasian, the race variable was excluded. Based on the admitting diagnosis, clients were assigned to either the neurological group or the nonneurological group. Admission measures included FIM self-care items and the Severity Index and Pain Rating from the IRF–PAI. For these measures, higher scores indicate higher functioning, medical severity, and pain, respectively.
Functional and Satisfaction Outcomes.
Changes in the total FIM self-care score were used to measure the amount of progress in functional capacity made during the rehabilitation stay. Scores from the Clinical Quality and Client-Centeredness subscales of the SCC–R were used as outcome measures of client satisfaction. For these measures, higher scores indicate higher functioning and greater gains and higher perceived satisfaction, respectively.
Rehabilitation Processes and Discharge Status.
The speed of access to services was defined as the number of days from disability onset to admission to the rehabilitation hospital. Because of skewed data, we dichotomized this measure into two nearly equal size groups: those entering the rehabilitation center within 7 days and those entering after 8 days. Additional processes are defined in Table 1.
Data Analysis
We used IBM SPSS Statistics (Version 25; IBM Corp., Armonk, NY) for all statistical analyses, with the criterion for statistical significance set at p < .05. To identify latent subgroups, we used K-means cluster analysis with demographics, admission status, and outcome measures entered. Cluster analysis uses algorithms to identify more homogeneous groups based on correlations around a center axis (King, 2014). Cluster analysis was completed with both continuous and categorical data from 1,099 clients, making K-means clustering the appropriate analysis (Antonenko et al., 2012).
Our aim was to identify a conceptually meaningful solution that would have as many distinct clusters as possible with adequate group sample size to detect group differences. K-means clustering identifies a starting center, or centroid, for each cluster. After each observation, the center of the clusters is recalculated, and every observation is adjusted to be closest to the centroid. Based on the cluster solution, each case was assigned a cluster membership and distance from the classification mean. Subgroup differences were tested for statistical significance using χ2 tests for categorical variables and analysis of variance (ANOVA) for continuous variables. Post hoc analyses of significant findings with continuous variables were conducted using Scheffe tests.
Results
Cluster Groups Based on Demographics, Intake Status, and Outcomes
Three-, four-, five-, and six-cluster solutions were explored with cluster membership and distance from the classification mean saved for each case. The goal of clustering is to minimize within-group variance (increase homogeneity) and maximize between-group variance (improve orthogonality). To decide on the optimal clustering solution, we plotted the F test values in an elbow diagram and selected the five-cluster solution as being conceptually meaningful with optimal treatment of variance. Each cluster had adequate sample size; a five-group ANOVA comparison requires 39–240 cases in each group to detect a medium or large effect size at the 0.05 level (Cohen, 1992). Except for pain, the differences between subgroups were all statistically significant.
Cluster membership was organized by IRF–PAI Severity Index scores (Table 2):
Cluster 1 (severe, most progress), 15.7% of clients, had the highest severity scores and lowest FIM self-care scores at admission. Clients in this group made the greatest gains in self-care scores and were the second most satisfied group with both the clinical quality and client-centered aspects of their care.
Cluster 2 (severe, least progress), 16.7% of clients, had severity and FIM self-care scores at admission similar to Cluster 1; however, these clients made the lowest gains in self-care ratings and tended to be less satisfied than average. They were older than average with a higher prevalence of neurological disorders.
Cluster 3 (youngest, least satisfied), the smallest group at 8.4% of clients, who were nearly 30 yr younger than the average client, had the lowest satisfaction ratings. This group tended to be male and have neurological disorders.
Cluster 4 (oldest, high satisfaction), 28.6% of clients, who were 10 yr older than the overall group, had nearly 73% with nonneurological disorders. They had higher than average self-care scores at admission.
Cluster 5 (high functioning, most satisfied), the largest group at 30.7% of clients, had the lowest severity scores, the highest self-care admission scores, and the highest ratings of satisfaction. This group had predominately nonneurological disorders and was more often female.
Demographics, Intake Status, and Outcomes of Cluster Groups
Note. IRF–PAI = Inpatient Rehabilitation Facility–Patient Assessment Instrument; M = mean; SCC–R = Satisfaction with Continuum of Care–Revised; — = not applicable.
All differences were statistically significant except between Clusters 2 and 4 in post hoc analysis.
Clusters 1 and 2 and 3 and 4 were not significantly different in post hoc analysis.
The only significant differences were between Clusters 2 and 5 in post hoc analysis.
All differences were statistically significant except between Clusters 1 and 2 in post hoc analysis.
All differences were statistically significant except between Clusters 2 and 5 in post hoc analysis.
All differences were statistically significant except between Clusters 2 and 3 in post hoc analysis.
Rehabilitation Processes Associated With the Clusters
We compared the rehabilitation processes and functional discharge status for each subgroup (Table 3). Both severe groups (Clusters 1 and 2) tended to enter rehabilitation more than 8 days after onset and stay for the longest times. However, clients in Cluster 1 had on average of 12 more sessions of rehabilitation therapy than clients in Cluster 2. At discharge, the self-care scores for clients in Cluster 2 were the lowest of any group and lower than admission scores for clients in Clusters 4 and 5. Clients in Cluster 3 were most likely to enter rehabilitation long after disability onset and leave inpatient rehabilitation with relatively low self-care ratings. Clusters 4 and 5 were similar in entering inpatient rehabilitation within 7 days of disability and with the shortest lengths of stay. Of Clusters 4 and 5, the high-functioning (Cluster 5) group had the least severe complications at admission, the shortest lengths of stay, and the fewest sessions of occupational and rehabilitation therapies.
Rehabilitation Process and Functional Discharge Status by Cluster Group
Note. In post hoc analysis, the differences between clusters on each variable were all statistically significant. M = mean; — = not applicable.
Discussion
This study illustrates the heterogeneity within an adult rehabilitation population and the potential knowledge-building power of clustering techniques. Five distinct groups with statistically different patterns of medical complications, functional abilities, rates of progress, satisfaction with intervention, and course of treatment were identified. Two of the five cluster groups (Clusters 4 and 5), which represented more than 59% of the sample, entered inpatient rehabilitation quickly after disability onset, had more nonneurological disorders with relatively low medical severity ratings, made between 10- and 14-point gains in achieving self-care independence, left satisfied, and had the highest self-care scores. Cluster 1 also stands out as a group that recovered well, made significant progress in functional self-care, and left rehabilitation satisfied and much more independent. Clusters 1, 4, and 5 seem to represent what occupational therapy practitioners and their clients might desire as positive outcomes from inpatient rehabilitation.
In contrast, clients in Clusters 2 and 3 were least satisfied despite having 10–30 more sessions of rehabilitation therapy than other groups. Although Cluster 2 was nearly twice the age of Cluster 3, their outcomes were similar. We speculate, based on the discharge self-care scores, that clients in both of these groups required the most caregiver training, adaptive strategies, and perhaps an assisted living setting. Clients in Cluster 3 might require additional or different emotional support from occupational therapy to adjust to more persistent disability.
Cluster analysis may elucidate patterns unapparent in overall averages. Clients in Clusters 2 and 3 did not experience average outcomes and had different needs as young clients or clients with more severe medical complications. Previous research found a strong relationship between functional gain scores and satisfaction with treatment (Custer et al., 2015). However, these results showed that the most satisfied group (Cluster 5) made relatively small gains in self-care scores but were discharged with the highest level of functioning, suggesting that the relationship between satisfaction and outcomes is more complex than an average gains model might predict.
The effect of heterogeneity on outcome measure is apparent when comparing self-care scores at intake and discharge (Figure 1). The average self-care score of 31.87 in this study is higher than a FIM self-care score of 30. A FIM self-care score of 30 represents an average score of 5 points on each of the six items, suggesting that the person could complete self-care tasks with some supervision but not require physical assistance. Based on this criterion, all groups were admitted needing physical assistance in self-care.
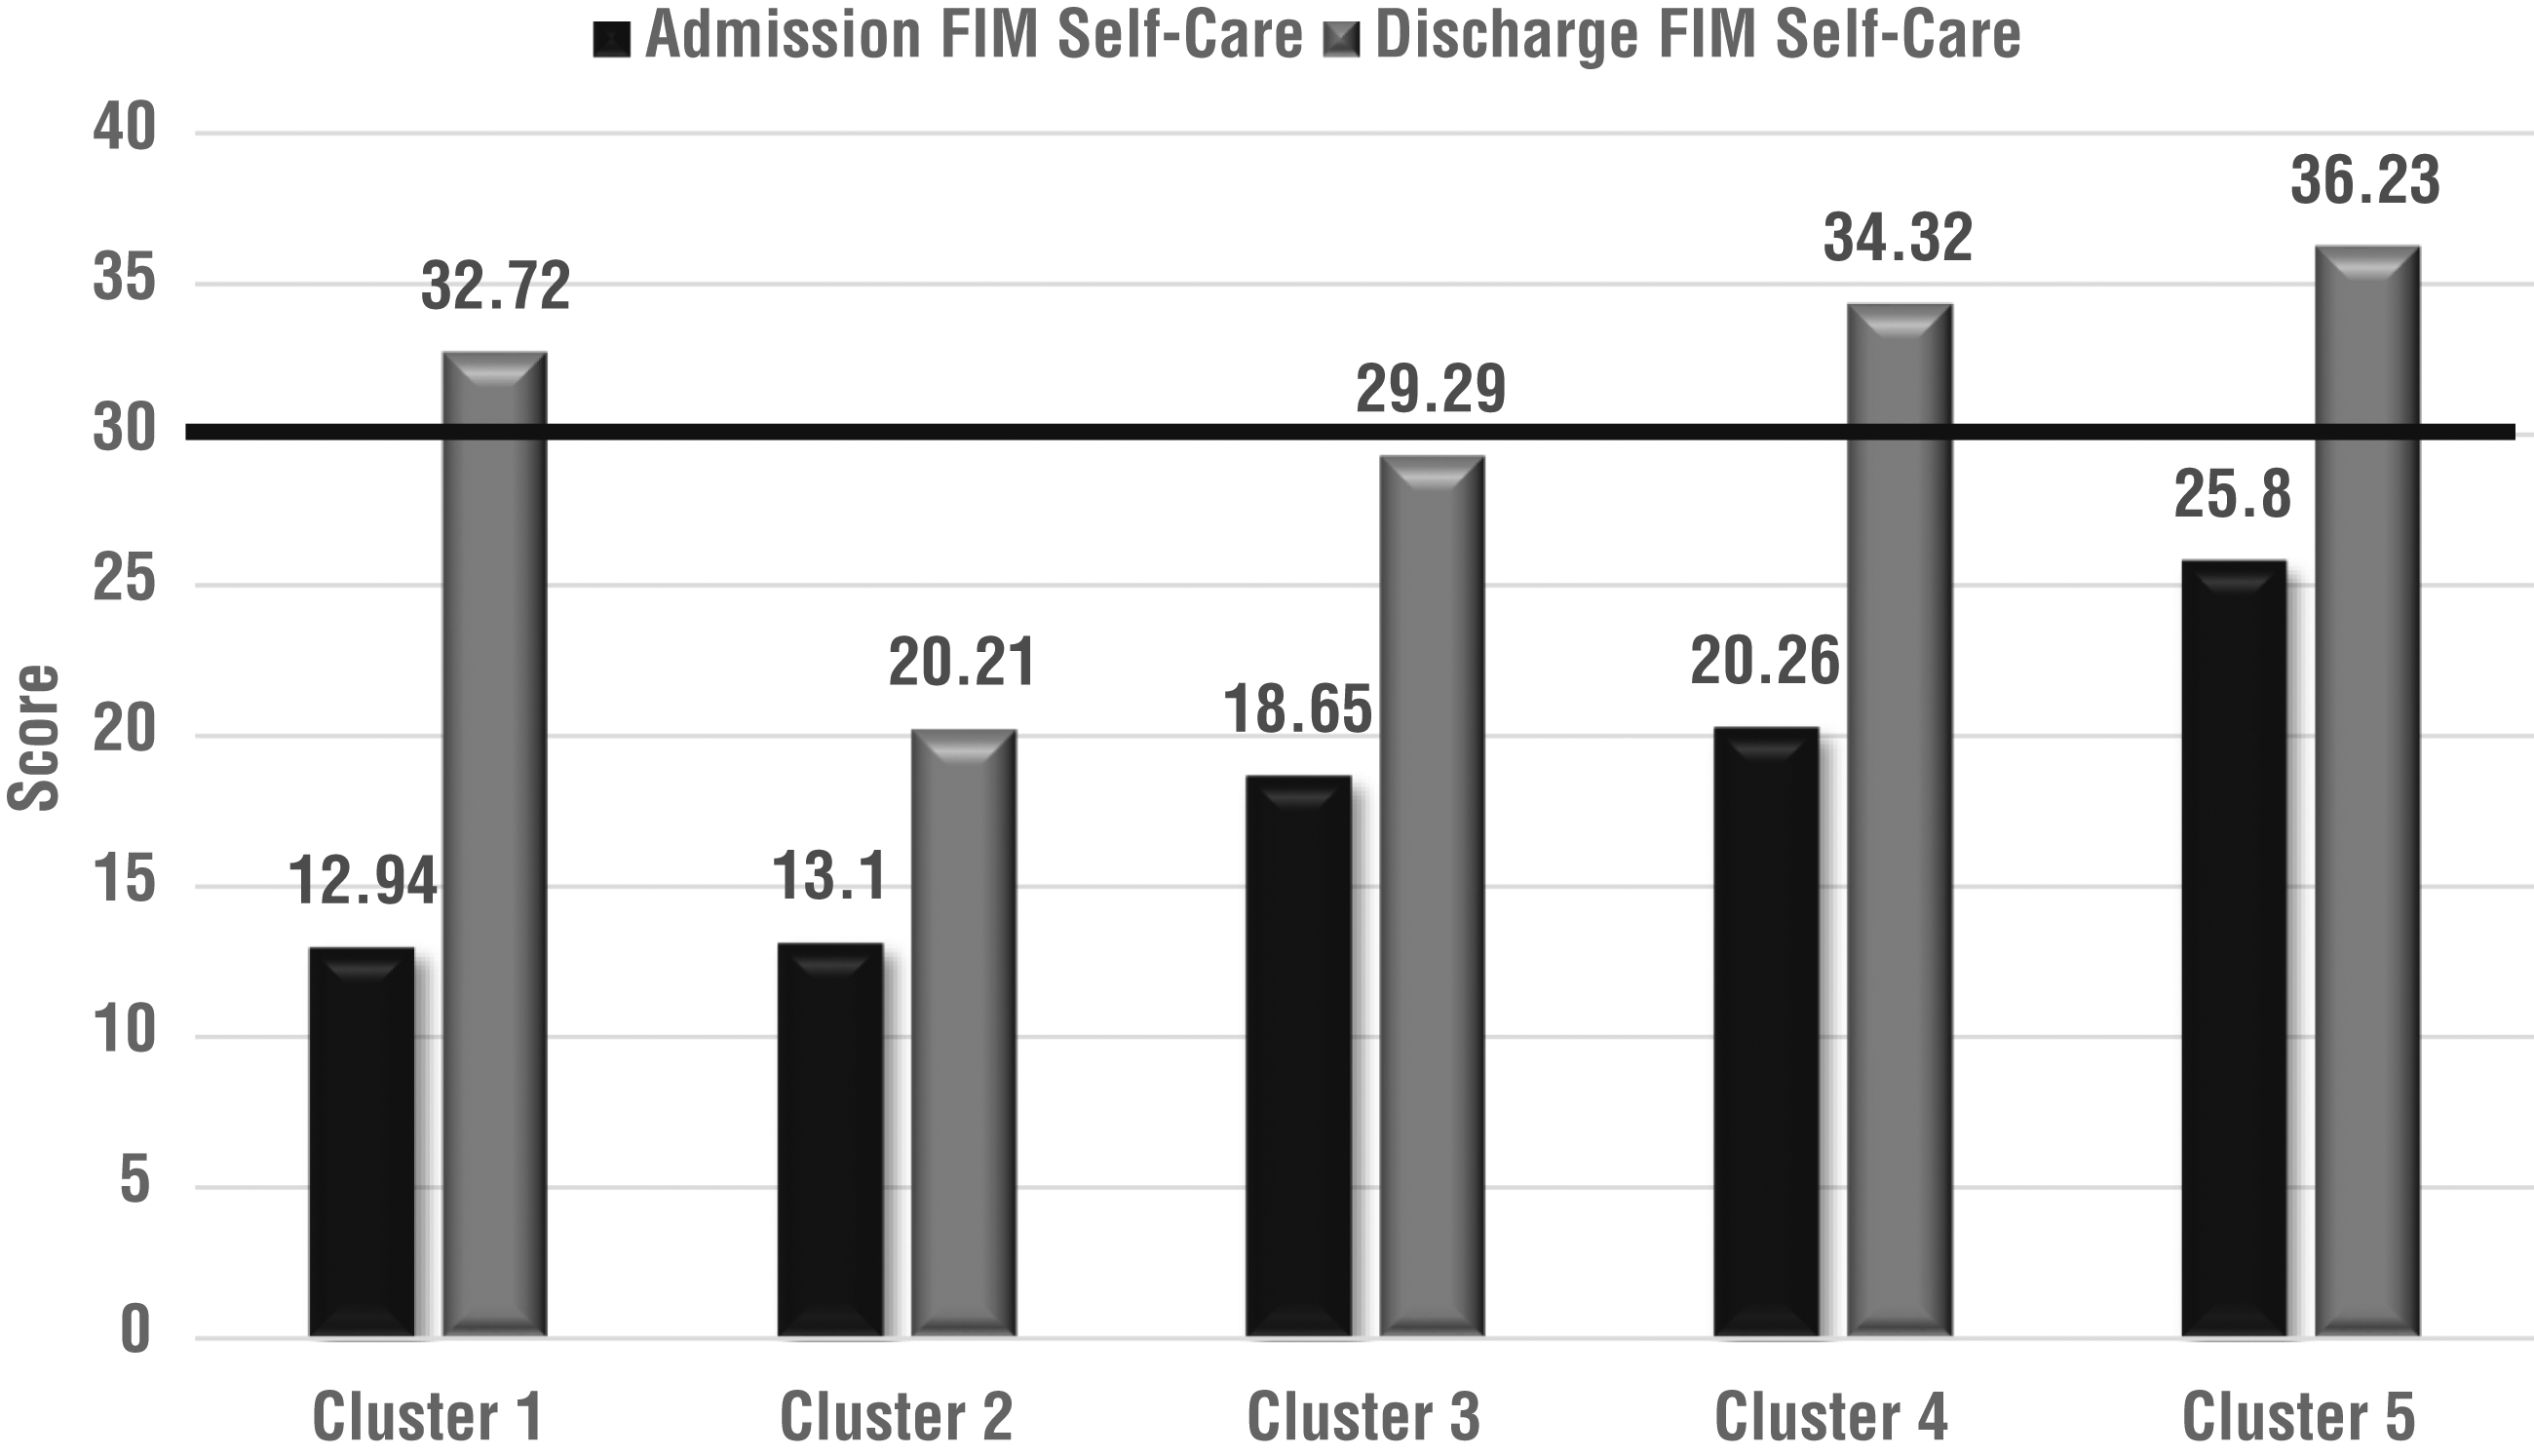
FIM™ self-care scores at admission and discharge.
All subgroups made statistically significant progress in self-care during rehabilitation. Paired sample t tests between admission and discharge on self-care scores ranged from a low of t = 17.07 (Cluster 3) to a high of t = 65.60 (Cluster 4) with all at p ≤ .000. This is an important finding because it suggests that clients with different profiles at admission and different experiences in the rehabilitation process made significant and meaningful gains in rehabilitation that included occupational therapy. However, the average self-care improvement score does not reflect the clients in Cluster 1, who made the greatest gains but also required twice the length of care and rehabilitation sessions as clients in Clusters 4 and 5. The interaction of the functional improvement and length of stay is an important consideration in outcomes research that might include a cost–benefit analysis in future studies.
Limitations
This study is an exploratory study that does not support causal inferences between variables and outcomes. One cannot conclude, for instance, that the shortest duration of rehabilitation services caused higher satisfaction (see Cluster 5). In fact, cluster analysis results provide more nuanced understanding, with both short and longer stays in rehabilitation associated with higher satisfaction (Clusters 1 and 5). With larger datasets, a different number of clusters might have been identified. Other rehabilitation settings may serve clients with different characteristics or lengths of stay and thus uncover another cluster configuration. The impact of occupational therapy on outcomes cannot be unbundled from the impact of the entire team. The sample size was constrained by the number responding to the satisfaction survey; clients with differing patterns of outcomes may not have responded to the survey. Length of stay and possibly related functional gains were likely influenced by payment systems, rehabilitation access, or distance from the hospital.
Implications for Occupational Therapy Practice and Research
This study has the following implications for occupational therapy practice and research:
The understanding of subgroup differences may support more tailored occupational therapy interventions. For example, by discharge, clients in Clusters 1, 4, and 5 likely needed adaptive equipment with minimal caregiver training. Clients with lower levels of satisfaction and less progress might benefit from occupational therapy protocols that include strategies for providing emotional support.
The design of the integrated dataset used in this study that linked data from a post-discharge satisfaction survey with existing administrative data has relevance to other outcome studies. Although FIM scores may not be perfect measures of occupational therapy outcome (Coster, 2013), the FIM and the IRF–PAI are required for some billing in rehabilitation centers and consequently are available for pairing with profession-collected measures. For example, pairing administrative data with a measure of occupational therapy process (e.g., Huebner, et al., 2006) might build knowledge of what strategies work best with different subgroups.
Results of outcomes research have the potential to advance the profession’s quest toward building a results-oriented culture by documenting the outcomes in terms of the functional gain and value to the client and applying this knowledge to continuously improve the quality of practice (Schaaf, 2015).
Researchers could use cluster analysis with large integrated datasets to explore population subgroups based on specific domains of interest such as outcomes, as used in this study; patterns of community participation; or performance on assessment measures.
Conclusion
This study aimed to identify distinct subgroups within a typical population of rehabilitation clients who received occupational therapy, based on differences in intake status and outcomes of satisfaction and progress in rehabilitation. Cluster analysis techniques results identified five distinct subgroups with statistically significant diversity at intake, in rehabilitation processes, and discharge status. The findings illustrate the complexity of typical rehabilitation populations, independent of diagnosis, that are inadequately expressed in average scores on client characteristics and outcomes and mask subgroup needs and outcomes. We recommend increased use of subgroup identification and cluster analysis techniques in outcomes research.
Footnotes
Acknowledgments
We express our gratitude to Cardinal Hill Rehabilitation Hospital in Lexington, KY, for supporting this research.