





Abstract
Team-based learning (TBL) is a well-studied and frequently used andrological teaching and learning method promoting active engagement, immersive discussion, contextual application, and collaborative learning. TBL grew from a professor tired of disinterested and disengaged students (Michaelsen et al., 2002) and is rooted in structured processes to control and harness the power of group learning. The TBL method has been backed by studies supporting students’ preferences for TBL versus lecture (Carson, 2017; Frame et al., 2015; Livingston et al., 2014) and TBL’s positive impact on learning (Hashilkar et al., 2016; McRae et al., 2017; Wanzek et al., 2014). In addition, several books on understanding and implementing TBL have been published, and there is an active online community promoting and problem solving TBL adoption and integration (Michaelsen & Sweet, 2011; Sibley & Ostafichuk, 2014).
Despite TBL’s success and published evidence supporting students’ preference for TBL, little evidence describes students’ changes in perceptions of TBL over time. Most studies have reported one-time snapshots of students’ generally favorable opinions of TBL; however, how these favorable opinions endure with repeated TBL exposure is lacking. In this article, we report a longitudinal study of occupational therapy students’ preferences for TBL versus traditional lecture using the Team-Based Learning Student Assessment Instrument (TBL–SAI; Mennenga, 2012). Our hypothesis was that 1st-yr students in a master of occupational therapy (MOT) program will have statistically significant changes in perceptions of TBL over time.
Team-Based Learning Processes
TBL is grounded in four core principles: (1) proper forming and management of teams, (2) student accountability, (3) team assignments promoting learning and team cohesiveness, and (4) timely and frequent feedback from the instructor (Michaelsen & Sweet, 2008). These four principles are met through the structured and judicious application of assigned reading, individual and team tests over assigned reading, application exercises, group discussions, and frequent instructor feedback.
Method
Participants
Participants for this study were a convenience sample of two cohorts of students enrolled in a seven-trimester MOT program. Cohort 1 (n = 27) began the MOT program in Fall 2015 and consisted of 26 women and 1 man. Cohort 2 (n = 30) began the MOT program in Fall 2016 and consisted of 29 women and 1 man. For both cohorts, TBL–SAI data were collected twice. Data Set 1 was collected at the end of each cohort’s first trimester, and Data Set 2 was collected at the end of each cohort’s third trimester. For both cohorts, approximately 7 mo lapsed between collection of Data Set 1 and Data Set 2. No data were collected during either cohort’s second trimester because no TBL courses were taught in this trimester. Both cohorts participated in identical courses and credit hours across the study.
Trimester Description
For both cohorts’ first trimester, students enrolled in seven courses for a total of 16 credit hr. During the trimester, the primary investigator (PI) taught one 2-credit course, Human Occupation Across the Lifespan, using TBL philosophy and procedures; other faculty members taught the remaining courses. This course was the only one taught by the PI to each cohort during this trimester. In addition, the PI was the only MOT faculty member using TBL methods in the curriculum. The first TBL–SAI data collection occurred toward the end of this trimester.
During the second trimester of the cohorts’ course of study, no courses were taught with TBL. Students received 13 credit hr of traditional lecture in a variety of theoretical and clinical application coursework and 1 credit hr of fieldwork. The PI provided one 3-credit course, but this course was not taught with TBL. No TBL–SAI data were collected at the end of this trimester.
Both cohorts’ third trimester consisted of seven courses, totaling 16 credit hr, with the PI teaching one 3-credit course, Geriatric Practice, using a hybrid TBL format that contained both TBL and traditional lecture. The PI taught all TBL courses and TBL portions of the course. Other faculty members taught the remaining trimester courses using non-TBL methods. The second TBL–SAI data collection occurred near the end of this trimester.
First-Trimester Team-Based Learning Course
The 13-wk first-trimester TBL course consisted of six Individual Readiness Assurance Tests (IRATs) and six Team Readiness Assurance Tests (TRATs), with each Readiness Assurance Test (RAT) combination followed by a review, a discussion, and application exercises. RAT questions were derived from an assigned course text, with each RAT covering a specific chapter or chapters. Approximately 80% of students’ grade was derived from IRAT scores. The remaining 20% of students’ grade was divided, with 15% coming from TRAT and 5% coming from peer review. No additional assignments were included in this course. No course failures occurred in either cohort.
Third-Trimester Team-Based Learning Course
The 13-wk third-trimester course was hybrid, consisting of two TBL modules and one traditional lecture module. Weeks 1–3 were taught with TBL, Weeks 4–8 were taught with traditional lecture methods, and Weeks 9–11 were taught with TBL. The trimester’s remaining weeks were devoted to practical assessment.
The traditional lecture module consisted of didactic lecture that used PowerPoint (Microsoft Corp., Redmond, WA) presentations with corresponding handouts and no assigned reading. A multiple-choice examination was given at the end of this module. Traditional lecture and testing were necessary because faculty members unfamiliar with TBL delivered most of the module’s content. After the module exam, the course returned to TBL.
Course grading was more comprehensive than the first-trimester course, consisting of several grade elements: IRAT, approximately 40% of the grade; TRAT, approximately 5% of the grade; peer review, approximately 3% of the grade; practical examination, approximately 25% of the grade; traditional lecture exam, approximately 22% of the grade; and a paper, approximately 5% of the grade. All RATs were based on assigned reading from required course text.
Team Selection Process
For both cohorts, Day 1 of the first-trimester course consisted of a brief TBL overview. Students were then divided into five teams on the basis of answers to the following questions: “Do you have previous experience working in occupational therapy?” “Do you have previous experience with TBL?” “Have you received occupational therapy as a patient?” People who did not meet any criteria were randomly assigned to a team. The goal of team assignment was to diversify teams with students answering yes to any of the questions. For example, if 5 students answered yes to having previous experience working in occupational therapy, each student would be assigned to a different team. In Cohort 1, one team lost a member secondary to her attrition from the occupational therapy program. No intrateam member conflicts were reported to the instructor. At the beginning of the third trimester, students were re-formed into their previous teams but were given an opportunity to shift to a different team. Between both cohorts, only 2 students took this opportunity.
Sample Size
To ensure anonymity, we used a personal identification number (PIN) to track participants. No personal data were collected. A research assistant assigned PINs using an Excel (Microsoft Corp., Redmond, WA) formula to generate random 4-digit numbers between 1,000 and 9,999 for each student. The PINs were printed on labels and distributed to students just before they commenced the TBL–SAI . The PI had no access to the spreadsheet used to assign PINs and was not present when the PINs were distributed to students.
In Cohort 1 (n = 27), all students participated in the first TBL–SAI assessment given at the end of the first trimester, but only 15 students participated in the second assessment, given at the end of the third trimester. The loss of 12 participants resulted from a technical mistake with Excel’s randomization function, resulting in several PINs being lost. Only 15 pairs of matched data were collected for this cohort.
In Cohort 2 (n = 30), 26 students participated in both the first and second TBL–SAI data collections, resulting in 26 pairs of matched data. Four students from the cohort elected to not participate in the study, and no PINs were lost between trimesters. Together, 41 pairs of matched data were collected from Cohorts 1 and 2.
Measure
Until recently, a valid and reliable measure of students’ preference for TBL versus lecture did not exist, prompting Mennenga’s (2012) development of the TBL–SAI. Using 33 questions, the TBL–SAI seeks to identify students’ preferences for TBL versus traditional lecture across three domains: accountability, preference, and overall satisfaction. The TBL–SAI is gaining popularity and still represents the only valid and reliable measure of TBL (Livingston et al., 2014).
The TBL–SAI’s three discrete subscales are Accountability for Learning in TBL Versus Lecture, Preference for TBL Versus Lecture, and Overall Satisfaction With TBL Versus Lecture; it also generates a total scale score. By achieving an overall Cronbach’s α score of .941 and scores of .782, .893, and .942, respectively, on the subscales (Mennenga, 2012), the TBL–SAI has been established as accurately measuring students’ perceptions of TBL.
Mennenga (2012) established neutral scores for each subscale and for the total instrument. The neutral scores represent the discrete point at which a student has no preference for TBL or traditional lecture. Scores greater than the neutral score indicate a preference for TBL versus lecture for the measured construct. The neutral scores for the Accountability, Preference, and Satisfaction subscales are 24, 48, and 27, respectively. The overall instrument neutral score is 99. Readers are encouraged to search the literature for evidence supporting the TBL–SAI as a valid and reliable tool for assessing students’ perceptions of TBL versus traditional lecture.
The TBL–SAI is traditionally a paper-and-pencil assessment. However, with the TBL–SAI author’s permission (H. A. Mennenga, personal communication, September 30, 2014), the assessment was converted to electronic format with Qualtrics (Provo, UT) software.
Procedure
A cohort design (Figure 1) was used to determine changes in students’ perceptions of TBL from the first trimester to the third trimester. After institutional review board approval, the TBL–SAI Qualtrics survey was electronically administered toward the end of students’ first trimester and was readministered at the end of their third trimester. For Cohort 1, 26 scores were collected on the initial administration, but only 17 scores were collected on the second administration. Of these 17 scores, 2 scores were incomplete, yielding 15 pairs of matched initial and secondary data. For Cohort 2, 26 scores were collected on both the first and second administration, resulting in 26 pairs of matched data. Combined, 41 pairs of matched data were collected across both cohorts. Cohort 1, Cohort 2, and the combined matched pairs were analyzed with repeated-measures analysis of variance (ANOVA) for changes over time.
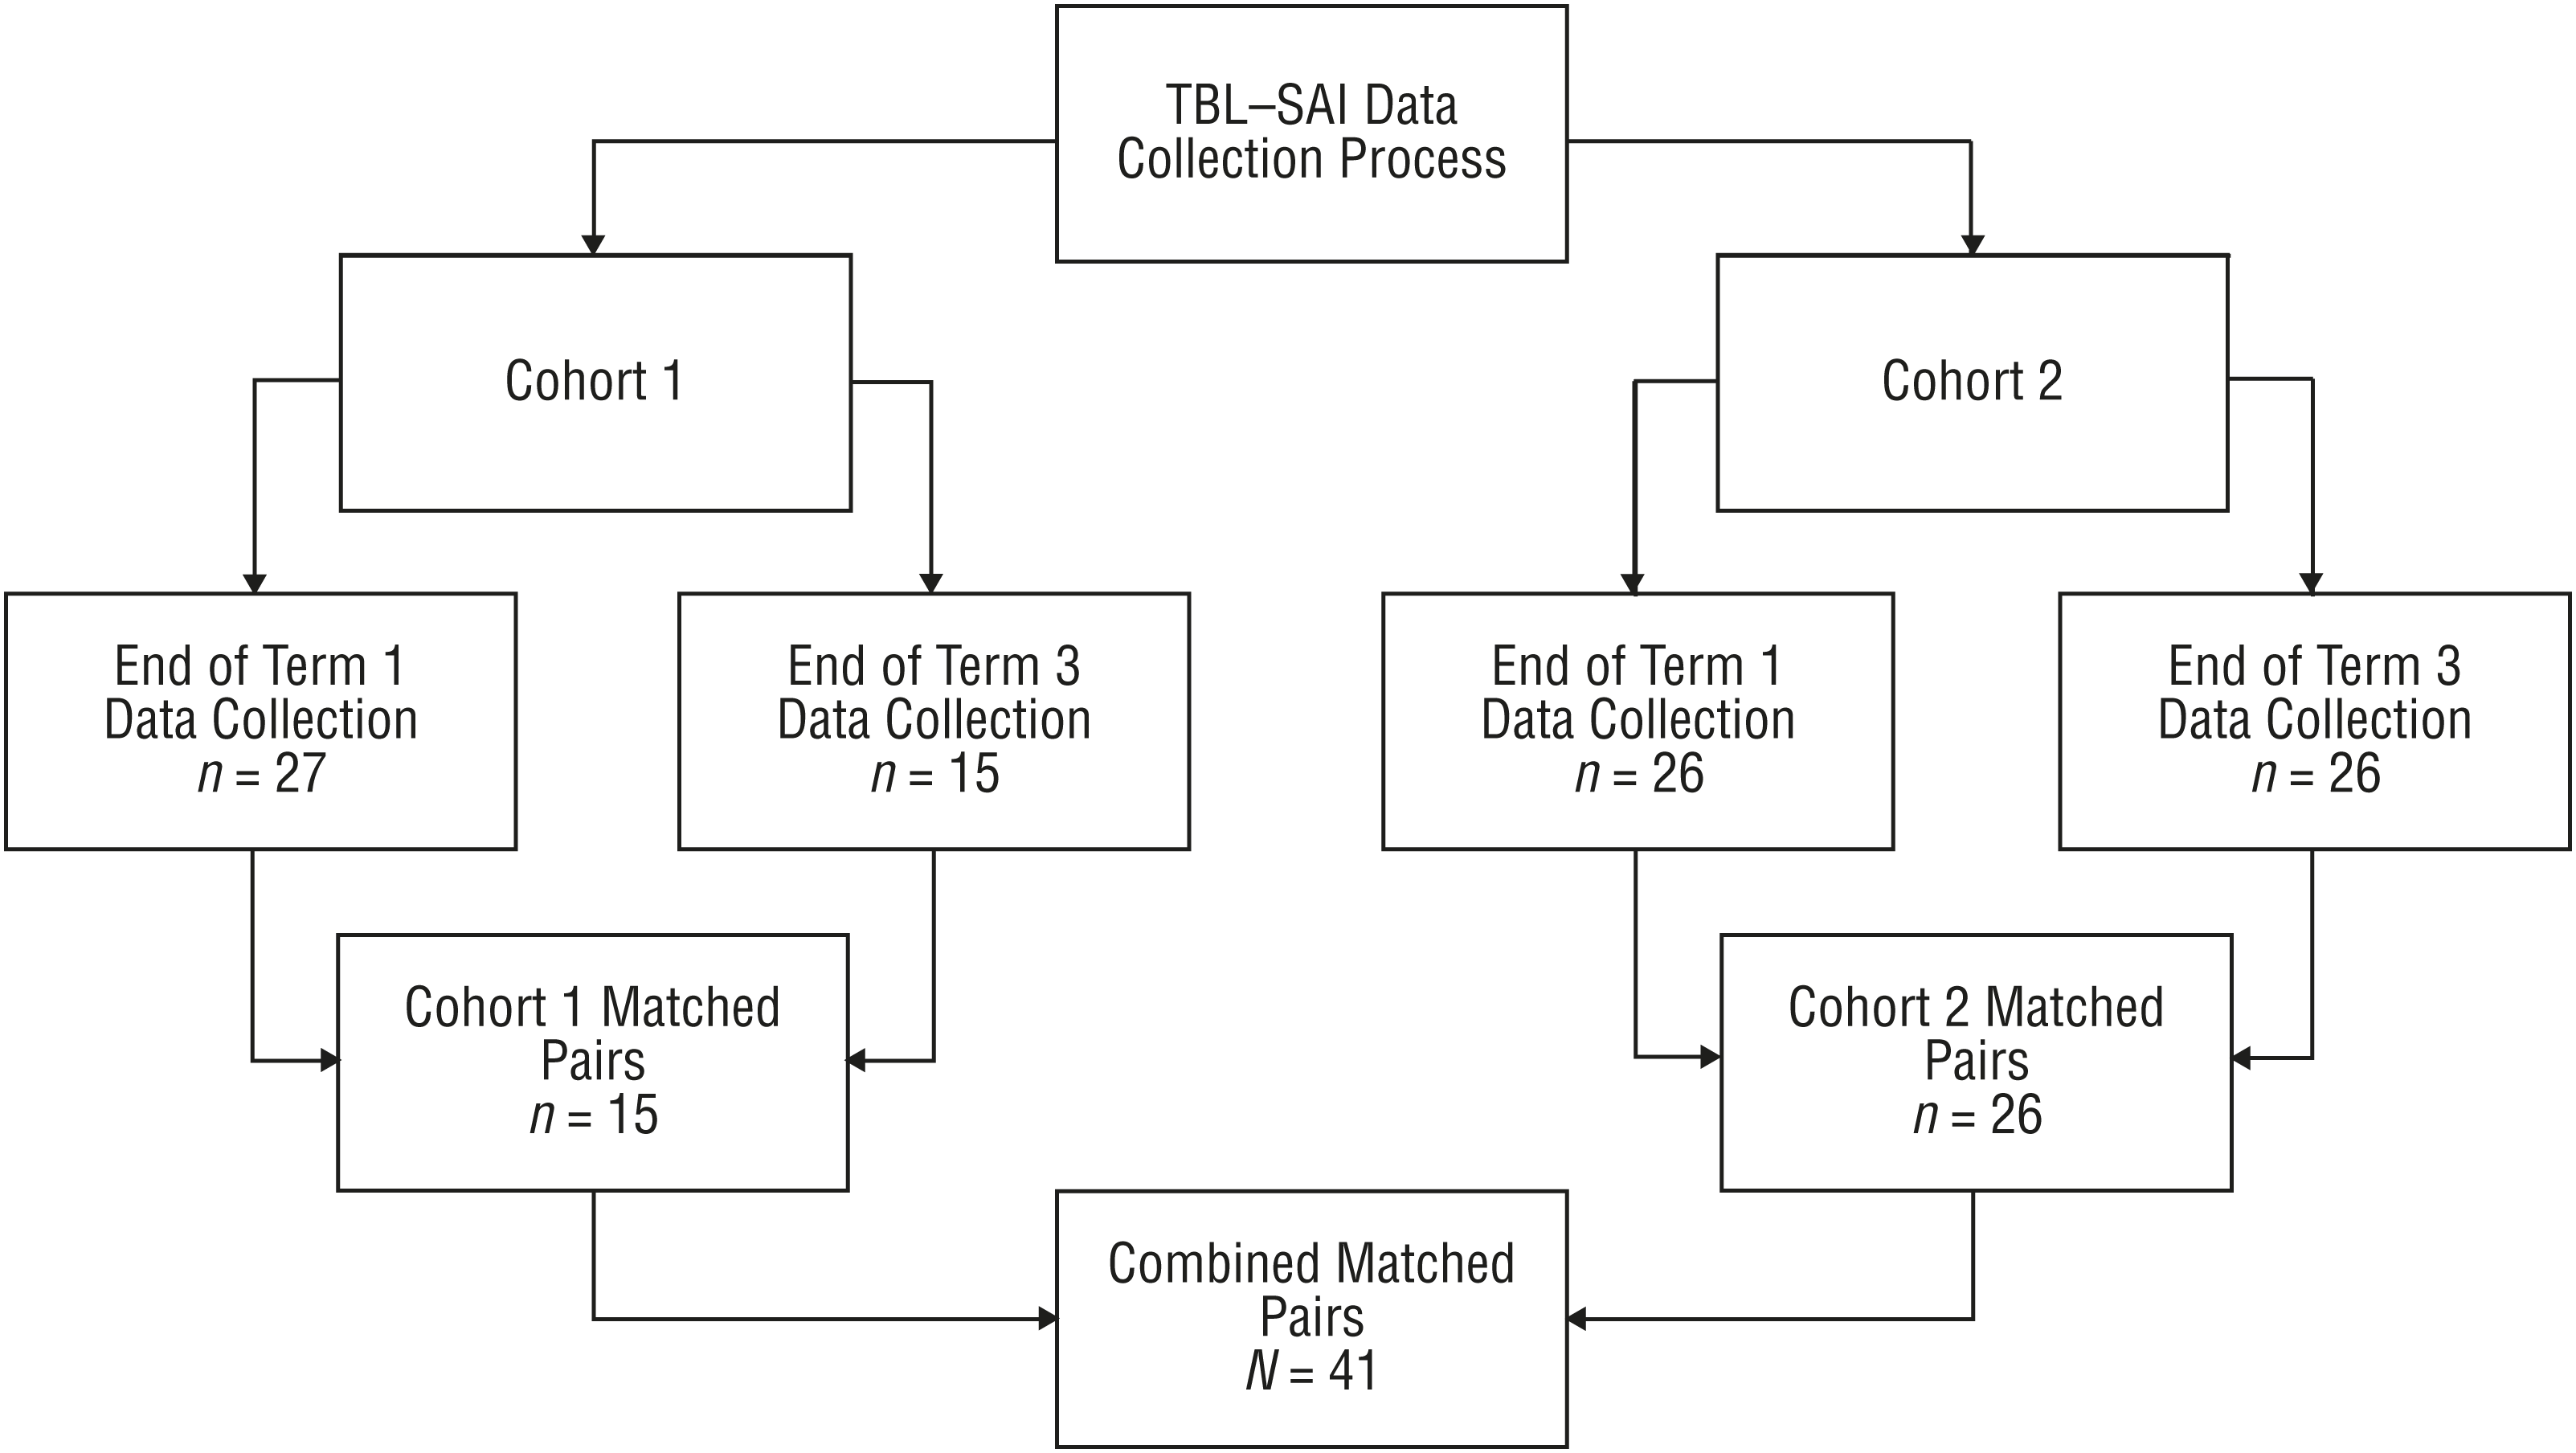
Data collection process for the Team-Based Learning Student Assessment Instrument (TBL–SAI).
Results
For mean scores, standard deviations (SDs), and percentage increases over neutral scores, see Table 1. On the Accountability subscale, possible scores ranged from 8 to 40, with a higher score indicating a higher level of accountability. After the first data collection point, the subscale scores ranged from 24 to 36, with a mean of 30.3 (SD = 3.16). After the second data collection point, the subscale scores ranged from 21 to 37, with a mean of 30.9 (SD = 3.27). With a score of 24 considered neutral, participants had a high level of accountability with TBL at both time points.
Individual and Combined Cohort TBL–SAI Data
Note. Team-Based Learning Student Assessment Instrument (TBL–SAI ) neutral scores were established by Mennenga (2012) to represent scores at which there is no preference for team-based learning (TBL) versus traditional lecture. Increasing subscale and total scores greater than the neutral scores indicate stronger affinity for TBL versus traditional learning. Combined = combined Cohort 1 and Cohort 2 scores; M = mean; SD = standard deviation.
On the Preference subscale, possible scores ranged from 16 to 80, with a higher score indicating a preference for TBL. After the first data collection point, the subscale scores ranged from 43 to 57, with a mean of 49.8 (SD = 3.38). After the second data collection point, the subscale scores ranged from 39 to 61, with a mean of 50.1 (SD = 4.69). With a score of 48 considered neutral, participants preferred TBL at both time points.
On the Satisfaction subscale, possible scores ranged from 9 to 45, with a higher score indicating a higher level of satisfaction with TBL. After the first data collection point, the subscale scores ranged from 21 to 37, with a mean of 29.8 (SD = 3.56). After the second data collection point, the subscale scores ranged from 18 to 37, with a mean of 29.5 (SD = 4.61). With a score of 27 considered neutral, participants had a high level of satisfaction with TBL at both time points.
A total instrument score was also calculated, with possible scores ranging from 33 to 165. A higher score indicated a more favorable experience with TBL. After the first data collection point, the subscale scores ranged from 96 to 127, with a mean of 109.9 (SD = 7.29). After the second data collection point, the subscale scores ranged from 86 to 132, with a mean of 110.5 (SD = 9.18). With a score of 99 considered neutral, participants had a generally favorable experience with TBL at both time points.
Repeated-measures ANOVA of TBL–SAI combined cohort scores after the first trimester and after the third trimester showed no statistical significance of subscale scores and total score between cohorts or within cohorts when scores were combined. However, when comparing scores of each cohort, statistical significance was found. In Cohort 1, students were significantly more satisfied after their third trimester (p = .021) than after their first trimester. In Cohort 2, comparing first- and third-trimester assessments, students were significantly more accountable (p = .027), and the overall total score was significantly higher (p = .019).
Discussion
This research project began with a question about how students’ self-reported experiences with TBL might change over time. Evidence investigating this subject is sparse; however, general evidence of students’ initial perceptions and our personal experience with how students adapted to TBL led to the alternative hypothesis that students would report statistically significant changes in perceptions of TBL over time. However, research data show that the null hypothesis is accepted. No statistically significant evidence was produced from two cohorts of master’s-level occupational therapy students (N = 41) that perceptions of TBL changed after repeated exposure; however, it should be noted that students reported a high level of accountability, preference for TBL, and overall satisfaction with TBL at both data collection points.
Despite the lack of evidence supporting the hypothesis, other data did contribute to existing evidence that students have a stronger affinity for TBL versus traditional lecture, especially in the areas of accountability, satisfaction, and critical thinking (Dearnley et al., 2018; Espey, 2018). In addition, these data points remained across repeated exposure.
Limitations
The sample size for this research needs to be enlarged to increase the generalizability of the results. Given the homogeneous nature of participants, it is possible that cohort effects greatly contributed to positive TBL–SAI scores. Also, the relatively short length of time between pre- and posttesting, and the limited volume of TBL exposure, may have skewed the data. Because only one faculty member, the PI, taught TBL, it is not possible to eliminate teacher bias in favor of TBL versus traditional lecture and student bias to favorably report their TBL experiences. Students also did not receive concurrent TBL exposure and had a mixture of TBL and traditional lecture both with other courses and even within the same course. It is difficult to know how the course layout and delivery may have affected TBL–SAI scores. A final limitation of the study is the homogeneity of the sample. In both cohorts, men and racial minorities were significantly underrepresented. Additional data collection from different institutions and professions is highly encouraged to obtain a more comprehensive understanding of how TBL preferences may change over time.
Implications for Occupational Therapy Practice
Occupational therapy education may be delivered from several andragogical and pedagogical theories. It is important to investigate and understand advantages and disadvantages of different teaching theories and resultant methods to produce quality educational outcomes and quality therapy practitioners. The following specific implications for practice are suggested:
Improved student accountability for learning may lead to improved accountability for learning evidence-based practice patterns.
Improved satisfaction with learning may lead to improved information retention and, thus, improved certification exam results and more knowledgeable entry-level practitioners.
Improved student satisfaction may lead to an improvement in faculty teaching experiences, reducing faculty attrition.
Student team interaction, including peer grading, may lead to increased team participation as future practitioners.
Conclusion
These findings may be the first to report how students’ perceptions of TBL change with multiple exposure over time. Given that students initially reported positive experiences with TBL and that these positive responses did not decline over time, it may be assumed that continuing use of TBL does not have a negative impact on students’ perceptions. For TBL teachers wondering about the novelty of TBL diminishing over time, these data show that this occurrence may not be the case. This research contributes to a growing body of evidence (Carrie et al., 2017; Göktepe et al., 2018; Gorman, 2017; Huang & Lin, 2017) supporting TBL as an effective and student-preferred teaching method and the TBL–SAI as an effective assessment tool for measuring this preference. Further research is needed to better understand students’ changing perceptions of TBL over time.
Footnotes
Acknowledgments
Roy Lukman’s passion, support, and sarcasm were invaluable in the completion of this study.