





Abstract
Children with sensory processing differences respond more intensely to auditory, visual, or tactile stimuli or require increased sensory stimuli to elicit a response (Dunn, 1997, 2001; Pfeiffer et al., 2017; Piller & Pfeiffer, 2016). The estimated prevalence rates of sensory processing differences range from 60% to 95% for children with autism spectrum disorder (ASD; Baranek et al., 2007; Koenig & Rudney, 2010), 40% to 50% for children with attention deficit hyperactivity disorder (Ghanizadeh, 2011; Mattard-Labrecque et al., 2013), and 5% to 16% for children in the general population (Ahn et al., 2004; Ben-Sasson et al., 2008).
Consistent with the Person–Environment–Occupation (PEO) framework (Law et al., 1996), sensory processing differences interact with environmental factors to enable or constrain children’s occupational performance and participation (American Occupational Therapy Association, 2014; Corbett et al., 2016; Pfeiffer et al., 2017; Piller & Pfeiffer, 2016). Sensory integration (SI) interventions aim to improve occupational performance by enhancing sensory processing capacities or making environmental modifications that provide sensory enrichment or calming effects (Lane et al., 2014). SI interventions have traditionally been evaluated on their effects on sensory–motor abilities (e.g., tactile perception, motor planning, visual perception) or a person’s capacity to perform specific skills (e.g., handwriting, balance, ball skills). A recent systematic review identified 15 sensory processing measures with known psychometric properties for preschool and school-age children (Jorquera-Cabrera et al., 2017). These include performance test measures (e.g., Sensory Integration and Praxis Test [Ayres, 1989], DeGangi–Berk Test of Sensory Integration [DeGangi & Berk, 1983]) and informant-report measures (e.g., Sensory Profile–2 [Dunn & Brown, 1997; Dunn & Westman, 1997], Sensory Processing Measure [Miller-Kuhaneck et al., 2007; Parham et al., 2007]). Existing tools primarily assess children’s ability to adapt, organize, and integrate sensory information. The degree to which sensory processing challenges affect occupational participation in home, school, and community contexts is underrepresented by existing measures even though these outcomes are highly prioritized by families (Cohn et al., 2014; Pfeiffer et al., 2017; Piller & Pfeiffer, 2016; Schaaf et al., 2011).
Although SI challenges are often recognized and treated in early childhood, most measurement tools do not assess the sensory environment’s impact on participation in contexts and activities that are salient for preschool and early school–age children (Glennon et al., 2011). For these children, participation in home-based activities is especially important because they spend the majority their time at home. Engagement in activities of daily living (ADLs), rest and sleep, play, and social interactions with family is critical for young children’s physical, cognitive, and social development. Accordingly, we developed the Participation and Sensory Environment Questionnaire–Home Scale (PSEQ–H) to assess the sensory environment’s impact on young children’s participation in home-based activities.
Conceptual and Qualitative Development of the Questionnaire
The World Health Organization (2001) provided a framework for understanding factors that may influence participation. These factors include people’s functional capacities, personal factors (e.g., culture, preferences, values), and environmental features (e.g., the availability of social, community, and structural resources). Person–environment fit drives participation in daily activities. Accordingly, children’s responses to their sensory environments influence their participation in daily activities. The PSEQ–H is intended to assess parent or caregiver perceptions of the degree to which the sensory environment impedes children’s participation in home-based activities. The questionnaire was created according to best-practice informant-report measure development and validation standards, including the COnsensus-based Standards for the selection of health Measurement INstruments (COSMIN; Mokkink et al., 2010).
Per COSMIN standards for content validity, we used qualitative methods to ensure that the PSEQ–H comprehensively measures concepts that are relevant, meaningful, and important to families of children with sensory challenges and that items were written using terminology that parents understood and considered relevant (Pfeiffer et al., 2017, 2018). Semistructured interviews were conducted with 34 parents or caregivers to determine how the sensory environment affects children’s participation at home and in the community (Pfeiffer et al., 2017). From these interviews, we generated a pool of 15 items that measure the sensory environment’s influence on children’s participation in ADLs, sleep and leisure, play, and social interactions with family members. All items use a 5-point Likert scale—1 (none), 2 (a little), 3 (some), 4 (a lot), and 5 (too much to participate)—whereby lower scores represent less environmental impact. Expert review and parent cognitive interviews (n = 34) led to item refinements and provided evidence of the tool’s content validity (Pfeiffer et al., 2018). The purpose of this study was to evaluate the PSEQ–H’s structural validity; item difficulty, discrimination, and bias; reliability; and construct validity.
Method
Participants
Participants were 305 parents of children ages 2–7 yr. Participants were purposively sampled to represent sociodemographically diverse families of children with ASD and neurotypical development. (Neurotypical means not displaying or characterized by autistic or other neurologically atypical patterns of thoughts or behavior. This term is widely used by people in the autism community to describe people who are not on the autism spectrum.) Parents were recruited by a collaborating school and via ASD support and social media sites. As expected, given the higher rates of ASD among boys in the general population, 76% (n = 127) and 53% (n = 72) of participants had boys in the ASD and neurotypical subsamples, respectively. The subsamples were otherwise similar in sociodemographic characteristics. The total (combined) sample was 80% White or Caucasian, 4% Black or African-American, 4% Hispanic or Latino, and 12% other races and ethnicities. Most families (96%) spoke English at home. Families’ residential community types were 26% urban, 53% suburban, 15% small town, and 7% rural. Annual family income exceeded $60,000 for 73% of families and $100,000 for 40% of families. To reduce participant burden, each family was randomly assigned to one of two groups. The first group was asked to complete the Caregiver Strain Questionnaire (CGSQ; Brannan et al., 1997). The second group was asked to complete the PSEQ–H again approximately 2 wk after the initial administration to enable evaluation of the measure’s test–retest reliability.
Measures
Child and Family Characteristics
Parents provided sociodemographic information, including child age, gender, race and ethnicity, family income, residential community type (urban, suburban, small town, rural), and the primary language spoken at home.
Autism Spectrum Disorder Symptoms
Parents completed the Gilliam Autism Rating Scale, Third Edition (GARS–3; Gilliam, 2014), a reliable and valid norm-referenced informant-report screener for ASD. A total Autism Index score combines restricted and repetitive behavior (13 items), social interaction (14 items), social community (9 items), and emotional response (8 items) scale scores for all children, plus two additional scale scores for nonverbal children: cognitive style (7 items) and maladaptive speech (7 items). Children who scored >70 on the GARS–3 Autism Index were put into the ASD subgroup (n = 167), and children who scored ≤70 were put in the neurotypical subgroup (n = 137).
Sensory Environmental Impact of Home-Based Participation
Parents completed the 15-item PSEQ–H (Table 1). Lower scores indicated fewer sensory environmental barriers to children’s participation.
PSEQ–H Item Descriptive Statistics, Bifactor CFA Factor Loadings, and IRT Parameters
Note. ASD = autism spectrum disorder; CFA = confirmatory factor analysis; IRT = item response theory; M = mean; NT = neurotypical; PSEQ–H = Participation and Sensory Environment Questionnaire–Home Scale; SD = standard deviation; — = not applicable. CFA model fit for full sample (n = 304): comparative fit index = 1.00; Tucker–Lewis fit index = 1.00; root mean square error of approximation = .04.
aGroup factors: G1 = dressing; G2 = self-care; G3 = sleeping; G4 = play and social interactions. b a = discrimination parameter; b 1–4 = difficulty parameters.
Caregiver Strain Questionnaire
A randomly selected subset of 135 parents (49 parents of children with ASD, 86 parents of neurotypical children) completed the CGSQ. CGSQ responders and nonresponders were demographically similar. The CGSQ assesses three dimensions of caregiver strain through the following subscales: Objective Strain (the negative consequences of caregiving such as disruption of personal time, financial strain, effect on work, and social isolation), Internalized Subjective Strain (negative feelings, such as worry, guilt, and unhappiness, which are internal to a caregiver), and Externalized Subjective Strain (negative feelings directed toward the child, such as anger, embarrassment, resentment, and relating poorly with the child). An overall strain score is calculated by summing these three subscale scores (Brannan et al., 1997). The CGSQ has strong reliability and validity evidence for families of children with ASD (Khanna et al., 2012).
Procedure
All measures were administered to parents online using Qualtrics (Provo, UT) Survey Software. A randomly selected subset of participants (n = 126) completed the PSEQ–H again approximately 2 wk after initial administration. All study procedures were approved by the institutional review board at Temple University (Philadelphia).
Data Analysis
The mean (M), standard deviation (SD), and range were calculated for each item. We expected PSEQ–H item responses to converge on a single underlying trait representing sensory environmental impact on children’s community participation. We also expected to observe shared variance within subsets of items that represented ADLs, sleep, and social activities. Accordingly, we fit a bifactor confirmatory factor analysis (CFA) model to the data using the lavaan package in R (Yves, 2012). In a bifactor representation, each item is allowed to have a positive loading on a general factor that explains intercorrelations among all items (Reise et al., 2007). In addition, items can also load on “group” factors, which capture covariation that is independent of the covariation that results from the general factor. We specified four group factors: dressing, self-care, sleeping, and play and social interactions (see Table 1). We evaluated model fit using three indices: comparative fit index (≥.95), Tucker–Lewis fit index (≥.95), and root mean square error of approximation (≤.08; Hu & Bentler, 1999). Assuming adequate model fit, items with loadings ≥.70 on the general factor were thought to contribute to the measurement of a unidimensional construct (Carle & Weech-Maldonado, 2012; Reise et al., 2007).
Next, we fit Samejima’s (2010) Graded Response Model to the PSEQ–H item response data to estimate Item Response Theory (IRT) discrimination and difficulty parameters for each item. The discrimination statistic (a) measures the degree to which an item differentiates respondents by their level of the latent trait (e.g., sensory environmental impact on participation). The IRT model also produces threshold parameters (b). For a measure with five response categories, the IRT model produces four item threshold statistics (b 1–b 4). Each b parameter indicates “how much” the sensory environment affects participation for children whose parents endorse a specific response for a particular item (e.g., the child’s response to sensory features of the environment has some impact on mealtime with family members).
IRT provides a framework for conceptualizing and investigating item bias, as evidenced by differential item functioning (DIF). An item exhibits DIF if the item response differs across groups, controlling for an estimate of the construct being measured. We tested for DIF between ASD and neurotypical subgroups using the lordif package in R (Choi et al., 2011). To test for both uniform and nonuniform DIF, lordif regresses an item’s ordered responses on an IRT-derived scale score and the indicator variables, such as ASD status. Items that showed a 1% change in the McFadden pseudo-R 2 measure were considered to demonstrate DIF (Crane et al., 2007).
Items were selected for inclusion in the final PSEQ–H on the basis of factor analytic, IRT, and DIF analyses. Internal consistency and test–retest reliability of the final PSEQ–H were evaluated using Cronbach’s α and intraclass correlation coefficients, respectively. Once scale composition was finalized, we calculated PSEQ–H scores for each respondent using Bayesian expected a posteriori estimation (Bock & Aitkin, 1981), which uses a person’s pattern of responses and IRT parameters to estimate a standardized θ score. The θ scores were linearly transformed to t scores as follows: (θ × 10) + 50.
To evaluate construct validity of the PSEQ–H, we tested for expected differences in total test scores between the ASD and the neurotypical subgroups using one-way analysis of variance. We used Pearson product–moment correlations to assess convergence between scores on the PSEQ–H and measures of caregiver strain (CGSQ subscale scores). We expected to observe positive associations of larger magnitude for children with ASD compared with neurotypically developing children. Last, we evaluated PSEQ–H score convergence with GARS–3 restricted and repetitive behavior, social interaction, social communication, and emotional response scale scores for children with ASD. We expected to observe positive, moderate associations with these measures of ASD symptoms. The small number of nonverbal children in the sample (n = 27) precluded tests of convergence with the GARS–3 measures of cognitive style and maladaptive speech.
Results
Item missing data rates were 2% or less for all items. As expected, parents of children with ASD had higher average scores and greater variation on all PSEQ–H items compared with parents of neurotypical children. The bifactor CFA model fit indices and factor loadings demonstrated the PSEQ–H’s unidimensionality in the full sample and in the ASD and neurotypical subgroups (see Table 1). After accounting for variance associated with the narrower dimensions, all items made significant contributions to the general factor (general factor loadings = .71–.91).
Discrimination and location parameters derived from the unidimensional graded response model are shown in Table 1. There was no evidence of meaningful DIF by child ASD status (ASD vs. neurotypical) for any item. Thus, CFA and IRT parameters are presented for the full combined sample. As evidenced by the discrimination parameters, all PSEQ–H items differentiated between children with varying degrees of participation in home-based activities (M = 2.03, SD = 0.75, range = 1.37–3.54). The items assess a wide range of sensory environmental impact on participation at home (bs range = –0.80 to 3.38). However, as shown by the largely positive b statistics, the PSEQ–H items provided more information about children with relatively moderate to high levels of participation limitations.
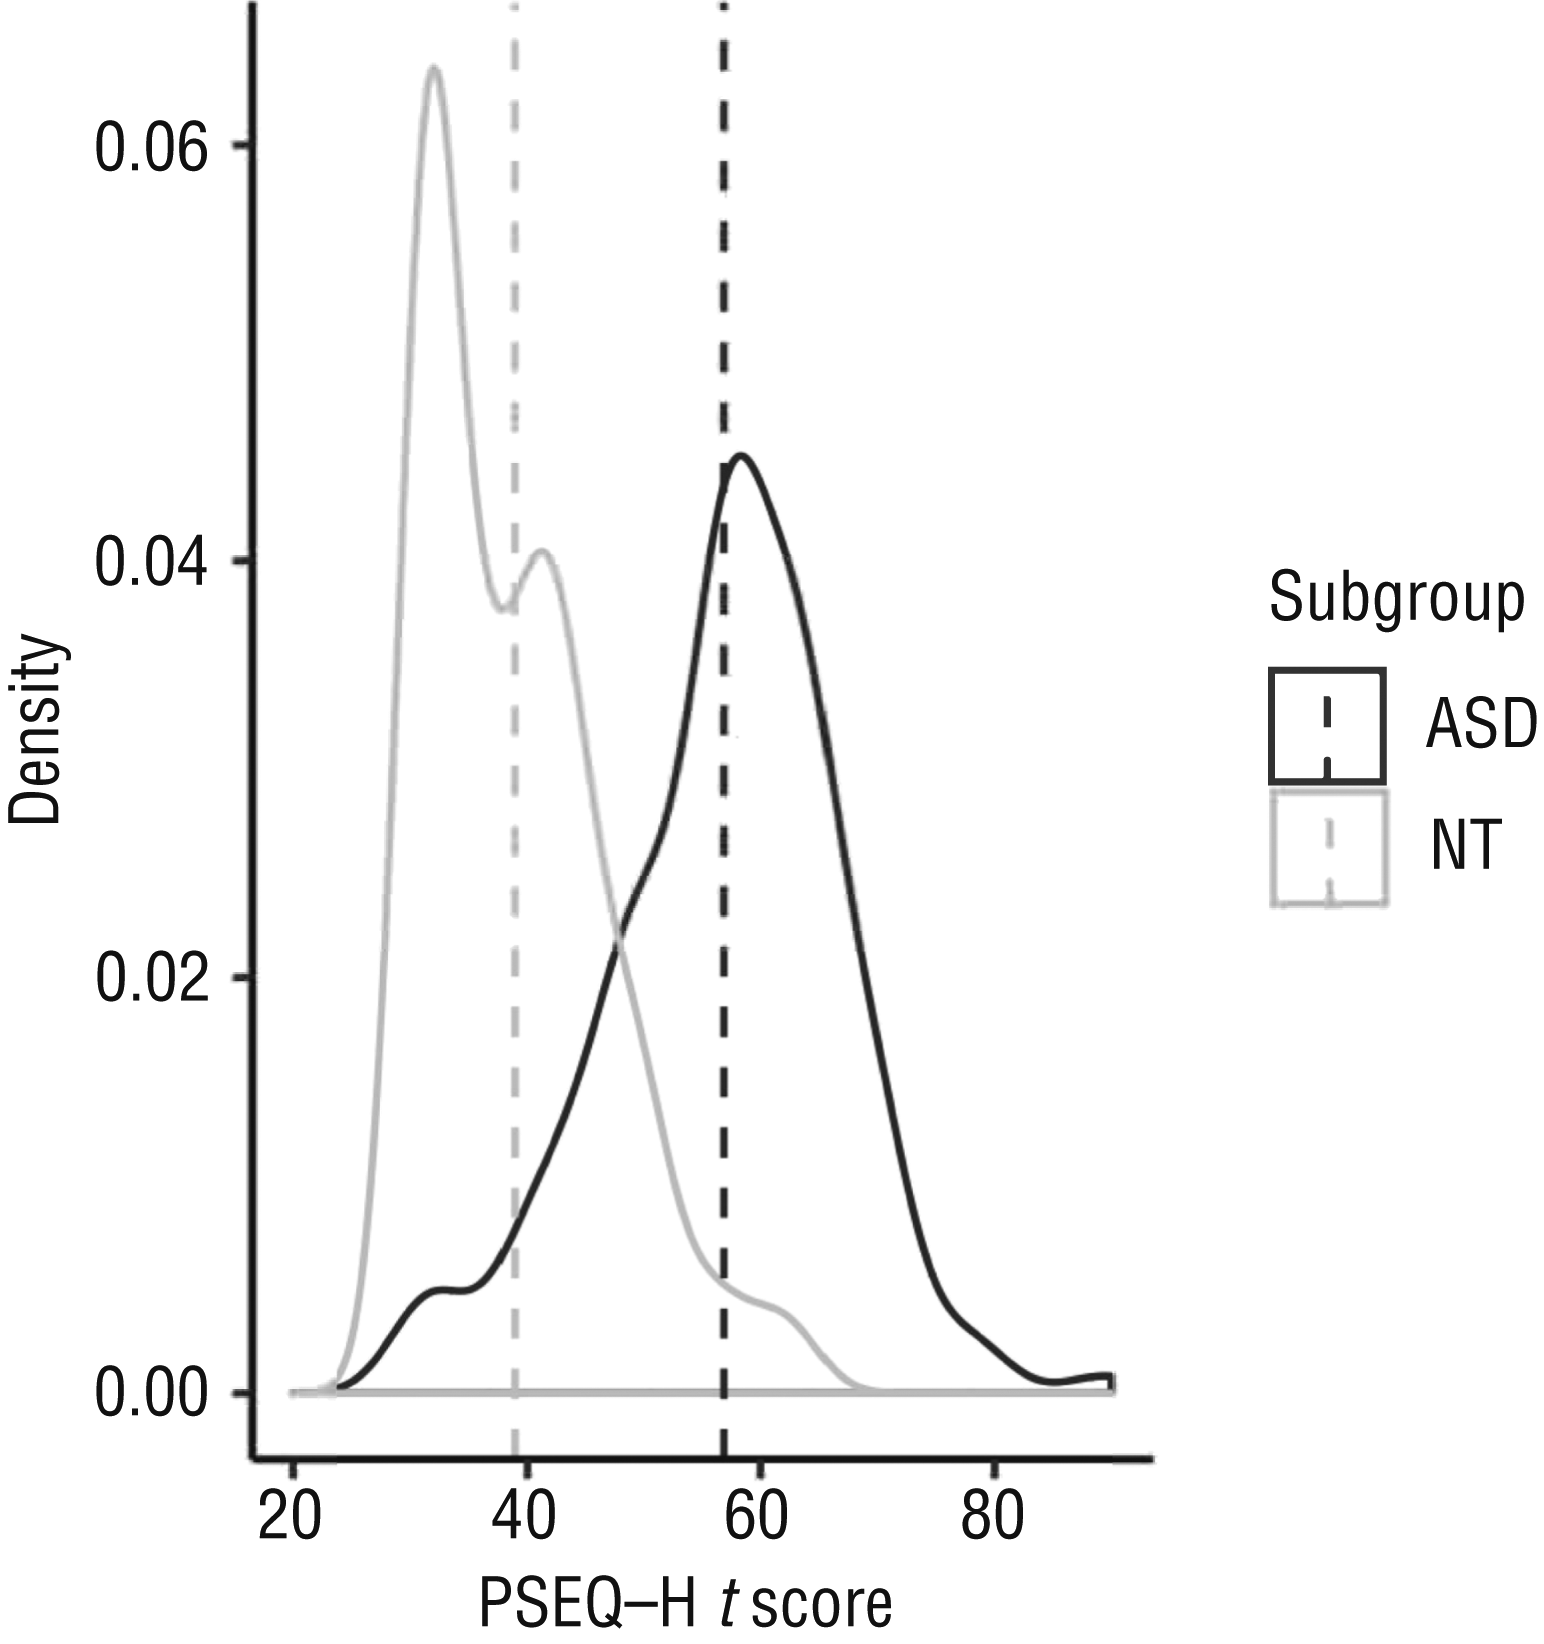
All 15 PSEQ–H items were retained in the final version of the questionnaire. Internal consistency and test–retest reliability were observed to be moderate for the full sample and for the ASD and neurotypical subgroups (Table 2). Known-groups comparisons and convergence with measures of caregiver strain and ASD symptoms provided evidence of construct validity. On average, children with ASD scored nearly 2 standard deviations higher on the PSEQ–H than their neurotypical peers, indicating greater participation challenges, F(1, 302) = 262.7, p < .0001 (see Table 2). Floor effects, indicating no sensory-related participation challenges, were observed for 35.8% (n = 49) of neurotypical children but only 4.2% (n = 7) of children with ASD. PSEQ–H t-score distributions are shown in Figure 1.
PSEQ–H Scale Scores, Bifactor CFA Model Fit Indices, and Reliability Indices
Note. ASD = autism spectrum disorder; CFA = confirmatory factor analysis; CFI = comparative fit index; ICC = intraclass correlation coefficient; M = mean; NT = neurotypical; PSEQ–H = Participation and Sensory Environment Questionnaire–Home Scale; RMSEA = root mean square error of approximation; SD = standard deviation; TLI = Tucker–Lewis index.
p < .0001. **p < .01.
Among children with ASD, PSEQ–H scores were positively associated with ASD symptom levels as measured by GARS–3 subscale scores (Table 3). In addition, PSEQ–H scores were significantly positively associated with all indicators of caregiver strain for parents of children with ASD as measured by the CGSQ (see Table 3). For parents of neurotypical children, a small but statistically significant association was observed between scores on the PSEQ–H and the CGSQ Objective Strain subscale.
PSEQ–H Concurrent Validity
Note. ASD = autism spectrum disorder; CGSQ = Caregiver Strain Questionnaire; GARS–3 = Gilliam Autism Rating Scale, 3rd edition; M = mean; NT = neurotypical; PSEQ–H = Participation and Sensory Environment Questionnaire–Home Scale; SD = standard deviation; — = not applicable.
CGSQ was administered to a randomly selected subsample of parents. bGARS–3 reported for the ASD subgroup only.
Discussion
SI interventions aim to increase participation by altering children’s sensory processing capacities or environmental exposures (Lane et al., 2014). Caregivers commonly identify greater participation in real-world contexts as an important indicator of SI intervention success (Pfeiffer et al., 2017; Piller & Pfeiffer, 2016; Schaaf et al., 2011). This study demonstrates that the PSEQ–H is a reliable and valid measure of sensory environmental impact on participation in home-based activities among preschool-age children with ASD and those with neurotypical development.
The PSEQ–H measures participation in activities that are affected by sensory processing challenges to varying degrees. As indicated by item difficulty and location parameters, altered sensations interfere with nail cutting and hair washing among many children of preschool and early school age, even those with no or mild sensory sensitivities. In contrast, the environmental impact on sleep- and play-related activities is primarily experienced by children with significant sensory processing challenges. Collectively, PSEQ–H items reflect a wide range of sensory-related challenges that influence children’s occupational performance and participation.
Consistent with prior research, children with ASD experienced greater sensory-related restrictions in self-care activities, mealtime and bedtime routines, and social interactions than neurotypically developing children (Baranek et al., 2007; Koenig & Rudney, 2010; Piller & Pfeiffer, 2016). Among children with ASD, construct validity of the PSEQ–H was evidenced by positive associations with ASD symptom severity. The magnitude of association was largest for repetitive restricted behaviors, which include sensory–motor behaviors and insistence on sameness (Bishop et al., 2013). For children with ASD and sensory processing challenges, environmental demands may lead to a cascade of negative responses, including repetitive motor behaviors, anxiety, and behavioral noncompliance, each of which impede participation and occupational performance. These responses may be especially pronounced among children who react negatively to changing or disrupted routines.
Although more common among children with ASD, it is notable that about 65% of children with neurotypical development experienced at least some activity limitation as a result of sensory sensitivities (as measured by the PSEQ–H). All PSEQ–H items are free of meaningful measurement bias (as evidenced by DIF), indicating that the tool is appropriate for use with children with ASD and those with neurotypical development. Overall, the PSEQ–H provides a reliable and valid assessment of the sensory environment’s impact on young children’s participation in home-based activities.
Limitations and Future Research
PSEQ–H test–retest reliability is moderate for children with ASD and those with neurotypical development. In future iterations of the tool, test–retest reliability may be improved by increasing objectivity of the response categories. For example, a little could be changed to a little (less than once a week) and some could be refined to say some (1–3 days of the week). The PSEQ–H is a more precise measure of greater than average levels of sensory-related participation restrictions. The addition of items that capture less severe restrictions may strengthen the tool’s sensitivity to change in response to environmental modifications or SI interventions. Longitudinal data are needed to evaluate the tool’s predictive validity and responsiveness to change. Finally, psychometric properties of the PSEQ–H should be further evaluated in samples that better represent general population sociodemographics.
Implications for Occupational Therapy Practice
Results of this study have the following implications for occupational therapy practice:
The PSEQ–H provides a reliable and valid method to evaluate the impact of the sensory environment on participation in home-based activities among children of preschool and early school age. As assessment is the first step in the occupational therapy process, the tool provides foundational information for designing occupational therapy interventions.
In accordance with the PEO framework, occupational therapy practitioners modify the environment to enhance PEO fit. The PSEQ–H provides a method for occupational therapy practitioners to identify targets for environmental modification and to evaluate the effectiveness of such interventions.
Consistent with family-centered care principles, occupational therapy interventions should aim to enhance both participation of the child and the family. Interventions that enable children with sensory processing challenges to participate in home-based activities may reduce caregiver burden, which is an important outcome for children with ASD.
Conclusion
Occupational therapists commonly identify and treat SI challenges in children. The PSEQ–H measures parents’ perceptions of the degree to which sensory challenges interfere with children’s participation in ADLs, social interactions, and play activities at home. The scale provides reliable, valid, and unbiased estimates of the sensory environment’s impact on home-based participation in young children with ASD and neurotypical development.