





Abstract
Developmentally appropriate processing of sensory information (i.e., reception, modulation, integration, and organization of and responses to sensory inputs) is essential to children’s emotional development, social interaction capabilities, parent–child attachment, and early self-regulation (Parham & Mailloux, 2010). Impairment in sensory processing, sometimes referred to as sensory processing disorder (SPD), affects the ability to process and regulate sensory information and to generate appropriate responses to everyday sensations (Lane, 2002). SPD manifests itself in maladaptive behaviors such as distractibility, impulsiveness, hyperactivity, behavioral disorganization, anxiety, and emotional lability, which further hamper participation in activities of daily living, play, and social interaction (Dunn et al., 2016). Moreover, sensory processing difficulties in infancy have been reported to be associated with an increased risk for developmental delays and social–emotional problems in later childhood (DeGangi et al., 2000; Watson et al., 2011).
The prevalence of SPD in the typical population ranges from 5% to 16% (James et al., 2011); it is commonly seen among children with a range of developmental disabilities (DD; Engel-Yeger et al., 2011) and has a much higher prevalence (60%–90%) in children with autism spectrum disorder (ASD; Ben-Sasson et al., 2009; Tseng et al., 2011). Children with attention deficit hyperactivity disorder also present with a high prevalence of SPD (Ghanizadeh, 2011; Miller et al., 2012).
To enable early identification of a child’s challenges in sensory processing and take advantage of the critical period of early childhood, a reliable and valid assessment tool is essential (Eeles et al., 2013). Among the various methods of assessing sensory processing functions, using a sensory questionnaire enables occupational therapy practitioners to gather information from parents or caregivers about the child’s responses to sensory experiences in the natural settings in which the child functions (Parham & Mailloux, 2010).
Several published questionnaires are available for evaluating young children’s sensory processing function in Western countries, including the Sensory Processing Measure–Preschool (SPM–Preschool; Ecker & Parham, 2010), the Touch Inventory for Preschoolers (TIP; Royeen, 1987), the Sensory Rating Scale (SRS; Provost & Oetter, 1993), the Sensory Experiences Questionnaire (SEQ; Baranek et al., 2006), the First Year Inventory (FYI; Turner-Brown et al., 2013), and the Infant/Toddler Sensory Profile (ITSP; Dunn, 2002) and its revision, the Sensory Profile–2 (Dunn, 2014). However, few standardized questionnaires are available exclusively for children younger than age 3 yr, and several other limitations of these questionnaires have been noted. For example, the SPM–Preschool, designed for preschool-aged children (2–5 yr old), is not available for infants younger than age 2 yr. The TIP assesses only one sensory system (tactile). The SRS measures only sensory defensive behaviors, and its length (88 items for 0–8 mo and 136 items for 9–36 mo) may make it too time consuming for parents or caregivers to complete. The SEQ and the FYI are designed specifically to identify sensory issues in children with ASD or risk for ASD in young children and, thus, have a narrow application (Eeles et al., 2013).
Dunn (2002) developed the ITSP to measure sensory processing abilities in children from birth to age 36 mo. The ITSP, which is based on the Sensory Processing Model, was selected from the available tests for use in Taiwan for young Chinese children because it has several advantages: It is based on a theoretical model of sensory processing that considers both neurological threshold and behavioral response to sensation; is designed and standardized for children ages 0–3 yr; is quick and simple to administer, score, and interpret; and has been used frequently in research and in the clinic. In addition, the ITSP links sensory processing with the child’s daily life performance. It also involves parents in the assessment process and is therefore helpful in obtaining information about the child’s performance at home, enabling efficient identification of factors and conditions that support the child’s successful participation in daily activities in the natural context.
Neurological thresholds are the critical level to which a membrane potential must be depolarized to initiate an action potential (Dunn, 2002), whereas self-regulation strategies refer to a behavioral construct involving a person’s ability to manage his or her emotions and behavior in accordance with the demands of a situation (Dunn, 2002). Dunn and Westman (1997) developed a model of sensory processing that includes four patterns of sensory processing arising from the interaction of neurological thresholds and self-regulation strategies:
Low registration, which represents high thresholds and passive behavioral responses;
Sensation seeking, which represents high thresholds and active behavioral responses;
Sensory sensitivity, which represents low thresholds and passive behavioral responses; and
Sensation avoiding, which represents low thresholds and active behavioral responses.
Both low registration and sensation seeking represent sensory underresponsiveness, whereas both sensory sensitivity and sensation avoiding represent overresponsiveness (Dunn, 2002).
Because cultural and environmental factors influence human behavior and performance (Dunn, 2002), people from different cultural groups are expected to differ in their response to or performance on a particular assessment. The aims of this study were therefore twofold: to translate and cross-culturally adapt the ITSP into a Chinese version (ITSP–C) and to investigate the psychometric properties of the ITSP–C when used with Taiwanese children.
Method
Phase 1: Translation and Cultural Adaptation Process
Measure
The ITSP is a caregiver questionnaire that measures how children respond to sensory events in daily life. The ITSP consists of 36 items for children from birth to age 6 mo (the 0–6 mo subscale) and 48 items for children from ages 7 to 36 mo (the 7–36 mo subscale). The questions applicable to the younger age group contain five sensory processing sections (general, auditory, visual, tactile, and vestibular). An additional section for oral sensory processing was developed for the older age group, to total six sections.
Scores are grouped into four quadrant scores (low registration, sensation seeking, sensory sensitivity, sensation avoiding) based on Dunn’s Model of Sensory Processing (Dunn & Westman, 1997). Caregivers report the frequency with which their child engages in a behavior using a 5-point Likert scale (1 = always, 2 = frequently, 3 = occasionally, 4 = seldom, and 5 = never). Lower scores suggest a higher frequency of response. Section scores and quadrant scores are interpreted by comparing a child’s score with age-matched norms based on the normal curve (Figure1). The two classifications for children ages birth–6 mo are typical performance and probable difference (for which consultation and follow-up are recommended). The three classifications for children ages 7–36 mo are typical performance, probable difference, and definite difference.
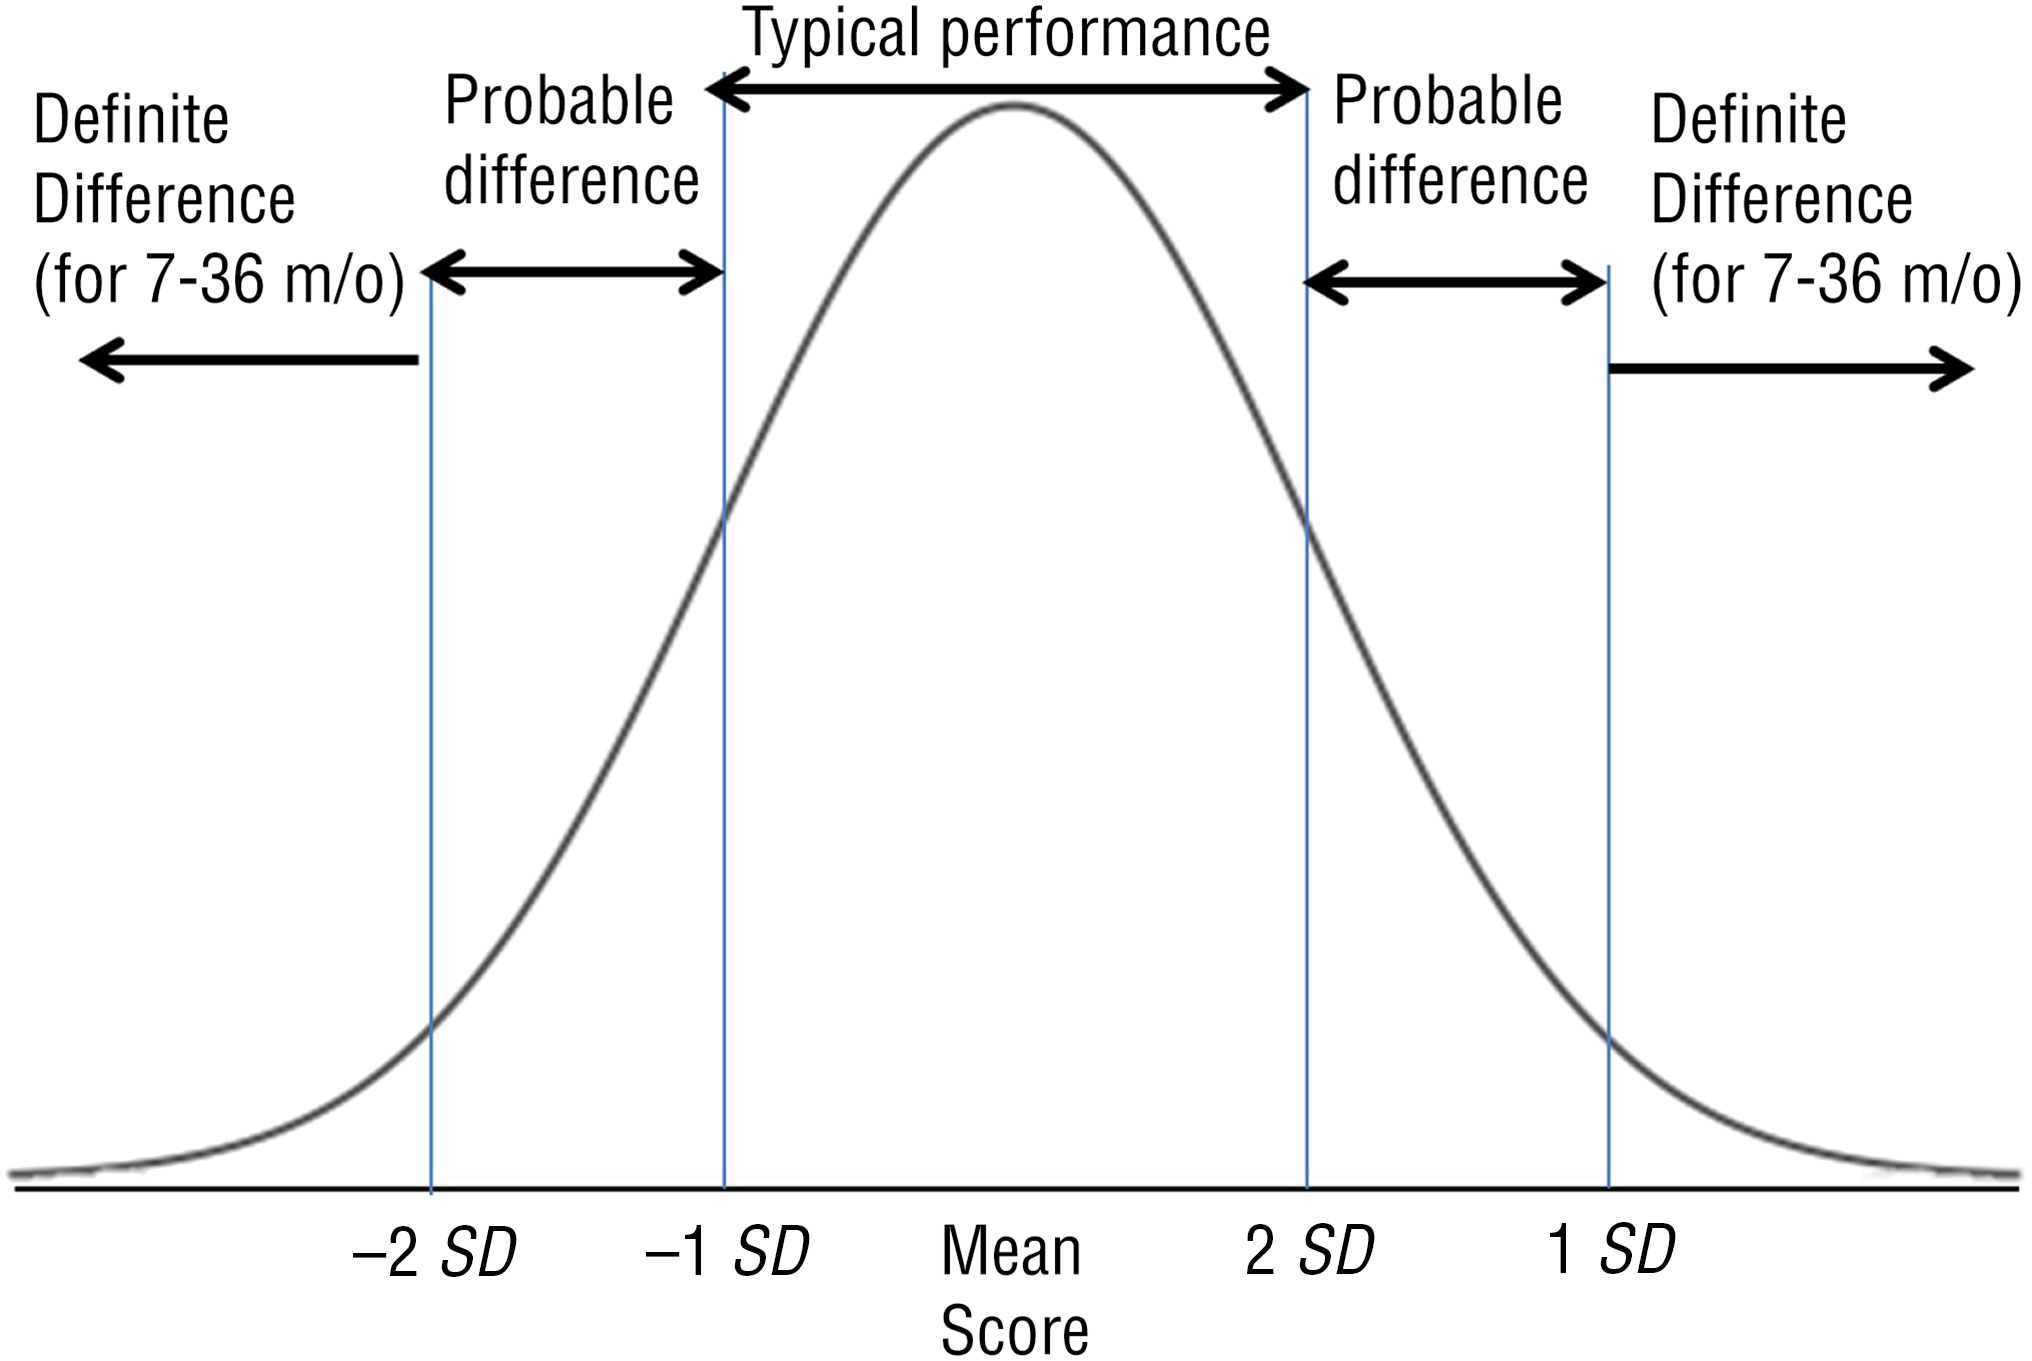
Infant/Toddler Sensory Profile score classification system.
The ITSP demonstrates sound psychometric properties (Dunn, 2002; Dunn & Brown, 1997). For quadrant scores, Cronbach’s coefficients ranged from .56 to .79 for the 0–6 mo subscale and from .70 to .86 for the 7–36 mo subscale. The overall coefficients indicate adequate to good test–retest reliability for both the section scores (mean [M] intraclass correlation coefficient [ICC] = .86) and the quadrant scores (M ICC = .74) over 2–3 wk. No test–retest reliability was reported for each individual sensory section or quadrant. The validity of the ITSP was supported by its utility for differentiating toddlers with ASD from typically developing (TD) toddlers (Ben-Sasson et al., 2007).
Procedure
With authorization from the Psychological Corporation (San Antonio, TX), a forward-back translation process was conducted to adapt the ITSP from English to Chinese according to guidelines developed by Beaton and colleagues (2000) for cross-cultural adaptation of instruments. The ITSP was translated into Chinese by a committee of three faculty members specialized in sensory integration. Both semantic equivalence and cultural relevance were considered to ensure conceptual equivalence in the Chinese translation. An English teacher without knowledge of the ITSP then back-translated the Chinese translation into English. The committee then compared the back translation and the original, discussed discrepancies, and revised the Chinese translations. This process was iterated until a satisfactory Chinese translation was agreed upon.
The document was then used for subsequent cognitive debriefing interviews with 10 parents of children with DD to further assess the clarity, comprehension, cultural relevance, and appropriateness of expression, words, or phrases. On the basis of parents’ input, the committee modified the Chinese translation, which was then used to evaluate its psychometric properties in Phase 2 of the study.
Phase 2: Reliability and Validity
Measure
The ITSP–C is a caregiver questionnaire with 36 items for infants ages 0–6 mo (hereinafter, the 0–6 mo subscale) and 48 items for toddlers ages 7–36 mo (hereinafter, the 7–36 mo subscale).
Participants
Participants consisted of two cohorts, 1,044 TD children and 42 children with DD (Table 1). Inclusion criteria for TD children were full-term infants and toddlers between ages 0 and 36 mo. Children were excluded from the TD group if they had any known genetic, physical, or neurological problems that affect child development; regularly prescribed medications for any physical or neurological problems; or received early intervention or special education services.
Participant Demographics
Note. M = mean; SD = standard deviation; — = not applicable.
Forty-two children with DD participated in the discriminative validity study for the 7–36 mo subscale, including 33 (81%) with developmental delays and 9 (19%) with autism. Thirty of their caregivers participated in the test–retest reliability study.
Procedure
This study was approved by the institutional review board of the National Taiwan University Hospital. The research project’s purpose and the procedure were explained to directors of well-baby clinics of a medical center, five preschools, and three health centers in northern Taiwan. Consent forms and cover letters were distributed to the parents at these facilities. Parents who signed informed consents were interviewed by the researcher (Chien-Ying Yang) about their child’s medical history. The questionnaires were then given to the parents whose child met the inclusion and exclusion criteria. Of 1,150 questionnaires distributed to parents of TD infants and toddlers, 1,067 were returned, giving a response rate of 92.8%. Of those 1,067, 23 were excluded because of missing data from greater than 50% of the items in one section, resulting in a total of 1,044 valid questionnaires (97.8%).
For the discriminative validity study, we recruited 42 children ages 7–36 mo with DD or autism from two child developmental centers and two rehabilitation departments of general hospitals in the greater Taipei area. Previous research has indicated that children with DD have a higher prevalence of sensory processing disorders than TD children (Baranek et al., 2006); therefore, this group of children was considered appropriate for the discriminative validity study. Among them, 30 caregivers gave informed consent to complete the same questionnaire again 2–3 wk later for test–retest reliability.
Statistical Analysis
Data were analyzed using IBM SPSS Statistics (Version 14.0; IBM Corp., Armonk, NY), and SAS 9.3 (SAS Institute, Cary, NC). Two-tailed tests were performed, and p ≤ .05 was considered statistically significant for all analyses. All the missing data in the ITSP–C items were replaced with the median values for each age group.
Internal consistency of each sensory section and quadrant grouping for both the 0–6 mo subscale and the 7–36 mo subscale of the ITSP–C was assessed by Cronbach’s α based on the first measurement. Cronbach’s α ≥.60 and <.70 is considered acceptable and ≥.70 is considered high (Portney & Watkins, 2009).
Test–retest reliability of each sensory section and quadrant grouping for the 7–36 mo subscale was examined using ICCs with a 2- to 3-wk interval. ICCs are interpreted as follows: poor (<.50), moderate (.50–.74), good (.75–.90), and excellent (>.90; Portney & Watkins, 2009).
The effects of sex and age and their interactions on the ITSP–C sections and quadrants for the 0–6 mo subscale and the 7–36 mo subscale, respectively, were assessed using stepwise regression analyses in TD children. Each section and quadrant score was entered as a dependent variable, whereas a child’s sex, age, and the interaction of sex and age were independent variables.
To examine the discriminative validity of the ITSP–C, a total of 42 children with DD and 126 age-matched TD children randomly selected by SAS 9.3 software from the TD sample served as participants. Two separate multiple logistic regression analysis models were constructed to examine the discriminative validity of the ITSP–C for the identification of DD. The first model (Model 1) used five section scores (auditory, visual, tactile, vestibular, and oral sensory) as the independent variables. The second model (Model 2) used four quadrant scores as the independent variables.
Final multiple logistic regression models for Models 1 and 2 were obtained by applying the stepwise variable selection procedure with both significance levels for entry and for stay set to .15 or greater (Hosmer & Lemeshow, 2000). After the stepwise variable selection, only the statistically significant or borderline significant (.05 < p ≤ .10) covariates stayed in the final regression model for parsimony. The goodness-of-fit (GOF) tests (including deviance test, Pearson χ2 test, and the Hosmer and Lemeshow test) for logistic regression analysis were used to assess the fit of the final regression model (Hosmer & Lemeshow, 2000).
Results
Internal Consistency
Cronbach’s α was determined for each section and quadrant on the ITSP–C and the ITSP (Table 2). Internal consistency was high for the 0–6 mo subscale (.81) and the 7–36 mo subscale (.82). For the sensory sections of the 0–6 mo subscale, internal consistency was generally low (.42–.56) except for the tactile section (.65), which was acceptable. Of the four quadrants of the 0–6 mo subscale, three were acceptable to high (.67–.75), whereas sensation avoiding was low (.57). Of the six sensory sections of the 7–36 mo scale, three had acceptable to high internal consistency (.63–.74), whereas visual, vestibular, and oral were low (.48–.57). All four quadrant scores had high internal consistency (.71–.87).
Cronbach’s α for Sections and Quadrants by Age Group
Note. ITSP = Infant/Toddler Sensory Profile; ITSP–C = Chinese version of the Infant/Toddler Sensory Profile; — = not applicable.
Test–Retest Reliability
Test–retest reliability of the 7–36 mo subscale for the sample of children with DD was excellent for the total subscale (ICC = .94) and moderate to excellent for the six sections (ICCs = .56–.91; M = .77, standard deviation [SD] = .13) and the four quadrants (ICCs = .71–.91; M = .86, SD = .10).
Age and Sex Differences
A total of nine stepwise multiple linear regression analyses were conducted for five sections and four quadrants for the 0–6 mo subscale and the 7–36 mo subscale, respectively. For infants ages 0–6 mo, age differences were noted in low registration and sensory seeking quadrant scores (p < .05); older children scored higher on low registration, indicating more typical registration, but lower on sensory seeking, indicating greater frequency of sensory seeking behavior. However, the values of R 2 were low (.01 for low registration and .28 for sensory seeking). No sex difference or any interaction between age and sex was noted.
For toddlers ages 7–36 mo, age differences were noted in the quadrants of sensation seeking and the oral sensory processing section, in which older children scored higher. Sex differences were noted in sensation seeking, with boys scoring lower than girls (boys, M = 31.96, SD = 10.12; girls, M = 33.76, SD = 10.44), indicating more sensory seeking behaviors in boys. Sex differences were also noted in the tactile sensory processing section, with boys scoring lower than girls (boys, M = 49.94, SD = 7.13; girls, M = 52.08, SD = 7.01), indicating poorer tactile processing in boys. The interaction between sex and age was significant on three quadrant scores (low registration, sensory sensitivity, and sensation avoiding) and on three section scores (auditory, visual, and vestibular processing), with older boys scoring lower than younger boys but no age effects for girls.
Discriminative Validity
The fitted final multiple logistic regression Model 1 showed that the ITSP–C sections of auditory, visual, and vestibular processing each significantly discriminate between children with DD and TD children. Specifically, children with auditory or visual scores that fall in the probable difference range (1–2 SD below the mean) have a higher chance of being identified as having DD (odds ratio = 4.316, p < .01 for auditory; odds ratio = 2.744, p < .01 for visual). In addition, children whose vestibular processing scores fall in the probable difference range (1–2 SD above the mean) have an increased chance of being identified as having DD (odds ratio = 3.100, p < .01).
Likewise, Model 2 revealed that the low registration and sensory avoiding quadrant scores each significantly discriminate between children with DD and TD children. Children who scored in the probable difference range on low registration had a higher chance of being identified as having DD (odds ratio = 5.418, p < .01). However, children who scored in the typical performance range on sensation avoiding had a decreased chance of being identified as having DD (odds ratio = 0.364, p < .01). All the GOF tests indicated that logistic regression models fit the data well (Table 3).
Discriminative Validity of the ITSP–C: Multiple Logistic Regression Model for Identification of Developmental Disabilities
Note. Logistic regression Model 1: n = 168, Hosmer and Lemeshow goodness-of-fit test χ2 = 0.7297, p > .05; logistic regression Model 2: n = 168, Hosmer and Lemeshow goodness-of-fit test χ2 = 0.1564, p > .05. ITSP–C = Chinese Version of Infant/Toddler Sensory Profile; OR = odds ratio; SD = standard deviation; SE = standard error.
Discussion
This study describes the cross-cultural adaptation of the ITSP (Dunn, 2002) into Chinese for identifying infants and toddlers with sensory processing problems. Through a series of rigorous procedures, the current study demonstrated that when used with young children in Taiwan, the ITSP–C is similar to the original ITSP regarding reliability and validity.
Internal consistency of quadrants and section scores of the ITSP–C in the current study was similar to or higher than that of the original ITSP (Dunn, 2002). Even though the internal consistency was high for both subscales, internal consistency of sections and quadrants of the 0–6 mo subscale was generally lower than that of the 7–36 mo subscale, consistent with the findings of Dunn (2002). In addition, Cronbach’s α was lower for sections than for quadrants on both subscales. This finding may reflect the smaller number of items in sections compared with items in quadrants and the relatively less stable neurophysiological functioning of young infants compared with older infants. Therefore, our results support Dunn’s (2002) suggestions of not providing sensory processing section scores for children ages birth to 6 mo when interpreting the test scores because of low internal consistency and low stability for this age group. In fact, in the Sensory Profile–2, Dunn (2014) separated the infant items from the toddler items, and the Sensory Profile–2 reports only the total score for 0- to 6-mo-olds because this score is considered a more reliable indicator of risk.
Test–retest reliability of the ITSP–C for the 7–36 mo subscale was moderate to excellent, with quadrant scores (ICCs = .71–.91) being more stable than section scores (ICCs = .56–.91) for children with DD. The lowest ICC was for visual processing (ICC = .56), a finding consistent with the results of Ohl et al. (2012) on the Sensory Profile for older children. This finding suggests that this behavior is difficult to accurately observe. The finding of the reliability study indicates that the quadrant scores of the ITSP–C are generally more stable than the section scores. Therefore, the quadrant scores are recommended for interpretation, as is also suggested by Dunn (2002) for the original ITSP.
Age differences were noted in aspects of sensory processing patterns in both age groups. For infants ages 0–6 mo, older infants had higher scores than younger infants in the low registration quadrant, indicating better registration of sensory stimuli. As infants and toddlers mature, their sensory processing function may become more efficient, leading to better sensory registration. In addition, older infants had increased frequency of sensory seeking behaviors than younger infants, possibly because 6-mo-old infants have developed better motor skills than during their first few months of life. Therefore, they explore their surroundings more often, resulting in increased frequency of sensory seeking behavior.
In children ages 7–36 mo, a developmental trend of decreased frequency of sensory seeking behaviors was noted, a finding consistent with studies on American infants and toddlers using the ITSP (Dunn, 2002). A deeper look at the items in the sensory seeking quadrant reveals that among the 14 items, only 2 are related to mobility: bouncing and rocking. The rest of the 12 items involve auditory, visual, tactile, and oral sensory processing, which are more sedentary in nature, such as making sounds with the mouth or liking to look at spinning objects. As children get older, they may become more acquainted with these sensory stimuli in their surroundings, leading to decreased sensory seeking behaviors. In addition, a developmental trend of fewer oral sensory processing issues was found in older children, which was in accordance with Dunn’s (2002) study. It is likely that infants’ and toddlers’ behavioral responses become more stable when sensory stimuli such as oral sensory input experienced in daily life become more familiar and expected. It is also possible that parents might become more tolerant of children’s behavior as they grow older.
In this study, no sex differences were noted among infants ages 0–6 mo in any quadrants. However, among infants and toddlers ages 7–36 mo, sex differences were noted in the sensation seeking quadrant, with boys scoring lower (more sensation seeking behavior) than girls. This finding is consistent with the literature that boys are more physically active than girls, even at young ages (Ellis et al., 2016). Additionally, the results showed that boys score lower than girls on tactile processing, which may be because most of the items in the tactile processing section relate to sensation seeking and sensory sensitivity, and the behavior manifestation of both sensation seeking and sensory sensitivity resembles being physically active. Although sex differences were not studied with the original ITSP, the findings of this current study suggest that separate norms for girls and boys on the 7–36 mo subscale for the sensation seeking quadrant and the tactile processing section are warranted when used with Taiwanese children.
Moreover, for children ages 7–36 mo, older boys demonstrated higher frequency of low registration, sensory sensitivity, and sensory avoiding behaviors, possibly because boys approaching age 3 yr are more likely to participate in vigorous physical activities than girls of the same age. Therefore, caregivers have more chances to observe these behaviors, resulting in a higher frequency of ratings. However, the underlying mechanism needs to be explored in future studies.
The discriminative validity of the ITSP–C for differentiating the sensory processing function of children with DD from that of TD children was supported by the results of logistic regression analysis with a high discriminative accuracy (see Table 3). Model 1 revealed that the ITSP–C auditory, visual, and vestibular processing sections were the strongest predictors for identification of DD. Model 2 indicated that the low registration and sensory avoiding quadrants were the best predictors of DD. In other words, children who scored in the probable difference range in the auditory, visual, and vestibular processing sections and in the low registration quadrant have increased odds of being identified with DD (odds ratios = 2.744–5.418). Likewise, children who scored in the typical performance range in the quadrant of sensory avoiding have decreased odds of being identified with DD.
Our results support previous studies of Ben-Sasson et al. (2007) that toddlers with autism scored lower on the low registration and sensory avoiding quadrants than did TD toddlers. The tactile and oral sensory processing sections and the sensation seeking and sensory sensitivity quadrants did not enter into the fitted final regression Models 1 and 2, respectively. The reason might be that their contribution was accounted for by the other five significant predictors. Yet, these variables might still be important for differentiating children with DD from TD children without the previously mentioned five predictors. An alternative explanation of this finding might be the heterogeneity of the sensory characteristics among children with DD, especially children with ASD (Baranek et al., 2006; Watson et al., 2011).
Limitations and Suggestions for Future Research
Some limitations are inherent in this study. First, most of the participants were recruited from convenience samples in the Greater Taipei area, which may not be representative of the demographics of the entire population of Taiwan. For example, a high percentage of parents in our study sample had bachelor’s degrees or higher (>50%), which may affect their perception of and response to their child’s behavior. In addition, because of the nature of the convenience sample, only children with developmental delays and autism participated in the DD group. Moreover, the severity and subcategories of both conditions were not considered. Therefore, the DD group might not represent the comprehensive sensory characteristics of children with DD, thereby reducing the sensitivity of some sections and quadrants of the ITSP–C in detecting group difference. It is suggested that children with different degrees of severity be recruited in future studies to investigate the capability of the ITSP–C to differentiate the performance of children with different conditions and degrees of severity.
Second, test–retest reliability and discriminative validity were based on a clinical sample whose ages were limited to 7–36 mo because children in this age range were most often referred to clinics in Taiwan. Thus, future research that recruits samples with better demographic and geographic representation is needed. In addition, future studies are warranted to examine test–retest reliability and discriminative validity of the ITSP–C in other Chinese-speaking countries and when used in infants ages 0–6 mo.
Implications for Occupational Therapy Practice
This study has the following implications for evaluating sensory processing function in Taiwanese infants and toddlers during occupational therapy practice:
It is recommended to use quadrant scores when making clinical decisions because these scores have a higher level of reliability than section scores.
Specific section and quadrant scores (i.e., scores from auditory, visual, and vestibular processing sections and low registration and sensory avoiding quadrants of the 7–36 mo subscale) are helpful in differentiating children with DD from TD children.
Conclusion
The ITSP was successfully adapted to Chinese. The ITSP–C demonstrated similar reliability and validity to the original ITSP, with high internal consistency and moderate to excellent test–retest reliability. The 7–36 mo subscale had a higher level of reliability than the 0–6 mo subscale, and quadrant scores were more reliable than section scores. In addition, the ITSP–C discriminated between children with DD and TD children on the basis of their sensory processing patterns.
Footnotes
Acknowledgments
We are grateful to all the participating children, parents, and teachers. We also thank Fu-Chang Hu for statistical consultation and Ling-Chu Wu for her assistance with statistical computing. This study was supported through funding awarded to Mei-Hui Tseng from the Department of Health, Executive Yuan, Taiwan (DOH93-TD-M-113-038, DOH94-TD-M-113-007) and the National Science Council, Taiwan (NSC93-2815-C002-102-B).