





Abstract
Occupational therapy educators are invested in meeting rigorous educational standards to ensure that their students deliver high-quality care to future clients. To achieve this goal, occupational therapy students need to be able to demonstrate professional, academic, and ethical skills (Lysaght et al., 2009). Students must then pass the National Board for Certification in Occupational Therapy® (NBCOT®) exam to gain certification as a prerequisite for a license to practice (American Occupational Therapy Association [AOTA], 2018).
An occupational therapy program’s NBCOT exam pass rate is a critical quality indicator required by the Accreditation Council for Occupational Therapy Education® (ACOTE®). For example, ACOTE Standard A.6.4 states that 80% of a program’s graduates must successfully pass the NBCOT exam in a calendar year regardless of the number of attempts (ACOTE, 2018). Moreover, prospective students use NBCOT exam success rates to judge the quality and efficacy of the occupational therapy program they desire to attend. With a per-test cost of $515 (NBCOT, 2019), supporting successful passage of the NBCOT exam on the first attempt is prudent.
Because of accreditation requirements, occupational therapy educators are motivated or encouraged to identify factors that may lead to successful performance on the NBCOT exam. In addition, various researchers (Avi-Itzhak, 2015; Novalis et al., 2017) have examined predictors of success on the certification exam, including admission factors, in-program performance measures (e.g., program grade point average [GPA], fieldwork performance), and exam-specific preparation methods (i.e., practice certification exams). Identifying these factors will allow programs to determine useful and accurate admissions criteria, advise current students on how to obtain the best outcomes, and target interventions for students at risk of failure.
Designing admissions criteria for occupational therapy programs is inherently difficult because of the conflicting research on the validity and reliability of common admission requirements in predicting performance. Novalis et al. (2017) examined the relationships among passing the NBCOT exam, demographics, preadmission factors, and graduate academic performance. These researchers were able to predict 86.2% of student outcomes on the NBCOT exam using a logistic regression model that included gender, preadmission factors (letters of recommendation, writing samples), postadmission occupational therapy program factors (GPA, lack of master’s-level program difficulty), and fieldwork self-reports. Using a multivariate regression model that included student performance on Domains 1 and 2 of a practice certification exam, Avi-Itzhak (2015) found a modest prediction rate (80%) between performance on the practice test and failure on the first attempted certification exam. These studies provide the groundwork for the current study, which broadened the factors initially considered in the model to identify likelihood of success on the certification exam.
If baseline and in-program characteristics can be used to indicate probable success, additional resources and targeted interventions may be allocated to help students at the highest risk of failure. Identifying risk factors for clinical difficulties early on to help students succeed on their fieldwork rotations is also important (Tan et al., 2004). This information can be useful as master’s-level programs transition to entry-level clinical doctorate programs. Thus, in this study we explored the use of multivariate models to identify students’ likelihood of passing the NBCOT exam on the first attempt and to identify those at risk of failure. Outcomes would be used to provide targeted advising and other opportunities to improve future performance on the exam.
Method
Participants
The participants were 315 occupational therapy students for whom licensure exam information was available. Their demographic characteristics were consistent with trends for occupational therapy program admissions, including a higher percentage of women than men (n = 284; 90.2%) and students from metropolitan and suburban areas (n = 285; 90.48%). The program in which the study was conducted (at West Virginia University [WVU]) is a 3-yr (eight-semester) entry-level master of occupational therapy (MOT) program with acceptance during the junior year of undergraduate studies. Students with a bachelor’s degree in any field are not excluded from the application process but are given no preferential status (Table 1).
Characteristics of Students in the Occupational Therapy Program (N = 315), With Differences According to NBCOT Exam Passage
Note. — = data not collected or not applicable; ACT = American College Test; GPA = grade point average; Grad. = graduated; M = mean; NBCOT = National Board for Certification in Occupational Therapy; OTH 384 = Level I Fieldwork 1; OTH 386 = Level I Fieldwork 2; OTH 387 = Level I Fieldwork 3; OTH 540 = Level II Fieldwork 1; OTH 640 = Level II Fieldwork 2; OTKE = Occupational Therapy Knowledge Exam; RUCA = Rural–Urban Commuting Area; SD = standard deviation; WV = West Virginia.
Fisher’s Exact Test.
Students were included if they were a graduate of WVU’s MOT program. Students were excluded if they had not graduated from the program or if their NBCOT exam first-time pass–fail status was unknown.
Procedure
Approval from WVU’s institutional review board was obtained (Protocol 1409434537). Data were collected internally starting in 2006 from the occupational therapy program and solicited from the university registrar for graduation years 2009–2017. Each student’s MOT program data (e.g., specific course grades, fieldwork performance) were matched and merged with admissions data (e.g., American College Test/Scholastic Assessment Test [ACT/SAT] scores, prerequisite GPA) and then deidentified for analysis. After data analyses were completed, a “Success Score Calculator” was developed for use by faculty advisors to proactively track students.
Measures
Demographics
Demographics included gender, race, in-state student status, and geographic location (based on home zip code); this information was gained from admissions data. Rural–Urban Commuting Area (RUCA) coding was applied to the home zip code, and several explorations of the data included recoding the RUCA data to a four-category system: metropolitan, micropolitan, small town, and rural.
College Entrance Examinations
The U.S. college system uses two college entrance examinations: the ACT and the SAT. For all available entrance exam data, the ACT was preferred. If only SAT scores were available, they were converted to ACT scores using a conversion chart created by the College Board (2018).
Grade Point Average
GPA indicators were obtained and explored, including GPAs for prerequisite courses, final college GPA, and GPA for each semester of the student’s occupational therapy college career. Explorations of these data also included noting whether the MOT program GPA had ever dropped below a 3.0.
Program Benchmarks
Several courses were included because they are related to both clinical practice and the certification examination: OTH 307 (Neurobiologic Foundations), OTH 401 (Physical Impairment and Function II), OTH 408 (Physical Impairment and Function III), OTH 384 (Level I Fieldwork 1), OTH 386 (Level I Fieldwork 2), OTH 387 (Level I Fieldwork 3), OTH 540 (Level II Fieldwork 1), and OTH 640 (Level II Fieldwork 2). The AOTA Fieldwork Performance Evaluation was used to measure students’ clinical performance on Level II fieldwork, and the Philadelphia Region Fieldwork Consortium was used for all Level I fieldwork (AOTA, n.d.). Because of a program change in the grading scale in 2013, scores for OTH 384, 386, and 387 were standardized into z scores. Graduation-level indicators included year of graduation and whether the student graduated on time (i.e., graduated in 2.5 yr).
The Occupational Therapy Knowledge Exam (OTKE) is an instrument developed by NBCOT to help program administrators analyze student performance in preparation for the NBCOT exam (https://sites.nbcot.org/PDPortal/OTKE/OTKEHome). OTKE scores were also used as a benchmark in this study. The OTKE was administered three separate times during each student’s progression through the program: at the start of the occupational therapy program (fall semester, first year), before the first Level II fieldwork (spring semester, second year), and before the second Level II fieldwork (spring semester, third year). Data transformation was completed after the third OTKE attempt to determine each student’s ranking among the cohort. A dichotomous (yes–no) variable, “bottom quarter,” was used to categorize students who fell into the bottom quarter of their cohort once all the OTKE assessments were completed.
Licensure Examination
NBCOT data were obtained from the Passing Candidate Report of the NBCOT program director’s portal (https://sites.nbcot.org/pdportal). The primary outcome of interest was whether the student passed the exam on the first attempt.
Data Analysis
All analyses were conducted using SAS Version 9.4 (SAS Institute, Cary, NC). Missing data were treated with pairwise deletion; missing data multiple imputation was conducted for the logit estimates to ensure accurate weighting of the risk score indicators. Descriptive statistics, including valid percentages and frequencies for categorical variables and means and standard deviations for continuous variables, were reported. Differences between these descriptive statistics in relation to a passing score on the NBCOT exam were also calculated (α = .05) using t tests for continuous data and χ2 for categorical data.
The primary analysis followed recommendations by Sullivan et al. (2004) and included bivariate inclusion using φ correlations (for categorical data) and point-biserial correlations (for continuous data) with conservative p values (α = .20) for the predictor of interest and then building a weighting system based on logistic regression estimates. A final weighting scheme for the significant predictors included using a constant value of 1.84, based on the value of 4 (for the four levels of time in the program: preadmission year, Year 1, Year 2, and Year 3 data) times the logit estimate for GPA. The final weighting system of variables and scaled scores with corresponding probability estimates are presented. All logistic regression assumptions were tested before they were run; one regression outlier was deleted.
Results
Descriptive Characteristics
Most students (n = 268; 85.1%) passed the NBCOT exam on the first attempt. Key differences for those who passed were seen among many of the admission and program characteristics, including overall college GPA (p = .0017), ACT or SAT scores (p = .0001), all OTKE scores (p < .0001), and the first Level II fieldwork scores (OTH 540; p = .04).
Risk Score Development
Although NBCOT pass rate had a slight correlation with gender and bottom quarter during the initial analyses, neither variable contributed in terms of weighted score values for predicting NBCOT pass rates. On the basis of these values, a range of 0–33 was obtained for the risk score. These values were broken down as follows: 4 points for the highest category of ACT score–SAT conversion; 1 point for first-year occupational therapy school GPA >2.6; 3 points for second-year occupational therapy school GPA >3.8; 3 points for an OTH 540 score >133; and up to 5, 7, and 10 points, respectively, for the three administrations of the OTKE. Table 2 includes the final scoring for each variable, with a valid percentage for each category for both the whole sample and for students who passed or failed the exam.
Final Point System for Variables, Ranges, and Valid Percentages, by Total Sample (N = 315) and by Students Who Passed (n = 268) or Failed (n = 47) the Licensure Exam
Note. ACT = American College Test; GPA = grade point average; OTH 540 = Level II Fieldwork 1; OTKE = Occupational Therapy Knowledge Exam.
For students with complete information on all scoring variables, 20 failed the exam, and 107 passed it. The model fit well (Wald χ2 = 20.37, p < .0001; pseudo-R 2 = .33, Hosmer–Lemeshow goodness of fit = 1.67, p = .89). For each unit increase in the score, the odds of passing the exam was 4.11 (95% confidence interval [CI] [2.23, 7.60]).
Most students scored between 14 and 24 on the Success Score Calculator (Table 3). A cutoff of 18 was determined for a 71.7% correct prediction of success on the NBCOT exam, with maximized sensitivity (85.0%; true positives = 91 of 107) and specificity (85.0%; true negatives = 17 of 20). A score of 18 resulted in 3.2% false positives (n = 3) and 48.5% false negatives (n = 16). The odds of passing the exam given a score ≥18 was 32.22 (95% CI [8.46, 122.73]) relative to having a score >18.
Scoring System With Predicted Probabilities, Number, and Percentage of Students who Passed or Failed With That Score (N = 128)
Note. Percentages may not total 100 because of rounding.
The point at which sensitivity and specificity are maximized.
Example Case Studies
To make this scoring system applicable and more understandable, we highlight data from three students with different success rates on the NBCOT exam and curricular benchmarks.
Case Study 1: Borderline Student
This student did not earn at least a 3.0 for the Summer Year 1 GPA, which included courses in anatomy and professional foundations (Figure 1A). She was required to complete an independent study as remediation for these courses the following summer to cement learning and retain a seat in the program. She then performed exceptionally well in her first Level II fieldwork (OTH 540). At the conclusion of the program, she took an optional NBCOT exam review course offered by a faculty member. This 2-day course covered test-taking strategy and test structure along with a brief content review. She successfully passed the NBCOT exam on the first attempt. We believe the retaking of her summer coursework, along with optional supplemental learning opportunities, contributed to this student’s successful progression to clinician.
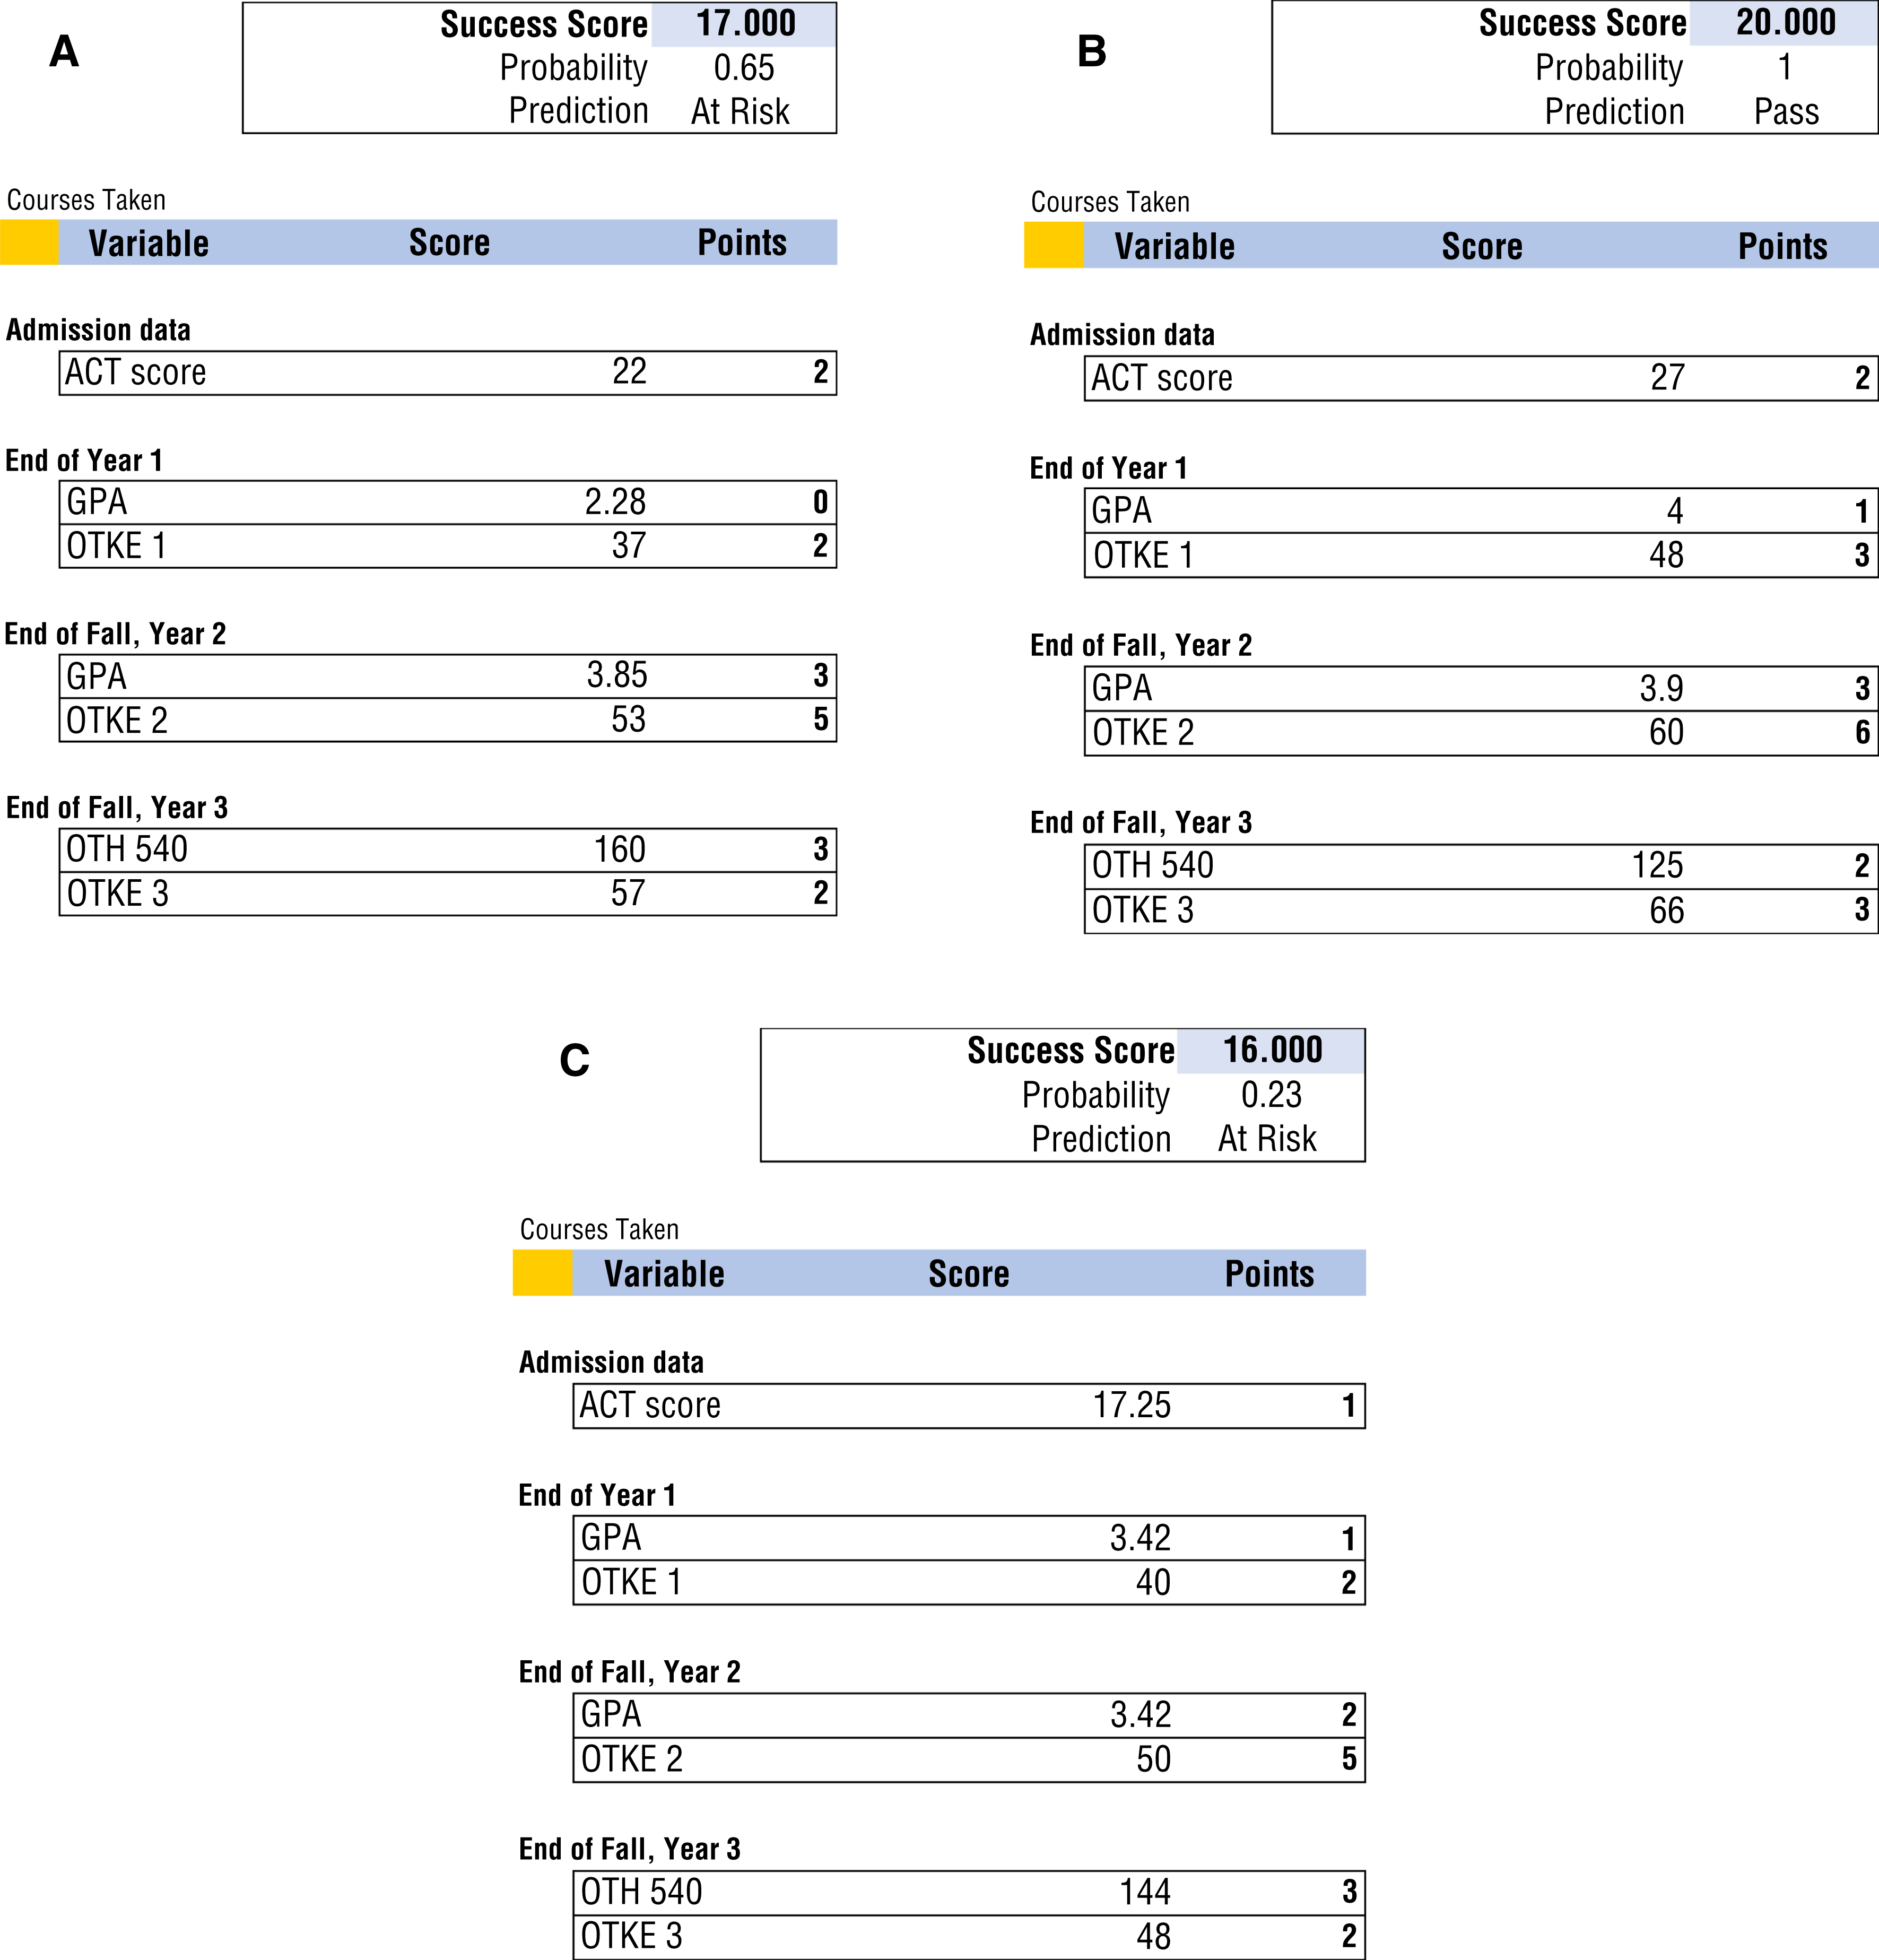
Success Score Calculator (A) for a student who earned a borderline score of 17 and was considered at risk but passed the NBCOT exam, (B) for a student who earned a score of 20 and was predicted to pass the NBCOT exam, and (C) for a student who earned a score of 16 and was identified as at risk (and failed the NBCOT exam on the first attempt).
Case Study 2: NBCOT Exam First-Attempt Pass
This student demonstrated excellent test-taking abilities, as evidenced by her ACT and OTKE scores (Figure 1B ). Her first Level II fieldwork score (OTH 540) was relatively low compared with the cohort but, combined with her GPA, ACT, and OTKE scores, gained her an impressive 20 points, for a 100% probability of success on the NBCOT exam. This was found to be accurate, because she passed the exam on the first attempt.
Case Study 3: NBCOT Exam Failure
This student had the lowest ACT score in the cohort and consistently low OTKE scores over three attempts (Figure 1C). Despite attending an NBCOT review session, she was not successful at passing the exam on the first attempt.
Discussion
The results of this study support the development of a predictive tool to support academic and practice outcomes of occupational therapy students, regardless of program processes of admission. Variables included on the Success Score Calculator can be used to accurately, with good sensitivity and specificity, classify those students who passed the licensure examination. However, data may not be generalizable beyond the study population. This information includes only students with licensure examination data and thus does not include those who dropped out of the MOT program or did not take the NBCOT. Further analysis should be done to validate the scoring system with other demographics including entry-level doctoral students and Graduate Record Examination scores.
This predictive score will allow occupational therapy faculty to provide more useful and accurate advisement to their students. This advisement can be related to areas in need of improvement as determined by the student’s Success Score Calculator results. For example, if a student has lower marks on tasks that involve standardized testing, the academic advisor can recommend referrals to address test-taking strategies or test anxiety. The advisor can also recommend that the student engage in a formal comprehensive review before taking the exam. Conversely, if a student earns lower scores for fieldwork rotations, advisors can support the student to complete clinical simulation tasks to enhance clinical and critical reasoning skills. Having a predictive score gives validity to these recommendations.
Implications for Occupational Therapy Education
This study has the following implications for occupational therapy education:
Academic course grades, fieldwork performance, and standardized test scores affect performance on the NBCOT licensure exam.
Using a predictive measure for student success can support advisement with recommendations for test-taking strategies and can address professional behaviors and clinical reasoning skills that affect fieldwork performance and strategies for course success (i.e., organization, instructor communication, notetaking, question asking, study methods).
Conclusion
Case studies using this success score suggest that additional resources and targeted interventions could be allocated to help students at highest risk of not passing the licensure exam. Factors that influenced the risk score were course grades, fieldwork performance, and standardized tests. In addition to these factors, academic advisors need to consider contributing factors such as clinical and critical reasoning, professional behaviors, test-taking strategies, organization, notetaking, communication with the instructor or preceptor, question asking, and study methods.
Footnotes
Acknowledgments
The research reported in this article was supported in part by the National Institute of General Medical Sciences of the National Institutes of Health under Award 2U54GM104942-02. The content is solely the responsibility of the authors and does not necessarily represent the official views of the National Institutes of Health.