





Abstract
Sleep patterns evolve rapidly over the early years of life. At birth, sleep occurs in several intervals distributed across the day and night (Davis et al., 2004), transitioning over several weeks and months to increasingly more sleep overnight and less sleep during the day (Henderson et al., 2010). By age 3 yr, daytime naps still occur, and sleep problems—mainly related to taking a long time to settle to sleep (long sleep latency) and frequent night wakings—remain a common concern for parents (20%–30% report such difficulties; Mindell & Owens, 2015). Asking a parent whether their child’s sleep is “usually” a problem is a question widely posed in research and clinical practice (Williamson et al., 2019), and severity ratings are strongly associated with increased night awakenings, prolonged sleep latency, and shortened nighttime sleep (Byars et al., 2012; Sadeh et al., 2011).
In early life, short sleep duration can translate to adverse neurobehavioral outcomes in later childhood (Touchette et al., 2009). Numerous cross-sectional studies have reported relationships between short sleep duration or excessive night waking and emotional and behavioral problems in infants, toddlers, and young children (Bruni et al., 2000; Lavigne et al., 1999; Reid et al., 2009).
Although many studies have examined relationships between sleep development and neurobehavioral, social, and emotional development, few have considered sensory processing development. Sensory processing is defined as the ability to integrate information received from the body’s basic sensory systems (visual, auditory, tactile, taste, smell, proprioception, and vestibular) and to form appropriate behavioral responses (Aron et al., 2012). Difficulties with sensory processing can negatively affect a wide variety of basic areas of functioning, resulting in problems with everyday activities such as self-care, play, social participation, and schooling (Koenig & Rudney, 2010; Zakorchemny & Lashno, 2019).
Sensory processing difficulties are predominantly linked to neurodevelopmental disorders such as autism spectrum disorder (ASD; Cheung & Siu, 2009) and attention deficit hyperactivity disorder (Shimizu et al., 2014). Children with these conditions have been shown to present with sleep difficulties (Malow et al., 2006; van der Heijden et al., 2006). At this point, limited research exists addressing whether the link with sleep is fundamental to, or a manifestation of, neurodevelopmental disorder, although a study has suggested that sleep problems in ASD are not bidirectionally associated but rather co-occur with autistic traits in early childhood (Verhoeff et al., 2018).
Sleep problems can reflect difficulties with sensory processing for many reasons, mostly described in the literature in relation to clinically diagnosed conditions, such as ASD (Deliens & Peigneux, 2019). Bedtime settling involves many shifts in the environment (e.g., noise and ambient light) that can become difficult for the more sensitive child to tolerate. Consequently, maladaptive coping strategies may be adopted, resulting in hyperarousal, affecting the ability to fall asleep and stay asleep. Social cues for sleep may be misread, blurring the structure of time and leading to irregular sleeping patterns (Deliens & Peigneux, 2019). Biological mechanisms are also implicated with respect to underlying deficits in melatonin secretion (Shomrat & Nesher, 2019), alterations in the hypothalamic pituitary axis function and cortisol secretion, and genetic variations in clock genes that play a crucial role in sleep–wake regulation (Nicholas et al., 2007).
Typically developing children who express traits of increased sensory sensitivity appear to suffer more sleep difficulties than those whose sensory sensitivities are within the typical range (Shochat et al., 2009). However, as far as we are aware, only two cross-sectional studies of children without existing sleep problems (i.e., nonclinical samples) have investigated this area, but none in infants and toddlers. In the first study, Shochat et al. (2009) investigated 56 children age 8 yr and found sleep ratings to be negatively associated with ratings of auditory filtering, tactile sensitivity, and movement sensitivity. In the second study, Foitzik and Brown (2018) investigated 45 children ages 8–12 yr and found that sleep pattern disturbance correlated with higher sensitivities. Together, these studies suggest a potential link between sleep and sensory processing in the absence of neurodevelopmental disorders, which is worthy of further investigation. However, longitudinal studies are necessary to understand any potential bidirectional relationship between sleep problems and sensory processing difficulties, given that both can be targets for early intervention to capture trajectories in typical populations.
The purpose of this study was to explore the cross-sectional and longitudinal relationships of sleep patterns to sensory processing outcomes in a cohort of typically developing toddlers age 2.5 yr (30 mo). We hypothesized that shorter sleep duration and indices of inferior sleep quality in infancy would be associated with poorer ratings (scale scores) of sensory processing at age 2.5 yr and that these relationships would also be demonstrated cross-sectionally. We also explored sensory processing within interpretative ranges (typical, some problems, definitive dysfunction range) more commonly used in clinical practice. Indices of inferior sleep quality included parental report of increased night wakings, longer time taken to settle to sleep, and the more general report of a sleep problem.
Method
Participants
The study is a substudy of a four-armed randomized controlled trial (RCT) of 802 families recruited antenatally (59% response rate) that examined whether additional education and support on sleep or on breastfeeding, diet, and physical activity, or a combination of both, affected weight gain from birth to age 5 yr, compared with usual care (Taylor et al., 2017, 2018). The participants in this substudy (n = 160) were a random sample of 40 infants from each of the four arms of the RCT, with 157 parents completing the measure of sensory processing at age 2.5 yr only. No children were excluded on the basis of any developmental issues arising between ages 6 mo and 2.5 yr. Routine data were collected from these infants and families as part of the RCT at ages 6 mo, 1 yr, and 2 yr, with an additional data collection time point at age 2.5 yr for participants in this substudy. Main eligibility criteria for the RCT included the mother being at least age 16 yr and booked into the single maternity hospital serving the Dunedin, New Zealand, community (represents 97% of all births) before 34-wk gestation.
Demographic data were collected at recruitment, which took place during the third trimester to target early prevention of obesity through antenatal education (main RCT), and again at age 2.5 yr. Infant birth characteristics were collected from hospital records. Ethnicity was prioritized according to national recording standards in order of Māori, Pacific, Asian, other and, finally, European. The New Zealand Deprivation Index (NZDep2006; Salmond et al., 2007) was used as an index of neighborhood deprivation on the basis of the participant’s address at recruitment. The NZDep2006 combines census data relating to income, employment, education, and access to transportation to provide a deprivation score for each meshblock in New Zealand. Meshblocks are the smallest geographical areas defined by Statistics New Zealand and contain a median of 87 people. The index groups score between 1 (meshblock is one of the 10% least deprived) and 10 (meshblock is one of the 10% most deprived).
Sleep Measures at Ages 6 Months to 2.5 Years
The parent(s) of each participant completed a questionnaire covering the child’s overnight sleep patterns at ages 6 mo, 1 yr, 2 yr, and 2.5 yr. Specific for this study were four questions to ascertain (1) overnight sleep duration (“What time does your child normally fall asleep at night?” and “What time does your child normally wake up in the morning?”), (2) the number of night wakings (“How many times per night does your child usually wake?”), (3) the time taken to settle to sleep (“Over the past 2 wk, how long has it taken your infant/baby to settle to sleep in bed?”; responses in 5- to 15-min increments), and (4) whether mothers perceived their infants’ and toddlers’ sleep as being a problem for them (“How much of a problem is baby’s sleep?”; responses ranged from 1 [no problem] to 8 [large problem]). This last question was not asked at age 1 yr but instead at age 1.5 yr. The questionnaire was administered at each time point during a home visit by a researcher.
Sensory Processing at Age 2.5 Years
During home visits at age 2.5 yr, parents completed the Sensory Processing Measure–Preschool (SPM–P) home form (Kuhaneck et al., 2010). The SPM–P is a 75-item rating scale designed to assess sensory processing difficulties in children between ages 2 and 5 yr as well as specific posited functional correlates. The SPM–P measures sensory processing in five sensory systems—vision, hearing, touch, body awareness, and balance and motion—as well as higher level functional domains, including praxis (planning and ideas) and social participation (Kuhaneck et al., 2010). A total sensory systems score is a composite score of the items from the five sensory systems. Parents report typical behavior during the past month along a 4-point ordinal rating scale ranging from 1 (never) to 4 (always).
SPM–P indices are T scores, with a mean of 50 and a standard deviation of 10. Ts between 40 and 59 are interpreted as “typical functioning,” those between 60 and 69 are interpreted as “some problems,” and those between 70 and 80 are interpreted as “definite dysfunction” (Kuhaneck et al., 2010). The SPM–P norm-referenced indexes are standardized against typically developing children in the ages 2- to 5-yr age range, with internal consistencies ranging from 0.75 to 0.93 and test–retest reliability estimates ranging from 0.90 to 0.94 (Kuhaneck et al., 2010).
Data Analyses
The sample size was based on detecting a 0.25 standard deviation regression coefficient for sensory measures per unit of sleep measure with 80% power to the α = .05 level. For this level, 128 participants would be required. To allow for 20% incomplete data or dropout, we recruited 160 participants. Using linear regression, we assessed associations between cross-sectional sleep data and sensory variables at age 2.5 yr and the longitudinal relationships between sleep at age 6 mo and sensory variables at age 2.5 yr. Adjustments for randomized group, the sex and ethnicity of the infant, maternal education, and whether the child was the first born to the mother were also undertaken. Sensory variables were log transformed if they exhibited right skew and improved the fit of the model. Effect sizes, 95% confidence intervals, and p values were calculated. For log-transformed variables, these values were back transformed and presented as percentage differences.
We classified those “not at risk” for sensory dysfunction using interpretive ranges for typical functioning for each of the scales examined (T = 40–59). Those “at risk” for sensory dysfunction were classified by T > 60, that is, interpretive ranges of some problems (60–69) and definite dysfunction (70–80). For each infant, a mean sleep duration was calculated from all time points. The mean sleep duration and standard deviation from that mean was then calculated for participants in the groups “not at risk” and “at risk” for sensory dysfunction. For each sensory variable, mixed-model regression with robust standard errors was used to determine whether mean sleep duration from ages 6 mo to 2.5. yr (repeated measures) was different for those at risk for dysfunction and for those not at risk, with participant identification as a random effect. Adjusted results are presented. The same method was used to determine the difference in night wakings, time to settle to sleep, and sleep problems between those at risk and those not at risk for sensory dysfunction.
Results
Participant Characteristics
Demographic information is given in Table 1 for maternal, infant, and household characteristics. Most infants were classified as European (80%), and male and female proportions were the same. Of the mothers, 67% had a tertiary degree or higher and a mean age of 32.9 yr (SD = 4.7) at the time of giving birth. In addition, 41% were primiparous, and 42% lived in neighborhoods within the mid-decile range for deprivation (4–7).
Infant and Maternal Characteristics (N = 157)
Note. BMI = body mass index; MELAA = Middle Eastern, Latin American, or Africa.
Measured with the New Zealand Deprivation Index, which provides an index of socioeconomic deprivation based on a composite of census data for the area in which the participant lives. Scores range from 1 (least deprived decile) to 10 (most deprived decile). bSecondary schooling in New Zealand is from Year 9 to Year 13 inclusive. Postsecondary qualifications refer to all tertiary qualifications that are not university based.
Descriptive Data
Mean sleep duration (with SDs in parentheses) in children was 11.0 hr (1.2) at age 6 mo (range = 7.8–15.5 hr), 11.2 (0.7) at 1 yr, 11.1 (0.8) at 2 yr, and 11.2 (0.8) at 2.5 yr (range = 9.5–14.5 hr). The median number of night wakings (with interquartile range [IQR] and range in parentheses) was 1 per night (1, 1; range = 1–4) for children age 6 mo, 1 per night (1, 1; range = 1–3) for children age 1 yr, 1 per night (1, 1; range = 1–4) for children age 2 yr, and 1 per night (0, 1; range = 0–4) for children age 2.5 yr. The time taken to settle (with SDs in parentheses) was 14 min (10) at age 6 mo, 10 (9) at 1 yr, 17 (11) at 2 yr, and 21 (15) at 2.5 yr. Sleep problem scores (with SDs in parentheses) ranging from 0 (no problem) to 8 (large problem) were 3.0 (1.8) at age 6 mo, 2.4 (1.7) at 1 yr, 2.1 (1.4) at 2 yr, and 2.4 (1.9) at age 2.5 yr.
Table 2 reports descriptive statistics for the sensory and functional performance variables at age 2.5 yr. The majority of the sample (71%–83%) were within the typical range for sensory processing variables as scored from the SPM–P subscales and composite score. Some problems were indicated among 13% to 29% of the sample, with the majority related to Body Awareness (20%), Vision (26%), and Touch (25%). Definite dysfunction was indicated in a minority of the sample, ranging from 0% for Body Awareness and 5% for Hearing, with only 1% (2 children) with definite dysfunction for Total Sensory Systems. For functional performance, 90% and 81% of the sample were in the typical range for Social Participation and Planning and Ideas (praxis), respectively, on the basis of SPM–P subscale scores, with only 1 child scoring in the definite dysfunction range for Social Participation derived from the SPM–P.
Descriptive Statistics for Sensory Processing Variables at Age 2.5 Yr
Note. Sensory Processing Measure–Preschool (SPM–P) indices are T scores, with a mean of 50 and a standard deviation of 10. Higher scores represent a higher level of possible dysfunction. Categorization is based on T scores from the SPM–P, in which <60 indicates “typical”; between 60 and 69 indicates “some problems,” and >70 indicates “definite dysfunction.”
Cross-Sectional Relationships Between Sleep and Sensory Processing at Age 2.5 Years
Associations between sleep variables at age 2.5 yr and SPM–P variables are shown in Figure 1 (Panel A). In fully adjusted models, no significant associations were found between sleep duration or night waking and sensory system variables, although shorter sleep duration had a tendency (p = .060) to be linked to the higher order variable of social participation (indicative of poorer functioning on the SPM–P). Each extra 10 min of time taken to settle to sleep was associated with small but significantly higher T scores for Vision (p = .036) and Touch (p = .028), suggesting more pronounced sensitivity in these systems. A 1-point higher sleep problem score was associated with significantly higher T scores for Social Participation (p < .001).
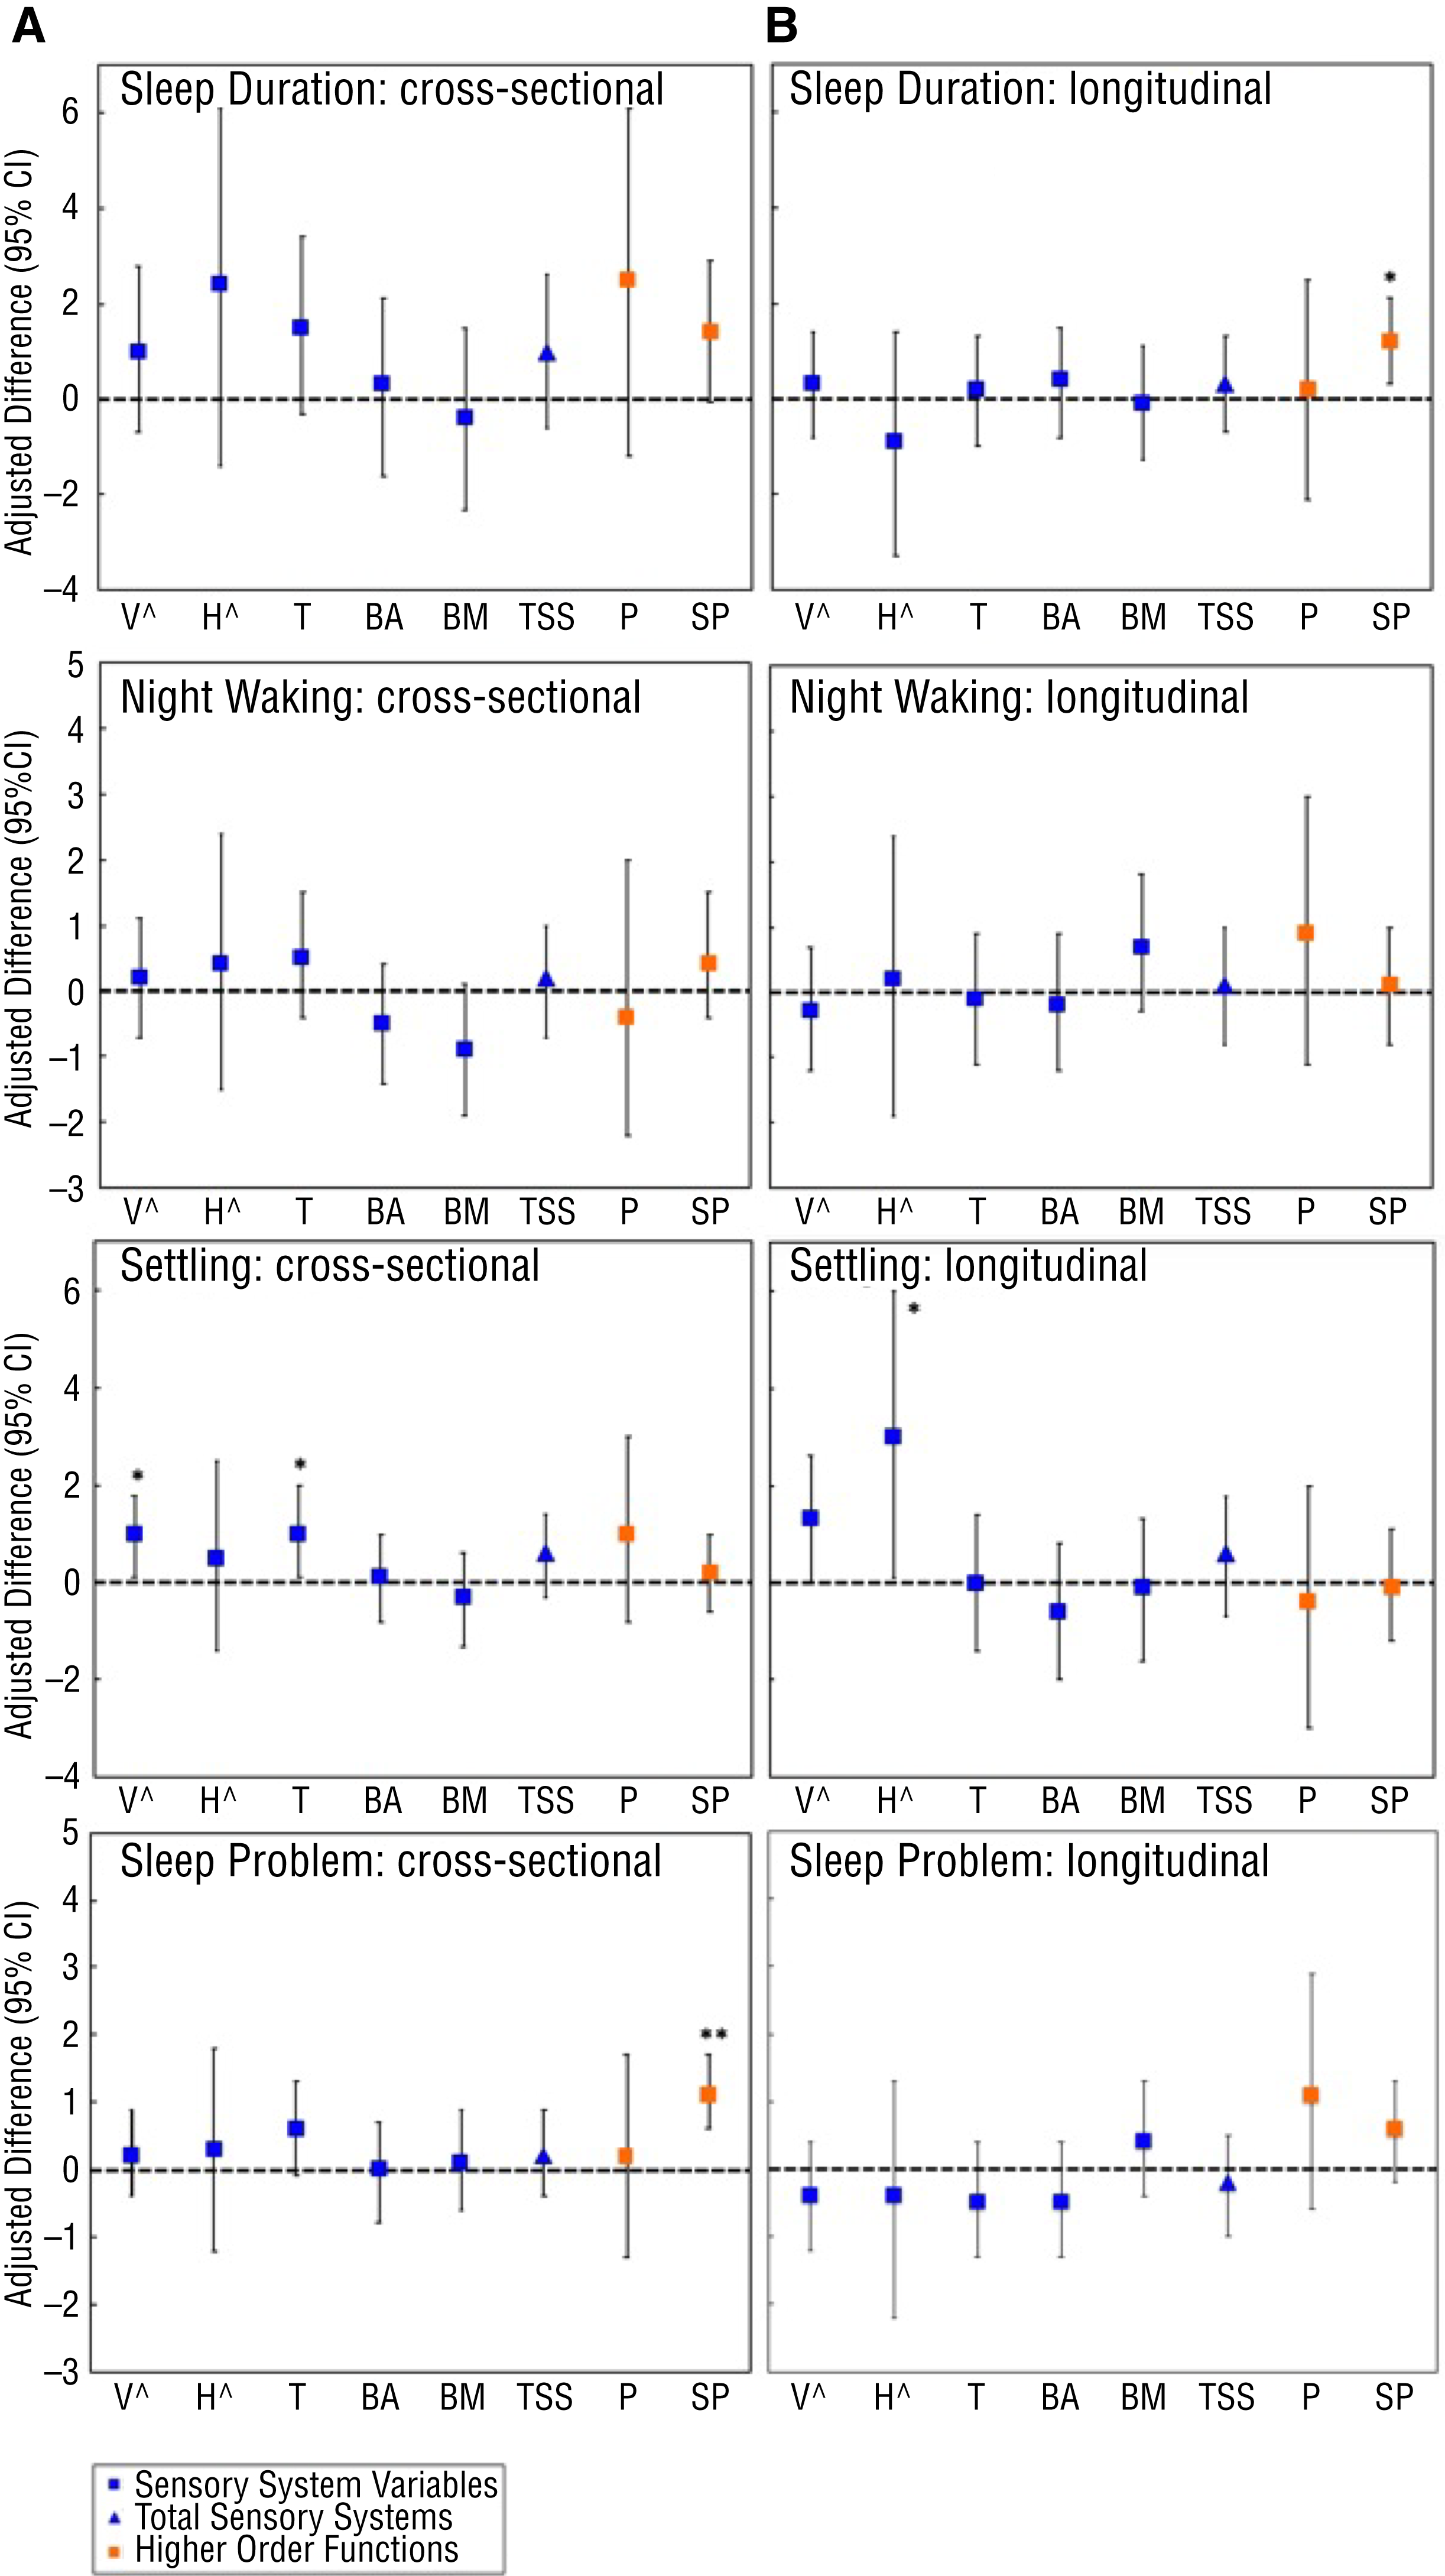
Sleep variables associated with Sensory Processing Measure–Preschool T scores, (A) Cross-sectional data (2.5 yr), and (B) Longitudinal data (6 mo to 2.5 yr).
Longitudinal Relationships
Sleep at Age 6 Months Predicting Sensory Processing at Age 2.5 Years: Continuous Sensory Processing Measure–Preschool Scores
For the longitudinal association, shorter sleep duration was significantly associated (p = .013) with poorer scores for Social Participation derived from the SPM–P, that is, 1 hr of shorter sleep duration at age 6 mo predicted a lower T score by 1.2 (see Figure 1, Panel B). For time taken to settle to sleep, a significant relationship with Hearing was found within the fully adjusted model (p = .042) that was attenuated after adjustment for concurrent time (p = .057), and the association with Vision almost reached significance (p = .053). Sleep problems were not linked to any SPM–P variable in fully adjusted models, and consistent with the 2.5 yr cross-sectional data was the lack of any association between night waking at age 6 mo and SPM–P sensory variable T score differences at age 2.5 yr.
Sleep From Infancy Predicting Children at Risk for Sensory Difficulties at Age 2.5 Years: Interpretative Ranges for the Sensory Processing Measure–Preschool
Table 3 stratifies average sleep duration data (averaged over ages 6 mo, 1 yr, 2 yr, and 2.5 yr) for each of the SPM–P measures in which participants are categorized as not at risk (i.e., typical) or at risk (i.e., indicative of having some problems or definite dysfunction) on the basis of SPM–P scores. The adjusted data show a significant relationship between shorter sleep duration and Planning and Ideas, such that children in the at-risk category achieved on average 23 min less sleep per night from age 6 mo to 2.5 yr than those in the typical range. Those in the at-risk categories for Vision and Total Sensory Systems took slightly longer times to settle (4 min). A small but significantly higher sleep problem score in toddlers at risk for social participation difficulties (p = .039).
Sleep Variables and Mean Differences, Ages 6 Mo to 2.5 Yr, for Children Not at Risk and at Risk for Sensory Problems at Age 2.5 Yr (N = 151)
Note. Values in bold indicate significant findings. At risk = those defined with “some problems” or “definite dysfunction”; CI = confidence interval.
Adjusted for randomized group, sex, maternal education, infant ethnicity, and parity. bSleep problem scores are based on a scale ranging from 1 (no problem) to 8 (large problem).
Discussion
A key finding of the cross-sectional study design was that parent-rated sleep problems were positively associated with more social participation difficulties in toddlers at age 2.5 yr. This finding was supported by the longitudinal data analyses, suggesting that sleep problems from infancy may lead to higher risk for social participation difficulties (using interpretative ranges). When scale scores were used, shorter sleep duration from infancy was also positively associated with more social participation difficulties in toddlers. Items on the SPM–P Social Participation subscale measure the toddler’s general interactions with friends, parents, and other important adults in their lives and cooperation during outings. Social participation represents one of the two higher level areas of functioning probed within the SPM–P, the other being praxis (planning and ideas; Kuhaneck et al., 2010). However, note that the Social Participation subscale of the SPM–P home form used here is based on only eight items, and it does not examine social participation in more formal settings with rules and routines or underlying factors (e.g., how parental involvement may influence outcomes).
In further longitudinal data analyses, we examined sensory processing difficulties using interpretative ranges and found that children in the at-risk category for poorer functional performance on praxis (some problems or definite dysfunction) obtained, on average, 23 min less sleep per night (approximately 0.5 SD difference) from infancy to toddlerhood. A child who scores less favorably on the Planning and Ideas subscale will be more likely to have trouble with motor planning and imitating demonstrations. In addition, those in the at-risk category took significantly longer to settle to sleep, although differences were small (4 min) and unlikely to be clinically meaningful. However, these findings could have implications for children with higher sensitivities than those participating in this study.
A further key finding within the cross-sectional data was that children taking a longer time to settle to sleep at age 2.5 yr had higher sensitivities (poorer outcomes) on the SPM–P Vision and Touch subscales. The longitudinal data strengthened these findings in that longer settling times from infancy to age 2.5 yr led to toddlers being at risk for dysfunction in total sensory systems (interpretative ranges), but here it was driven mainly by Hearing subscale scores. Although differences were small in terms of the number of minutes taken to settle to sleep, the findings do align with others reporting on clinical populations of infants and toddlers with sleep issues in which those with increased sensitivities also took a longer time to settle to sleep (Vasak et al., 2015). However, Vasak et al.’s (2015) study did not differentiate by sensory systems. Other studies in both healthy adults (Engel-Yeger & Shochat, 2012) and children (Shochat et al., 2009) have linked patterns of sensory sensitivity with restless behavior and difficulty falling asleep, including sleep pattern disturbance in children (Foitzik & Brown, 2018). Taken together, these data suggest that strategies targeting environmental factors specifically around bedtime (e.g., tactile stimulation, noise and light levels) may help address some of the settling issues for those children presenting outside of the typical range for sensory processing.
The findings linking indices of poorer sleep and higher order functions implicated in sensory processing (i.e., SPM–P measures of Social Participation and Planning and Ideas) are not surprising when considered within the context of the known relationship between sleep and higher order cognitive control. Of all the structures in the brain, the prefrontal cortex (PFC) appears to be the most sensitive to sleep deprivation (Bernier et al., 2010). Regulation of emotional responses as well as goal-directed and social behavior requires integration at the level of the PFC executive control, and a reduction in PFC control could potentially affect the integration of the numerous systems required to execute complex behaviors, for example, execution of a novel motor task (Kuhaneck et al., 2010). Areas of social functioning more commonly investigated in relation to sleep involve behavioral–emotional functioning (e.g., externalizing and internalizing difficulties) in toddlers or preschool-age children (Hysing et al., 2016; Vaughn et al., 2015). Moreover, sleep influences the social–emotional domain of development (Williams et al., 2017). For example, later bedtimes, longer sleep onset, and reduced total sleep time in infancy have been linked to reduced social competence in toddlerhood (Mindell et al., 2017). These findings are important given that social interactions early in life contribute to a child’s academic success (Sabol & Pianta, 2012) and physical and psychological development later in life (Moffitt et al., 2011).
The reason we found an association between settling time and vision and touch, but not other sensory systems, is unknown. It could be argued that a longer time to settle reflects a toddler with more difficulty modulating responses to visual or tactile stimuli. Shochat et al. (2009) found that tactile sensitivity in typically developing school children was a significant predictor of sleep difficulties, suggesting that some difficulties may be related to sensory modulation, particularly when children tend to be easily overaroused by sensory stimuli at bedtime. In support of this finding, electroencephalogram studies that have used evoked-response potentials in adults have shown that poor sleepers, compared with good sleepers, have more difficulties with sensory gating (the neurological process of filtering out or disengaging from the sensory environment) in the presleep wakefulness period but not during sleep itself (Milner et al., 2009).
Of the children in this study, 24% scored within the total sensory systems range for having some problems or definite dysfunction, and 11% and 18%, respectively, within these same categories for Social Participation and Planning and Ideas subscales according to parent report. Although we are not aware of any studies that present SPM–P data in nonclinical children comparable with the age group in this study, one study of 38 older children (ages 5–8 yr) reported differing percentages within the some problem and definite dysfunction ranges (15.8%, 18.4%, and 15.8% for total sensory systems, social participation, and praxis, respectively), suggesting possible differences in reported prevalence across developmental periods (Fernández-Andrés et al., 2015).
Although the children in this study were not recruited on the basis of sleep issues, sensitivities may be more pronounced in children with these problems. For example, within a retrospective chart review of 177 toddlers with specific sleep issues, increased sensitivity was the most common sensory pattern, and those with scores within the range of more than typical for this category (36.2%) took longer to settle to sleep (Vasak et al., 2015). Moreover, infants and toddlers referred to a sleep clinic because of behavioral insomnia were found to have considerably more sensory difficulties in the categories of high sensitivity and avoiding sensation than did children in a control group. (Tauman et al., 2017).
Strengths, Limitations, and Future Research
The strengths of this study include a larger sample size than that of previous studies, longitudinal sleep data, and the use of a sensory processing measure that provides age-appropriate standardized scores (Kuhaneck et al., 2010). In addition, the use of multiple regression modeling made it possible to measure the separate and combined unique effects of the cross-sectional and longitudinal relations of sleep variables on sensory processing above and beyond relevant demographic and health covariates.
Study limitations include the use of parental report to assess sleep patterns and sensory processing as well as the inclusion of sleep limited to nighttime data. Night wakings can be underestimated by parent report compared with objective measures, whereas sleep duration can be overestimated (Galland et al., 2016; Tikotzky & Shaashua, 2012). The independent role of naps on health and development is unclear (Thorpe et al., 2015), but naps certainly have a role in fulfilling overall sleep need in these age groups. Our prior data suggest that nighttime sleep reported by parents would capture approximately 81%, 85%, and 93% of the 24-hr sleep of infants and toddlers at ages 6 mo, 1 yr, and 2 yr, respectively (Galland et al., 2016). A further limitation is that we cannot be certain all the children in the study were developing typically because it is possible that some of the definite dysfunction group or even the some problems group could have had a neurodevelopmental disorder undiagnosed at this young age, interacting with, or contributing to, sleep issues. Finally, our findings must be viewed in context of the study population: a community sample of healthy children of predominantly European ethnicity with a relatively good sociodemographic profile.
In future studies, researchers should assess sleep objectively—via actigraphy (wrist-worn activity monitor used to estimate sleep–wake patterns over an extended period) or videosomnography (video-based methods used to record and subsequently score sleep behavior)—and subjectively; they should also examine the relationships between sleep and sensory processing using repeated measures of both, over time. Finally, researchers should also investigate in more depth the specific senses linked to sleep issues in infants and toddlers with sensory processing difficulties to provide more guidance toward targets for helping these children sleep.
Implications for Occupational Therapy Practice
Until recently, sensory processing difficulties in the context of sleep issues have been mainly associated with neurodevelopmental and neuropsychiatric conditions in clinical practice. The findings of this study highlight associations in typically developing children and have the following implications for occupational therapy practice:
The importance of healthy sleep patterns in early life for healthy child development across all neurobehavioral and sensory domains cannot be underestimated.
Practitioners should review bedtime challenges in toddlers in context with sensory processing issues.
Potential targets to assist the more sensitive child to settle to sleep are paying more attention to visual, tactile, and auditory stimuli that could keep the toddler from settling to sleep.
Practitioners should seek to work in tandem with child sleep specialists to capitalize on the unique expertise of both specialties in dealing with sensory processing issues and sleep problems in infants and children (Zakorchemny & Lashno, 2019).
Conclusion
This study builds on emerging literature addressing the relationship between sleep and sensory processing in typically developing children. The results support a link between sleep problems and poorer functional performance after infants reach the toddler age group; some support was also found for sleep patterns and behaviors in infancy predicting basic sensory system outcomes in toddlerhood.
Footnotes
Acknowledgments
The authors thank the families who participated in this study and the wider Prevention of Overweight in Infancy study team responsible for data collection. This study was funded by grants from the Health Research Council of New Zealand (08/374) and New Zealand Lottery Health Research (AP313684). Katie Appleyard was supported by a Dunedin School of Medicine Dunbar Scholarship and a Freemasons of New Zealand Fellowship in Paediatrics and Child Health. The New Zealand Lower South Regional ethics committee approved the study (approval numbers LRS-08-12-063 and LRS-11-07-027).