





Abstract
Sensory processing refers to the reception, modulation, integration, and organization of sensory stimuli and the resulting behavioral response (Miller & Lane, 2000). Occupational therapists are interested in sensory processing as a client factor that affects individual occupational participation and performance (American Occupational Therapy Association [AOTA], 2014). People experience sensory processing challenges when their reactions do not match seemingly common stimuli. For example, Bailliard (2015) described sensory dissonance as a phenomenon that occurs when one’s expectations for sensation are not congruent with the sensation one is experiencing. Some people may overreact to sensory stimuli; others may underreact; and still others may vacillate between the two, demonstrating problems in modulation (Miller & Lane, 2000).
People with a psychiatric condition often experience sensations differently. A scoping review of sensory processing and mental illness indicated that most of the research conducted to date has used a neuropsychological approach and has focused on schizophrenia (Bailliard & Whigham, 2017). This body of research indicates that people with schizophrenia tend to have difficulty filtering auditory information and tend to miss visual information, particularly information related to emotion. Findings for people with bipolar disorder or obsessive–compulsive disorder (OCD) have been similar. Less research is available examining how people with mental illness process sensory information in daily life.
Occupational therapists typically measure sensory processing in terms of behavioral responses to everyday sensory experiences. One measure of sensory processing is the Adolescent/Adult Sensory Profile (A/ASP; Brown & Dunn, 2002). The A/ASP measures sensory processing on the basis of Dunn’s (1997) Four-Quadrant Model. The four quadrants of the model result from the intersection of two continua: neurological threshold and behavioral response. A high neurological threshold is one in which the nervous system requires an intense stimulus for activation; a low neurological threshold requires a less intense stimulus for activation. Behavioral response can be active or passive. An active response suggests the person engages in behaviors to either increase or decrease exposure to sensory stimuli, and a passive response indicates that the person does little to change his or her environment.
The intersection of these two continua results in four quadrants: low registration, sensory sensitivity, sensation seeking, and sensation avoiding. Low registration includes a high neurological threshold with a passive response, which manifests as underresponsivity. Although sensory sensitivity also encompasses passive behaviors, it does so in combination with a low neurological threshold, so people who fall in this quadrant present as overresponsive. When a person has a more active response, the behaviors are characterized as sensation seeking when matched with a high neurological threshold and as sensation avoiding when matched with a low neurological threshold. Sensation seekers attempt to control the environment by creating or moving toward sensation, and sensation avoiders control the environment by staying away from or blocking sensation.
The A/ASP (Brown & Dunn, 2002) includes four 15-item subscales—one for each quadrant. Normative scores for each subscale serve as a reference point and are divided into three age groups: adolescents, adults, and older adults. Although everyone has a unique sensory profile (Brown et al., 2019), different psychiatric conditions may be characterized by a tendency toward particular sensory preferences. Currently, sensory processing differences among people with different psychiatric conditions are not well known. Several studies have used the A/ASP to examine sensory processing preferences within psychiatric diagnoses, making it easy to compare results across the studies. Therefore, the purpose of this retrospective analysis was to address the following question: “What are the sensory processing preferences as measured by the A/ASP that distinguish psychiatric conditions?”
Method
Design
Each study included in this analysis examined a different diagnosis, such that the results could not be combined in the form of a systematic review. We therefore used a retrospective analysis process to describe the results of each study. Sensory processing preferences are described for each diagnosis, and the results of each study are compared with established norms.
Inclusion and Exclusion Criteria
The search identified studies that used the A/ASP to characterize sensory processing preferences of a group of people with a particular psychiatric diagnosis. Inclusion criteria were as follows: (1) peer-reviewed studies, (2) use of the A/ASP to measure sensory processing preferences, (3) reported means and standard deviations for the four quadrant scores, (4) adolescent and adult participants, and (5) studies of participants with psychiatric conditions.
Search Strategies
Articles were searched for using PubMed, CINAHL, PsycINFO, ERIC, and OTseeker. The search was limited to peer-reviewed articles published from 2002 through January 2018. Search terms were “adolescent adult sensory profile AND psychiatric conditions,” “adolescent adult sensory profile AND mental illness,” “adolescent adult sensory profile AND psychiatric diagnoses,” and “adolescent adult sensory profile AND early psychosis.”
Selection Method
Two of the researchers (Steuter and Karim) screened titles to identify relevant studies for potential inclusion in the analysis. They then obtained abstracts of titles suspected to meet inclusion and exclusion criteria. Next, the full-text articles were retrieved and examined to further evaluate their relevance to the research question. Last, reference lists were screened for potential additional studies.
Data Extraction
After screening the titles, abstracts, and full text for potential inclusion in the review, data were extracted from each study using a standardized data extraction form that included study aim, outcome measures, and main findings. Two of the researchers (Steuter and Karim) independently completed data extraction forms and then compared them. Any discrepancies between the two researchers were resolved through discussion.
Data Analysis
We used an independent-samples t test to compare the mean scores from the included sample with the means of the normative sample as reported in the A/ASP manual (Brown & Dunn, 2002). The effect size was also computed. In addition, bar graphs were created to visually present the findings of each study, organized around the four quadrants of sensory sensitivity, sensation avoiding, low registration, and sensation seeking.
Results
Description of the Sample
The flowchart of included studies (Figure 1) outlines the process of selecting studies for inclusion in the analysis. The initial search identified 112 research articles as potentially relevant to this study. After reading the abstracts, 105 articles were excluded because they did not meet the inclusion criteria. The full text of the 7 remaining studies was read, and inclusion and exclusion criteria were applied, resulting in the exclusion of 2 more studies. Five studies remained and were reviewed (Brown et al., 2002; Engel-Yeger et al., 2013, 2016; Parham et al., 2017; Rieke & Anderson, 2009). The participants of 2 studies (Engel-Yeger et al., 2013; Parham et al., 2017) did not meet the criteria for a Diagnostic and Statistical Manual of Mental Disorders (5th ed.; American Psychiatric Association [APA], 2013) diagnosis; they did, however, target people with a significant psychiatric condition. Parham et al. (2017) focused on the sensory profiles of adolescents at high risk for psychosis, and Engel-Yeger et al. (2013) included participants with symptoms of posttraumatic stress (PTS), but they did not necessarily meet the criteria for posttraumatic stress disorder (PTSD).
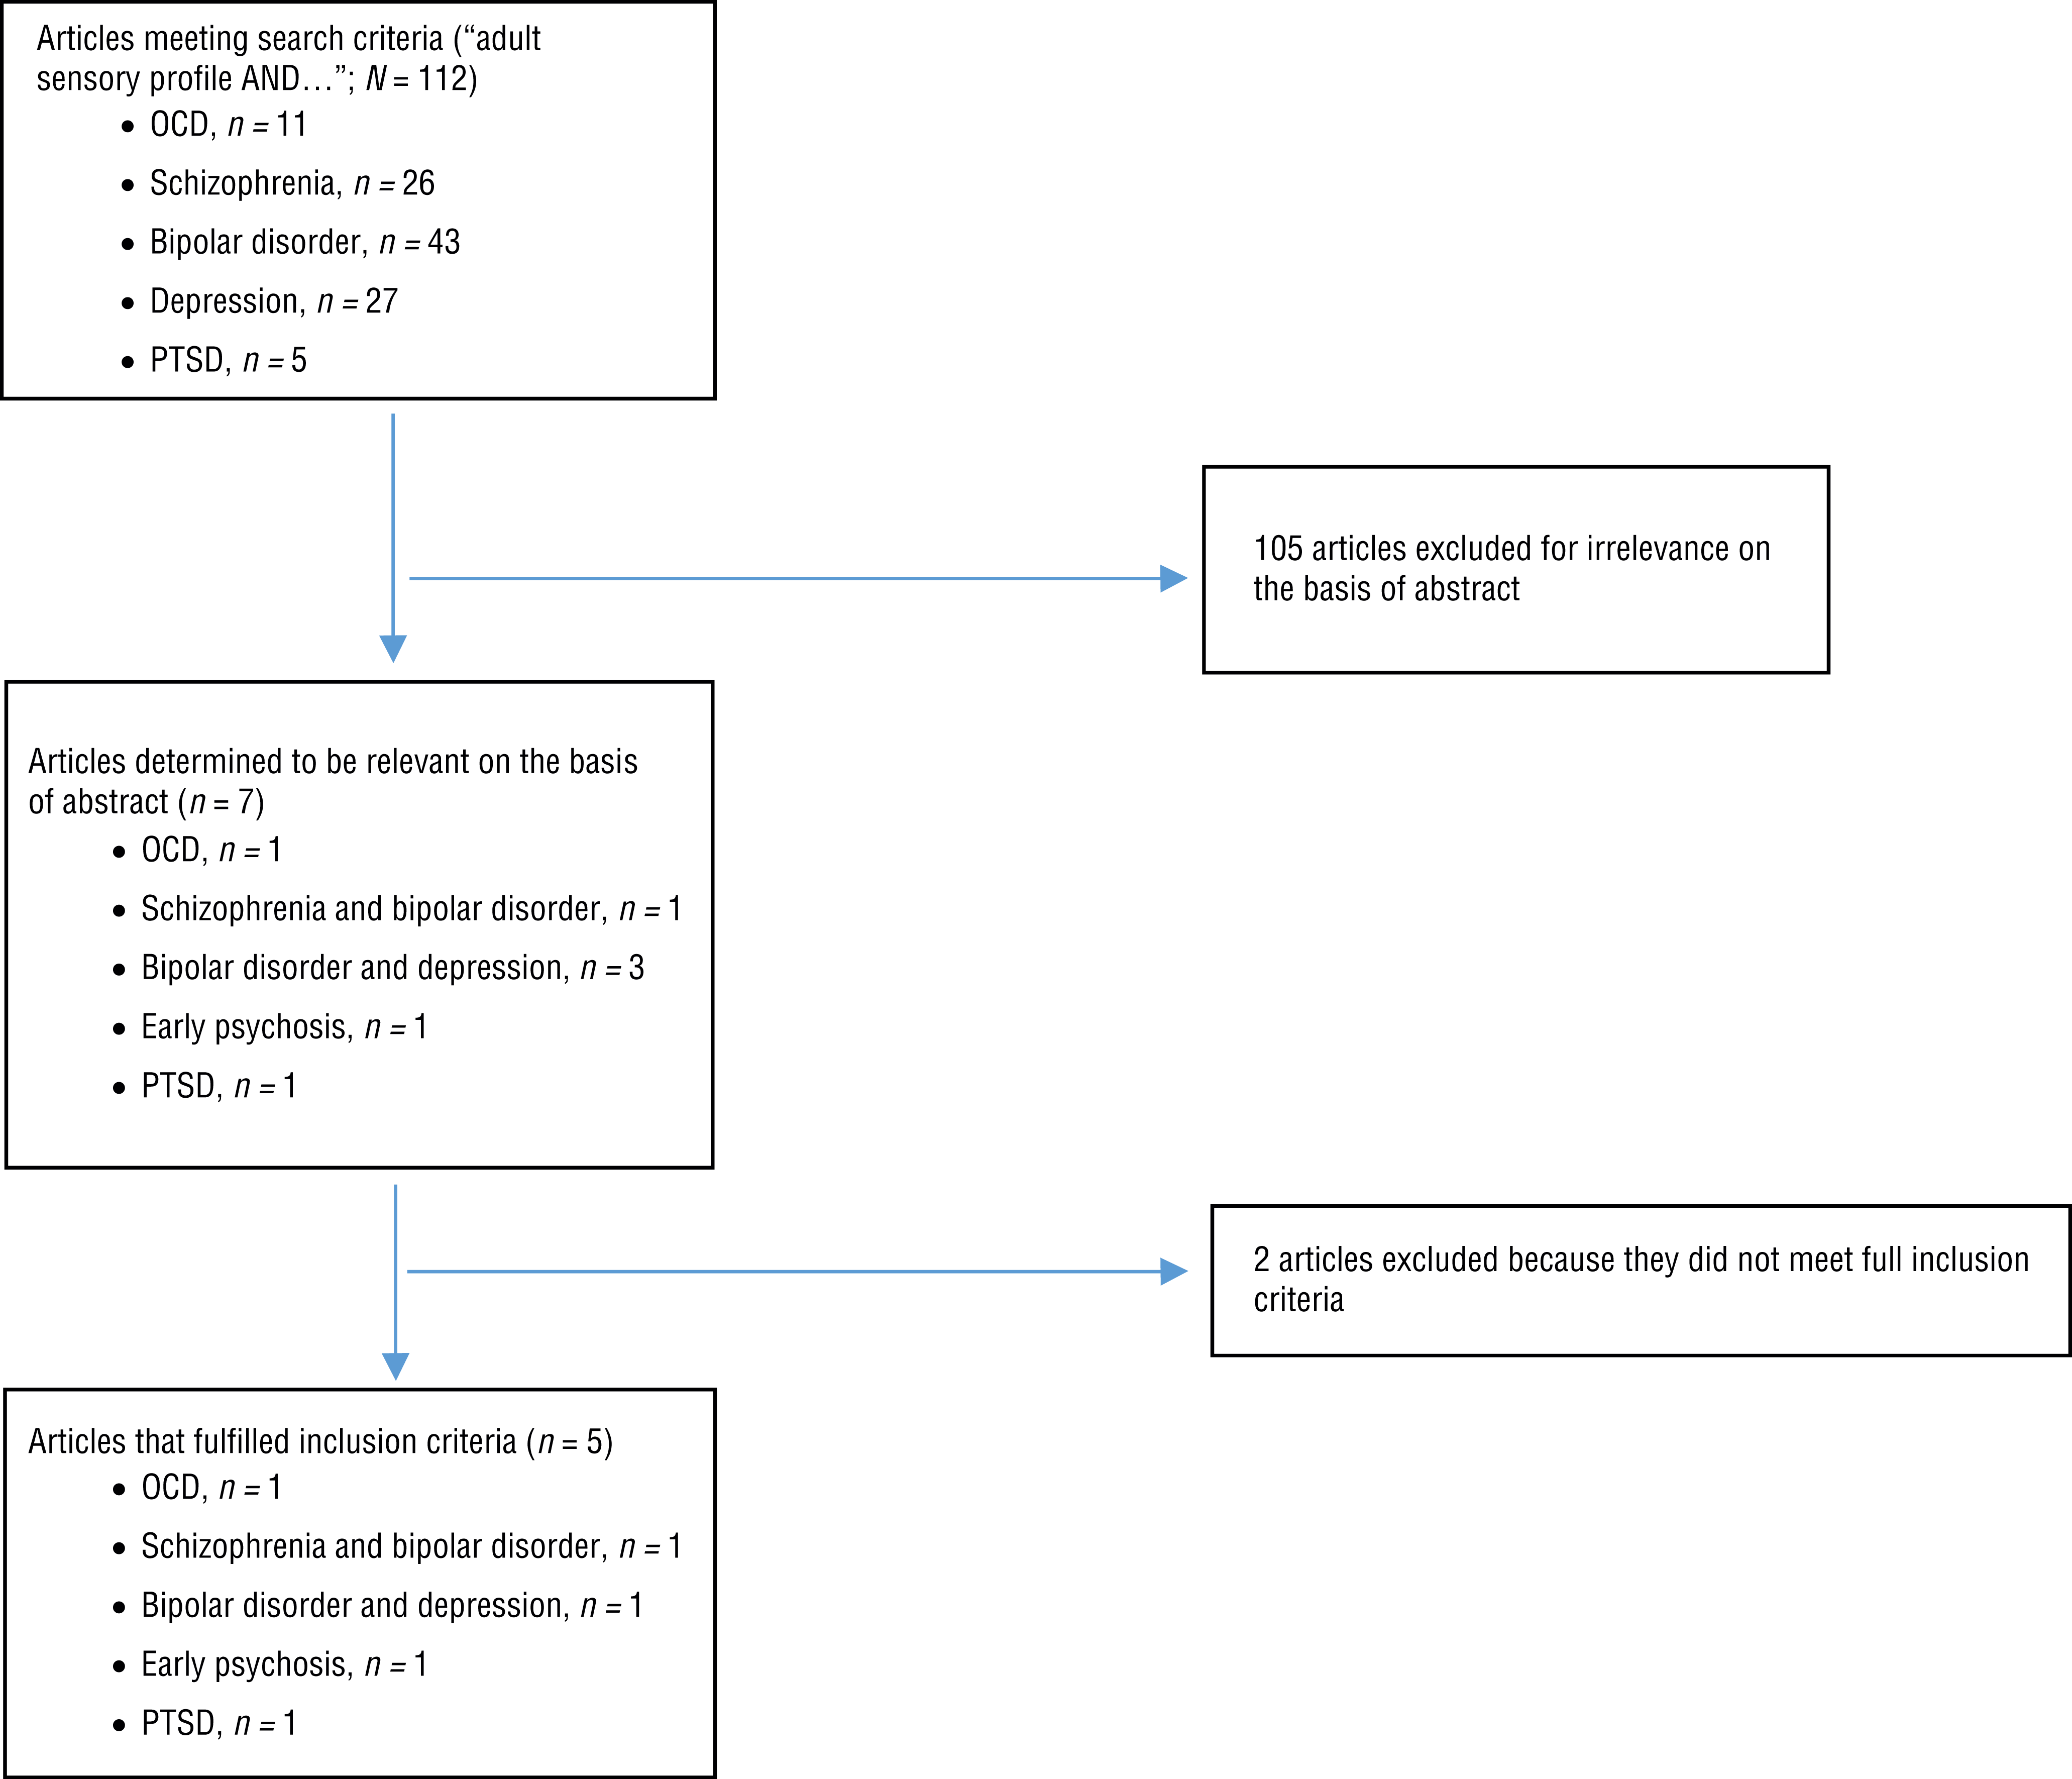
Flowchart of included studies.
Findings
Six conditions were identified from the five studies included in the analysis: schizophrenia, high risk for psychosis, bipolar disorder, major depressive disorder, PTS, and OCD. Table 1 presents the diagnoses addressed and the demographics of the participants in each study.
Study Demographics
Note. PTS = posttraumatic stress.
Independent-samples t tests were used to compare participants with a psychiatric condition with the normative sample (Table 2). A Bonferroni correction was applied to address the potential increase in Type 1 error resulting from multiple comparisons. Thirty-two t tests were conducted; consequently, a conservative p ≤ .00156 (.05/32) was considered statistically significant. Effect sizes are also reported.
Sensory Processing Difference by Diagnosis and Sensory Processing Preference
Note. Orange indicates statistically significant higher scores compared with A/ASP norms, and blue indicates statistically significant lower scores compared with A/ASP norms. Darker shading indicates large effect size. A/ASP = Adolescent/Adult Sensory Profile; M = mean; OCD = obsessive–compulsive disorder; PTS = posttraumatic stress; SD = standard deviation.
The general pattern across all psychiatric diagnoses suggests that, compared with the normative sample, study participants had higher scores for sensory sensitivity, low registration, and sensation avoiding and lower scores for sensation seeking. In no case was the difference in the opposite direction (e.g., when a difference existed in sensation seeking, the group with the psychiatric condition always had lower, not higher, scores than the normative sample). Supplemental Figures 1–4 (available online at http://otjournal.net; navigate to this article, and click on “Supplemental”) illustrate the sensory processing differences across the diagnoses for each sensory processing quadrant.
Schizophrenia
One study included data on participants with schizophrenia (Brown et al., 2002), who had significantly higher scores for sensory sensitivity, low registration, and sensation avoiding than did the normative sample (see Table 2). The high scores for low registration stand out for their large effect size. In addition, participants with schizophrenia had significantly lower sensation seeking scores than the normative sample.
Early Psychosis
Adolescents at clinically high risk for psychosis may later develop a diagnosis of schizophrenia. Currently, many preventive efforts are underway to target this at-risk group. One study examined sensory processing preferences among this group and reported the results for ages 12–17 and ages 18–25 (Parham et al., 2017). The patterns for these groups were similar to those found for Brown et al.’s (2002) participants with schizophrenia: higher scores for sensory sensitivity, low registration, and sensation avoiding and lower scores for sensation seeking.
Bipolar Disorder
A discrepancy exists between the 2 studies that looked at people with bipolar disorder. Participants in Brown et al.’s (2002) study had higher scores for sensory sensitivity, low registration, and sensation avoiding; however, their sensation seeking scores were not statistically different from those of the normative sample. However, in comparison with the normative sample, Engel-Yeger et al.’s (2016) participants with bipolar disorder had lower scores for sensation seeking, higher scores for sensory sensitivity, and no difference for low registration or sensation avoiding. Note that Brown et al.’s study included participants with bipolar I disorder, whereas Engel-Yeger et al.’s study included participants with bipolar I and bipolar II disorders.
Major Depressive Disorder
Engel-Yeger et al. (2016) also studied people with major depressive disorder. Compared with the normative sample, the scores of participants with major depressive disorder were higher for sensory sensitivity and lower for sensation seeking. No between-groups difference was found for low registration and sensation avoiding.
Posttraumatic Stress
Engel-Yeger et al. (2013) conducted a study of sensory processing in people with PTS. Participants in their study did not necessarily meet criteria for PTSD but exhibited symptoms of PTS. These participants had higher scores for sensory sensitivity, low registration, and sensation avoiding and lower scores for sensation seeking. In addition, the differences were exceptionally large, with effect sizes close to or larger than 1 standard deviation for all four quadrants.
Obsessive–Compulsive Disorder
Rieke and Anderson (2009) studied people with OCD; as with Engel-Yeger et al. (2013), their participants showed differences across all four quadrants when compared with the normative sample, with higher scores for sensory sensitivity, low registration, and sensation avoiding and lower scores for sensation seeking. The effect sizes in all but one comparison (sensation seeking) were large, but none were as large as those for Engel-Yeger et al.’s sample.
Comparisons Based on the Adolescent/Adult Sensory Profile Quadrants
We compared the diagnostic groups on the basis of the A/ASP’s four quadrants (Supplemental Figures 1–4). The five studies included six diagnoses, but the figures have eight bars because 2 studies included participants with bipolar disorder, and the study of people at clinical high risk for psychosis were divided into younger and older age groups.
Although the t tests discussed earlier indicate when a significant difference occurred between the mean scores of the diagnostic group and the normative sample, the figures illustrate when the diagnostic group fell outside of the full range in which most people score. In scoring the A/ASP, this range of normative scores is described as “similar to most people.” The figures indicate when more sizable differences exist between the diagnostic group and the normative sample and are consistent with the large effect sizes (see Table 2).
For the sensory sensitivity quadrant, only two of the eight diagnostic groups (PTS and OCD) scored above the range of the normative group (Supplemental Figure 1). The groups with schizophrenia, early psychosis, and mood disorder (both types of bipolar disorder and major depression) scored within the range of most people.
For the low registration quadrant, five of the eight diagnostic groups scored outside of the range of the normative group (Supplemental Figure 2). Participants with schizophrenia, early psychosis, PTS, and OCD all scored higher than most people. The mood disorder groups scored within the range of most people.
The sensation seeking quadrant is the only one for which participants with a psychiatric condition scored lower than the normative sample (Supplemental Figure 3). Three diagnostic groups scored below the range of the normative sample: major depression, bipolar I and II, and PTS.
Five of the eight groups had scores higher than the normative sample for sensation avoiding (Supplemental Figure 4): both groups with early psychosis, PTS, OCD, and one of the bipolar study groups. These five groups differed from those identified in the low registration quadrant. The groups with schizophrenia and major depression and those in the other study that included participants with both bipolar I and bipolar II scored within the range of the normative sample.
Discussion
This retrospective analysis of data from eight studies compares the results for samples with a psychiatric condition with those for the normative sample, as reported in the A/ASP manual (Brown & Dunn, 2002). Comparison of the scores of the diagnostic groups in these studies with the those of the A/ASP normative sample allows for more comparable analyses, because all diagnostic groups are compared with the same reference group. Generally speaking, the analyses revealed a pattern of more sensory sensitivity, low registration, and sensation avoiding and less sensation seeking across psychiatric diagnoses; however, some differences were noted among the specific conditions. We discuss these differences in greater detail in the sections that follow.
Sensory Processing Patterns of People With Schizophrenia and Early Psychosis
The data from Brown et al.’s (2002) study of people with schizophrenia and Parham et al.’s (2017) study of adolescents at clinically high risk of psychosis indicated a consistent pattern of differences across all A/ASP quadrants. Both groups had higher sensory sensitivity, low registration, and sensation avoiding scores and lower sensation seeking scores compared with the normative sample. This finding suggests that people at high risk for psychosis exhibit sensory processing preferences similar to those of people with schizophrenia.
The sensory processing differences of people with schizophrenia and those at high risk for psychosis, as experienced in daily life and indicated by A/ASP scores, may be explained by the results of laboratory studies. Sensory sensitivity in schizophrenia is well supported by evidence of impairment in inhibitory processes that lead to distractibility (Smucny et al., 2013). Studies of social cognition have indicated a hyporesponsiveness to some social cues that is comparable to low registration (Green et al., 2015). Another explanation for low registration in people with schizophrenia is the strong evidence for slowed processing speed, which is strongly linked to functional performance (Woodward et al., 2013). Negative symptoms such as social withdrawal and avolition are analogous to behaviors associated with sensation avoiding and limited sensation seeking. Negative symptoms have a greater impact on functional outcomes than do psychotic symptoms and are associated with impairments in reward processing and psychomotor slowing (Veerman et al., 2017).
Sensory Processing Patterns of People With Mood Disorders
When considering the discrepancy between the results of Brown et al. (2002) and Engel-Yeger et al. (2016), it is important to consider the characteristics of bipolar disorder. Bipolar disorder can be characterized by both manic and depressive episodes. Manic episodes are periods of abnormally and persistently elevated, expansive, or irritable mood, and depressive episodes are periods of depressed mood and loss of interest or pleasure (APA, 2013). Only a manic episode must be present for a diagnosis of bipolar I. A diagnosis of bipolar II disorder requires at least one major depressive episode and one hypomanic episode (a version of a manic episode that is less severe and does not affect functioning).
Brown et al. (2002) found that participants with bipolar disorder had higher sensory sensitivity, sensation avoiding, and low registration scores than the normative population, whereas Engel-Yeger et al. (2016) found that people with bipolar disorder had lower sensation seeking scores but scores similar to those of the normative population for all other quadrants. Engel-Yeger et al. also concluded that people with unipolar major depressive disorder had lower sensation seeking scores and higher sensory sensitivity scores. One explanation for the discrepancy between the two samples is that the Engel-Yeger et al. study included participants with bipolar II disorder, which requires a depressive episode, whereas the Brown et al. (2002) study included only participants with bipolar I disorder, which does not. In fact, Engel-Yeger et al. reported that 54.5% of their participants were currently experiencing a depressive episode. Therefore, one possible conclusion is that depression is associated primarily with low sensation seeking and possibly with sensory sensitivity.
One might expect people with bipolar disorder to display higher sensation seeking patterns while in a manic episode because of the symptoms associated with involvement in pleasurable activities such as sexual activity or substance use, which have sensory qualities (APA, 2013). However, the A/ASP’s sensation seeking quadrant focuses more on engaging in everyday sensory experiences as opposed to risk-taking behaviors.
Sensory Processing Patterns of People With Posttraumatic Stress and Obsessive–Compulsive Disorder
Analysis of the sensory processing scores of people with PTS and OCD revealed similarities in their sensory processing patterns. Both groups exhibited differences in all four quadrants, with higher scores in the sensory sensitivity, low registration, and sensation avoiding quadrants and lower scores in the sensation seeking quadrant. In addition, the effect sizes for the PTS comparisons were all large and represented some of the biggest differences in the entire analysis (ds = 0.99–1.70). Similarly, the effect sizes for OCD were also large for all comparisons (ds = 0.83–1.34) except sensation seeking, which had a moderate effect size (d = 0.53). The underlying anxiety prevalent in these conditions appears to be highly related to sensory-based responses.
PTS and OCD have commonalities that may provide insight into the similar sensory processing preferences of people with these conditions. Both PTS and OCD involve increased anxiety, but the symptoms for each condition present differently. Obsessions are recurrent, persistent thoughts that cause anxiety, and compulsions are repetitive behaviors performed as a means of reducing anxiety (APA, 2013). In PTS, anxiety occurs in response to a significant traumatic event or situation. People with OCD and PTS develop various coping mechanisms that are often used and manifested in unique ways in response to amplified anxiety.
Anxiety is associated with increased hypervigilance, particularly as it relates to perceived threats (Richards et al., 2014). This hypervigilance may be reflected in the higher sensory sensitivity scores of people with PTS and OCD. In addition, increased sensation avoidance and decreased sensation seeking are consistent with the use of avoidance as a coping strategy by people who are anxious (LeDoux et al., 2017). Avoidance includes freezing, active avoidance, and habitual avoidance. Similarly, low registration may be associated with the numbing of general responsiveness (APA, 2013), which is a symptom of PTS. People who are hypersensitive to stimuli in certain fear-evoking situations and environments may, as a pattern of coping, be motivated to engage in rituals, obsessions, or compulsions as a mechanism to decrease stress caused by various sensations in the environment. Rituals can make the world more predictable.
Limitations
Several limitations in the original studies and of this analysis warrant future research to clarify and build on the understanding of sensory processing differences among people with a psychiatric condition. The studies included in this retrospective analysis had relatively small sample sizes, which can decrease statistical power and limit the generalizability of findings. We found only 1 study for each psychiatric condition, with the exception of bipolar disorder, and in the case of bipolar disorder, the inclusion criteria differed between the 2 studies. Additional studies would increase confidence in the findings presented here. A limitation of our analysis is that it does not include unpublished data on this topic.
Implications for Occupational Therapy Practice
Occupational therapists can apply a knowledge of sensory processing differences to the development and implementation of intervention programs and techniques for people with a psychiatric condition. Although the research examining sensory-based interventions for people with psychiatric conditions is limited, one case study found that sensory strategies were useful in improving the work performance of a person with PTSD (Champagne, 2011), and another study found that people with a psychiatric condition who participated in a sensory modulation program could reduce their arousal (Gardner, 2016).
Using Dunn’s Model of Sensory Processing, occupational therapists can primarily focus interventions on adapting or creating environments to meet people’s sensory needs in the context of everyday activities (Brown et al., 2019). Information from this research can be used to create condition-specific sensory interventions for occupational therapists working in mental health and can help them to individualize their approaches from a sensory perspective. Strategies to increase tolerance of sensory information may include graded exposure to various stimuli, making a personal goal to tolerate an experience, and use of rewards or other external motivators; however, greater emphasis should be placed on creating a supportive sensory environment that matches people’s sensory processing preferences. Many aspects of sensation can be targeted, such as the intensity, amount, predictability, and speed of various types of sensory stimuli in the environment. For example, a person with sensory sensitivity will benefit from less intensity and more predictability. Conversely, someone with low registration will benefit from less predictability and a reduction in the speed of the stimuli that are presented.
Although this research outlines general patterns of sensory processing preferences on the basis of psychiatric condition, great individual variability exists. Consequently, all sensory-based interventions should begin with a detailed assessment of the person (AOTA, 2018).
Conclusion
This retrospective analysis aimed to determine the differences in sensory processing patterns among people with various psychiatric conditions as measured by the A/ASP. All people with psychiatric conditions presented with sensory processing preferences that differed from the normative sample. The findings of this analysis can be used by occupational therapists to develop interventions that better meet the sensory needs of clients with psychiatric conditions.
Footnotes
Acknowledgments
The authors thank Barbara Nadler for her assistance in the search for studies. As an author of the Adolescent/Adult Sensory Profile, Catana Brown has a financial interest in the measure.