





Abstract
Although the Brief Pain Inventory is a commonly used pain intensity and pain interference measure for patients with low back pain, this study suggests that caution should be exercised in interpreting the Intensity subscale score and its item scores.
The lifetime prevalence of low back pain (LBP) is as high as 84% (Walker, 2000). LBP affects all life domains and occupations, from basic self-care activities to complex social interactions, work, and leisure activities, and it has a profound impact on quality of life (Montazeri & Mousavi, 2010). For health care providers, the assessment of pain is essential for diagnosing and treating LBP. Because pain and its impact are subjective and personal in nature, pain assessments mainly rely on self-report methods (Turk & Melzack, 2010). In addition to pain intensity, pain interference with daily functioning is considered by researchers, clinicians, and patients to be the most important outcome domain for clinical trials in LBP (Chiarotto et al., 2015). Researchers and clinicians are thus encouraged to simultaneously collect information on pain intensity and pain interference as two core outcomes (Dworkin et al., 2005). Nevertheless, there is an unmet need for a validated patient-reported outcome measure to assess LBP-related symptoms and interference for use in clinical and research settings (Ramasamy et al., 2017).
The Brief Pain Inventory (BPI) is one of the most commonly used measures to assess pain intensity and interference among people with LBP (Chapman et al., 2011; Garg et al., 2020). It contains 11 items that are divided into two domains or subscales: Intensity and Interference (Cleeland & Ryan, 1994). The Intensity subscale consists of 4 items that assess the magnitude of worst, least, average, and current pain using an 11-point Numeric Pain Rating Scale (NPRS). The Interference subscale contains 7 items that assess the influence of pain on people’s daily functioning, also using an 11-point NPRS. The average scores on both the two subscales and the Intensity items are commonly used in the assessment of LBP (Hjermstad et al., 2011; Skljarevski et al., 2010; Starkweather et al., 2015; Yeh et al., 2012). The BPI has good construct validity among people with LBP (Song et al., 2016). Thus, it appears to be a useful outcome measure for assessing pain intensity and interference among people with LBP.
Recent review articles, however, have pointed out that a thorough psychometric examination of the BPI in the LBP population has not been performed (Chiarotto et al., 2019; Garg et al., 2020; Ramasamy et al., 2017), and the test–retest reliability of the BPI among patients with LBP has rarely been examined. Only one study, to our knowledge, has examined the test–retest reliability of the average scores of each of the two subscales (Erdemoglu & Koc, 2013), and the test–retest reliability of the individual items of the Intensity subscale has not been examined. Moreover, this previous study examined test–retest reliability using Pearson’s correlation coefficient (Erdemoglu & Koc, 2013), which may lead to overestimation because it is insensitive to the inconsistency between repeated assessments (Vaz et al., 2013). Overestimation or a lack of test–retest reliability can interfere with the score interpretation and the utility of the BPI among patients with LBP. Accordingly, validation of the test–retest reliability of all commonly used BPI subscales and items are necessary.
The minimal detectable change (MDC) is the smallest real difference in score between consecutive assessments that is not due to random measurement error (Stratford et al., 1998). Providing researchers and clinicians with the MDC of a measure can help them determine whether a patient’s change score is beyond random measurement error or is attributable to chance variation in measurement. Thus, the MDC value of a measure is crucial in the interpretation of scores in both research and clinical settings. However, the MDC for the BPI among patients with LBP has not been examined, which limits score interpretability.
To improve the utility of the BPI in clinical and research settings, the purposes of this study were to investigate its test–retest reliability and to estimate the MDCs of the BPI’s Intensity and Interference subscales among patients with LBP. We also examined the test–retest reliability and MDCs of the four items of the Intensity subscale.
Method
Participants
Patients were recruited from the Department of Physical Medicine and Rehabilitation in a local hospital in Taiwan. Eligible patients were required to have an LBP-related diagnosis (e.g., spondylosis or herniated intervertebral disc) and be age 20 yr or older. Patients were excluded if they had concomitant joint pain or illness likely to confound the assessment of pain (e.g., wound or infection), had any serious or unstable medical or psychological condition (e.g., cancer or depression) that could compromise their participation in the study, and had undergone back surgery within the past 30 days. This study was approved by the hospital’s institutional review board, and written informed consent was obtained from all patients before participation.
Procedure
Basic demographic data, the BPI, and clinical data (e.g., diagnosis and pain characteristics) were collected. After 1 wk, the patients were asked to rate the overall change in their pain status using a 15-point global rating of change scale (Jaeschke et al., 1989). Patients with an average rating of −1 (almost the same, hardly any worse at all), 0 (about the same), and 1 (almost the same, hardly any better at all) were considered to have stable pain conditions and were asked to complete the BPI again.
Measure
The BPI Intensity subscale asks patients to rate their worst, least, average, and current pain intensity in the past 7 days on a scale ranging from 0 (no pain) to 10 (extreme pain). Similarly, the BPI Interference subscale asks patients to rate how their pain interferes with seven life domains (general activity, mood, walking ability, normal work, relations with other persons, sleep, enjoyment of life) on a scale ranging from 0 (does not interfere) to 10 (completely interferes; Cleeland & Ryan, 1994; Ger et al., 1999). For LBP, the internal consistency (i.e., Cronbach’s α coefficient) was .82–.85 for the Intensity subscale and .88–.93 for the Interference subscale (Keller et al., 2004; Tan et al., 2004).
We calculated scores for the two BPI subscales by averaging scores on the subscale items. A high score represents high pain intensity or pain interference (Ger et al., 1999). In addition, the single-item score on the BPI Intensity subscale (i.e., worst, least, average, and current pain intensity scores) was extracted for test–retest reliability and MDC analysis.
Statistical Analysis
The statistical analyses were performed using IBM SPSS Statistics, Version 20.0. Descriptive statistics were used to analyze the demographic and clinical characteristics of the participants. Independent t tests and χ2 tests were used to examine the differences between patients whose pain status, at the 1-wk follow-up, remained stable or not. Single-measure, random-model intraclass correlation coefficients (ICCs[2,1]) were used to quantify the test–retest reliability. An ICC of >.70 was considered satisfactory for research purposes; an ICC of >.90 was considered satisfactory for clinical assessments (Portney & Watkins, 2000).
Within-subject variation and limits of agreement were examined using Bland–Altman plots (Bland & Altman, 1999), which show the difference between test and retest assessment against the mean of test and retest assessment of the BPI subscale scores. The plots can also be used to illustrate the consistency between test and retest assessments (i.e., heteroscedasticity), which represents a tendency, such as the differences between repeated measurements generally increasing or decreasing as the values of the measurements increase (Bland & Altman, 1999). The possibility of heteroscedasticity was examined on the basis of the association (i.e., Pearson’s r) between the mean and the absolute difference of each pair of measurements. If r was >.30, then the data were heteroscedastic (Atkinson & Nevill, 1998).
To assess systematic bias, the paired t test and the effect size d were used to examine the difference between test and retest scores for the two BPI subscales and the single item of the BPI Intensity subscale. The magnitude of the systematic bias was considered trivial if the d was <0.20 (Cohen, 1998).
The MDC was used as the threshold to indicate real improvement (beyond measurement error) for a single individual at the 90% confidence level (Fritz & Irrgang, 2001). In the current study, the MDC was calculated from the standard error of measurement (SEM) with the following formulas:
In these formulas, SD baseline was the standard deviation of the baseline, the r test–retest was the coefficient of the test–retest reliability estimated from ICC(2,1) in this study, and the z scorelevel of confidence was the confidence interval (CI) from a normal distribution (i.e., 1.65 for 90% confidence level).
Results
The demographic characteristics of the participating patients are summarized in Table 1. A total of 139 patients were originally recruited; 85 patients were excluded because their condition was unstable (80 patients assessed for improvement in pain [self-reported change scores ≥2] and 5 patients assessed for deterioration [self-reported change scores ≤−2]). Only the data for the remaining 54 patients were used to examine test–retest reliability. The majority of these patients were female and had chronic pain and a diagnosis of herniated intervertebral disc or root lesion. Scores for the Intensity subscale ranged from a mean of 1.28 (SD = 1.69) for the least-pain item to 4.91 (SD = 2.89) for the worst-pain item. For Interference, the most affected domains were mood, walking ability, and normal work (Ms = 3.46–3.60, SDs = 3.31–3.19); the least affected domain was relationships (M = 1.33, SD = 2.33). The mean Interference subscale score was 3.11 (SD = 2.05).
Demographic and Clinical Data of the Participants
Note. BPI = Brief Pain Inventory.
Participants could report pain in more than one location.
Bland–Altman plots graphically display the variability between the test–retest scores on the Intensity subscale (Figure 1) and the Interference subscale (Figure 2). The mean differences in the test and retest Intensity and Interference scores were −0.26 and 0.44, respectively. The limits of agreement ranged from −3.45 to 2.93 for Intensity scores and from −2.26 to 3.14 for Interference scores. The Pearson’s r values for the association between the mean and the absolute differences for the BPI Intensity and Interference subscales were .16 and .21, respectively.
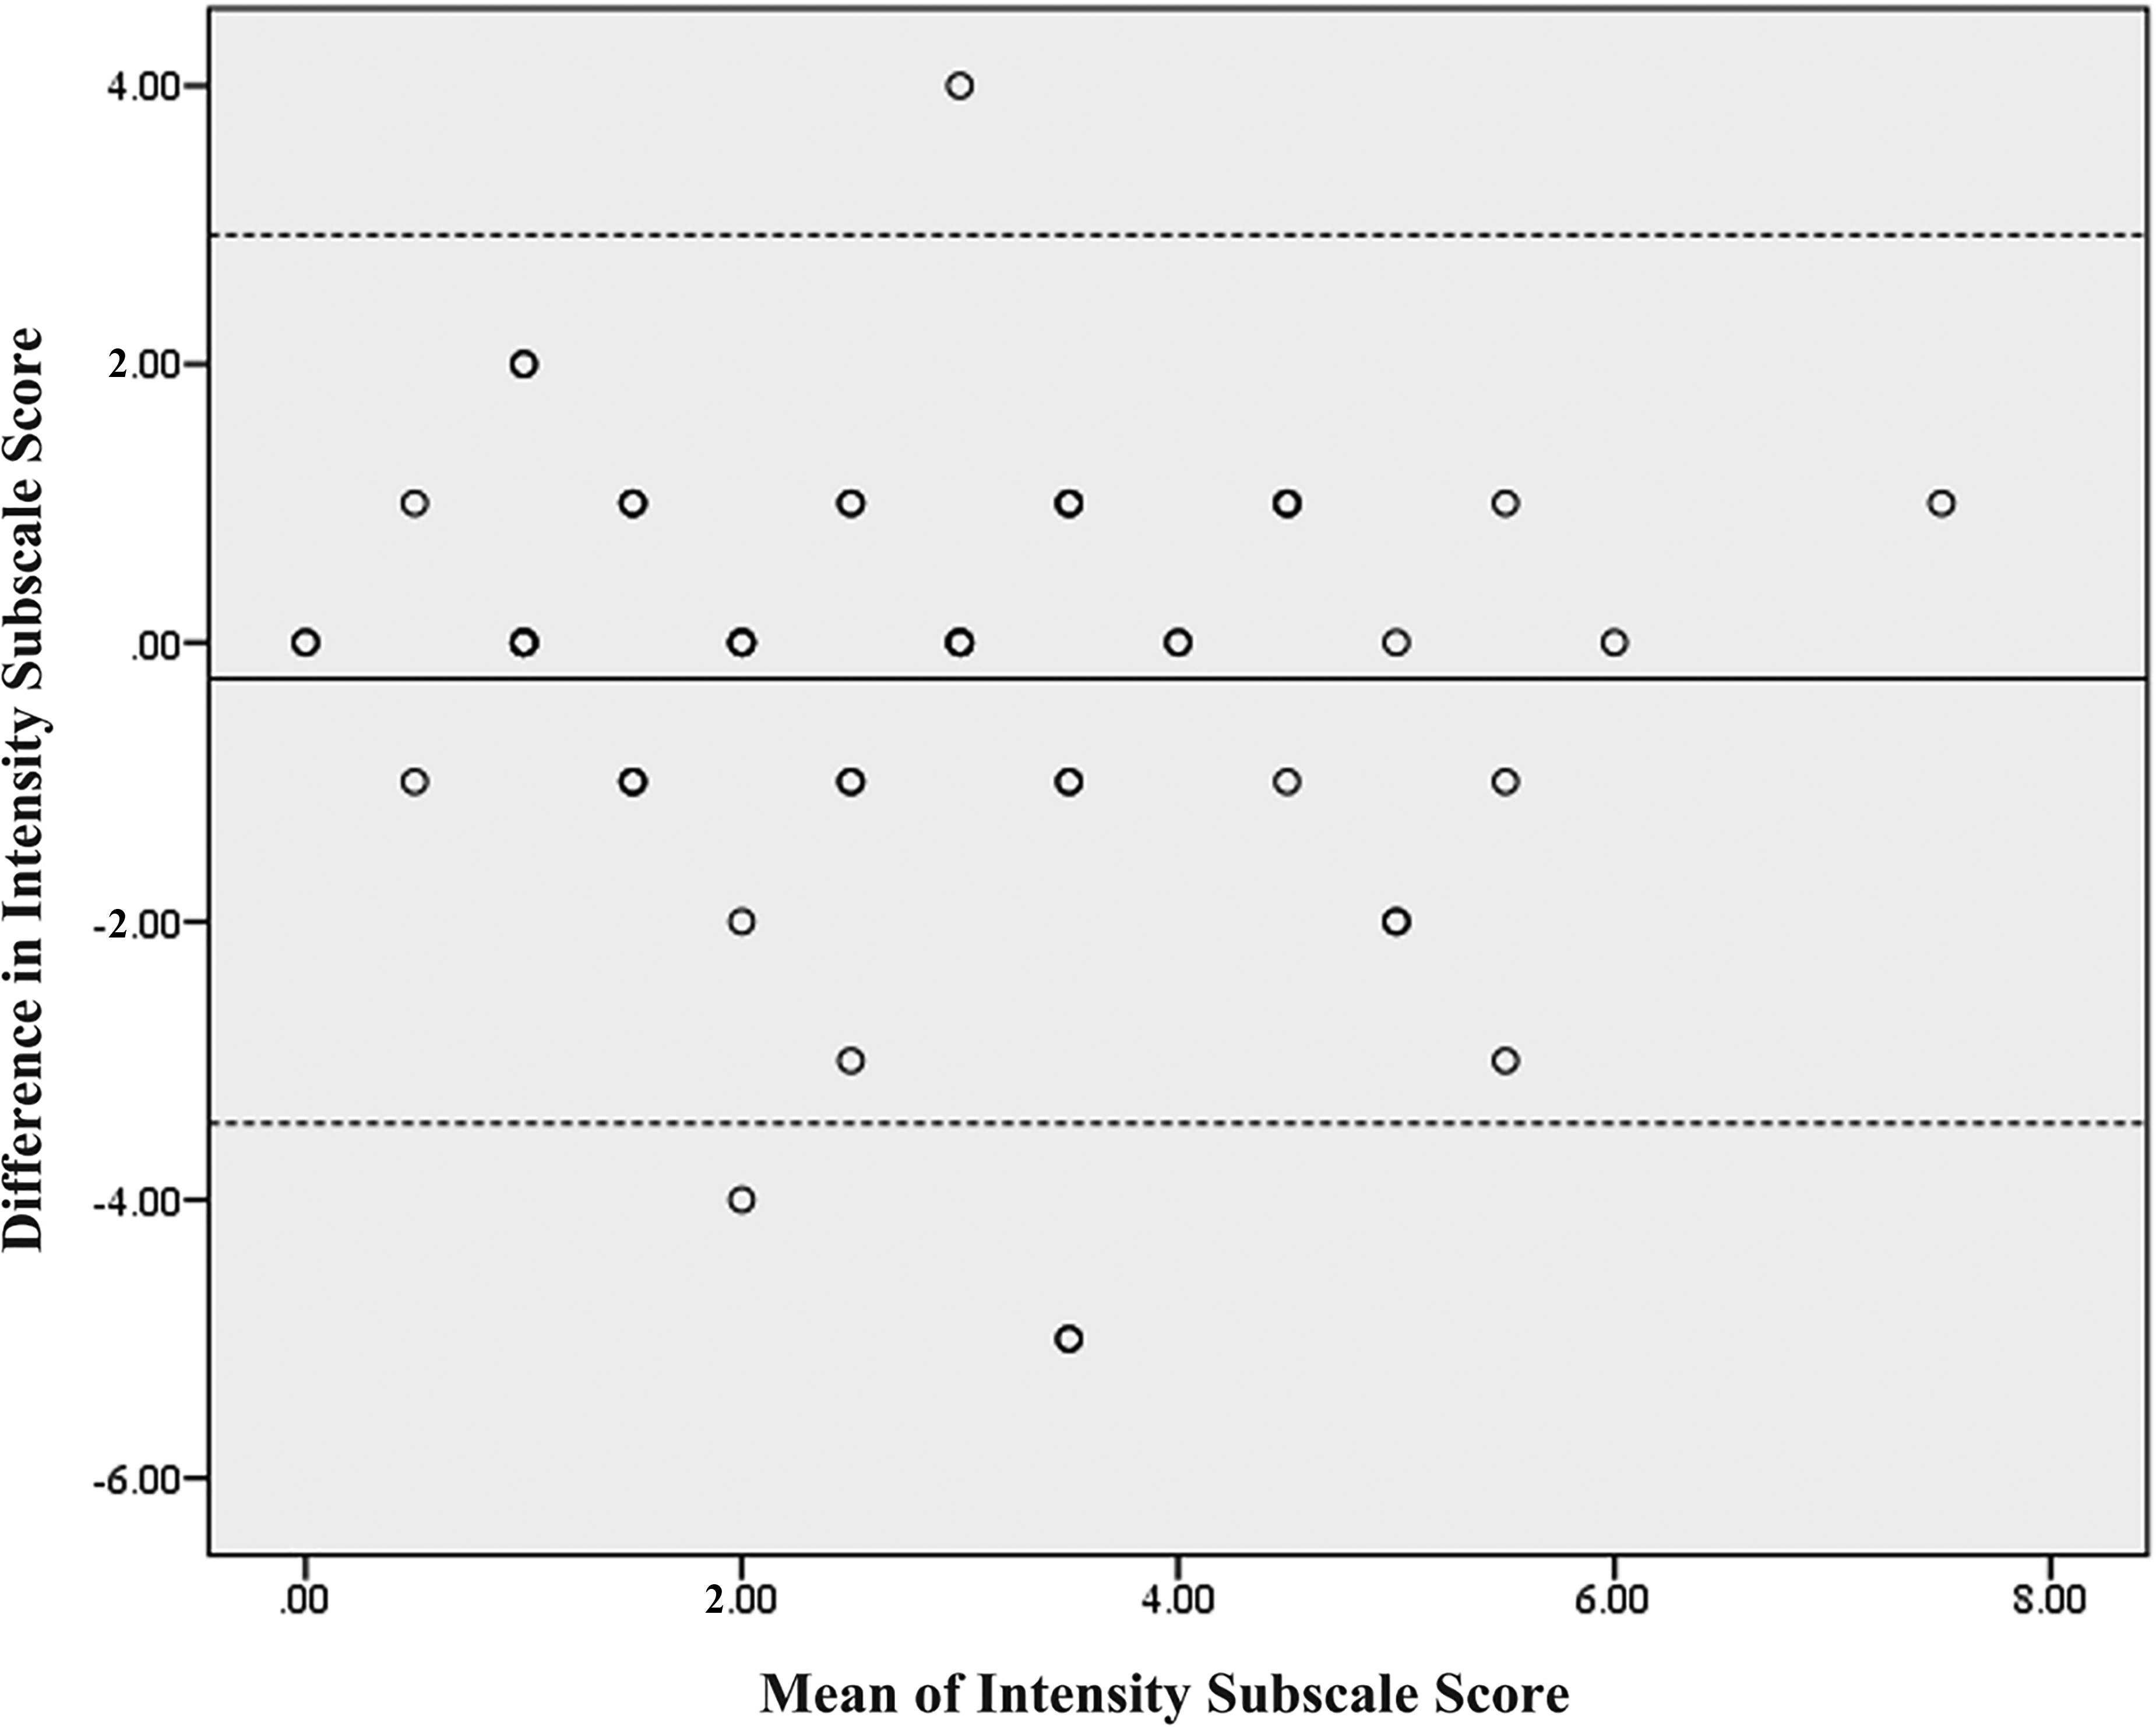
Bland–Altman plot for test–retest reliability of the BPI Intensity subscale.
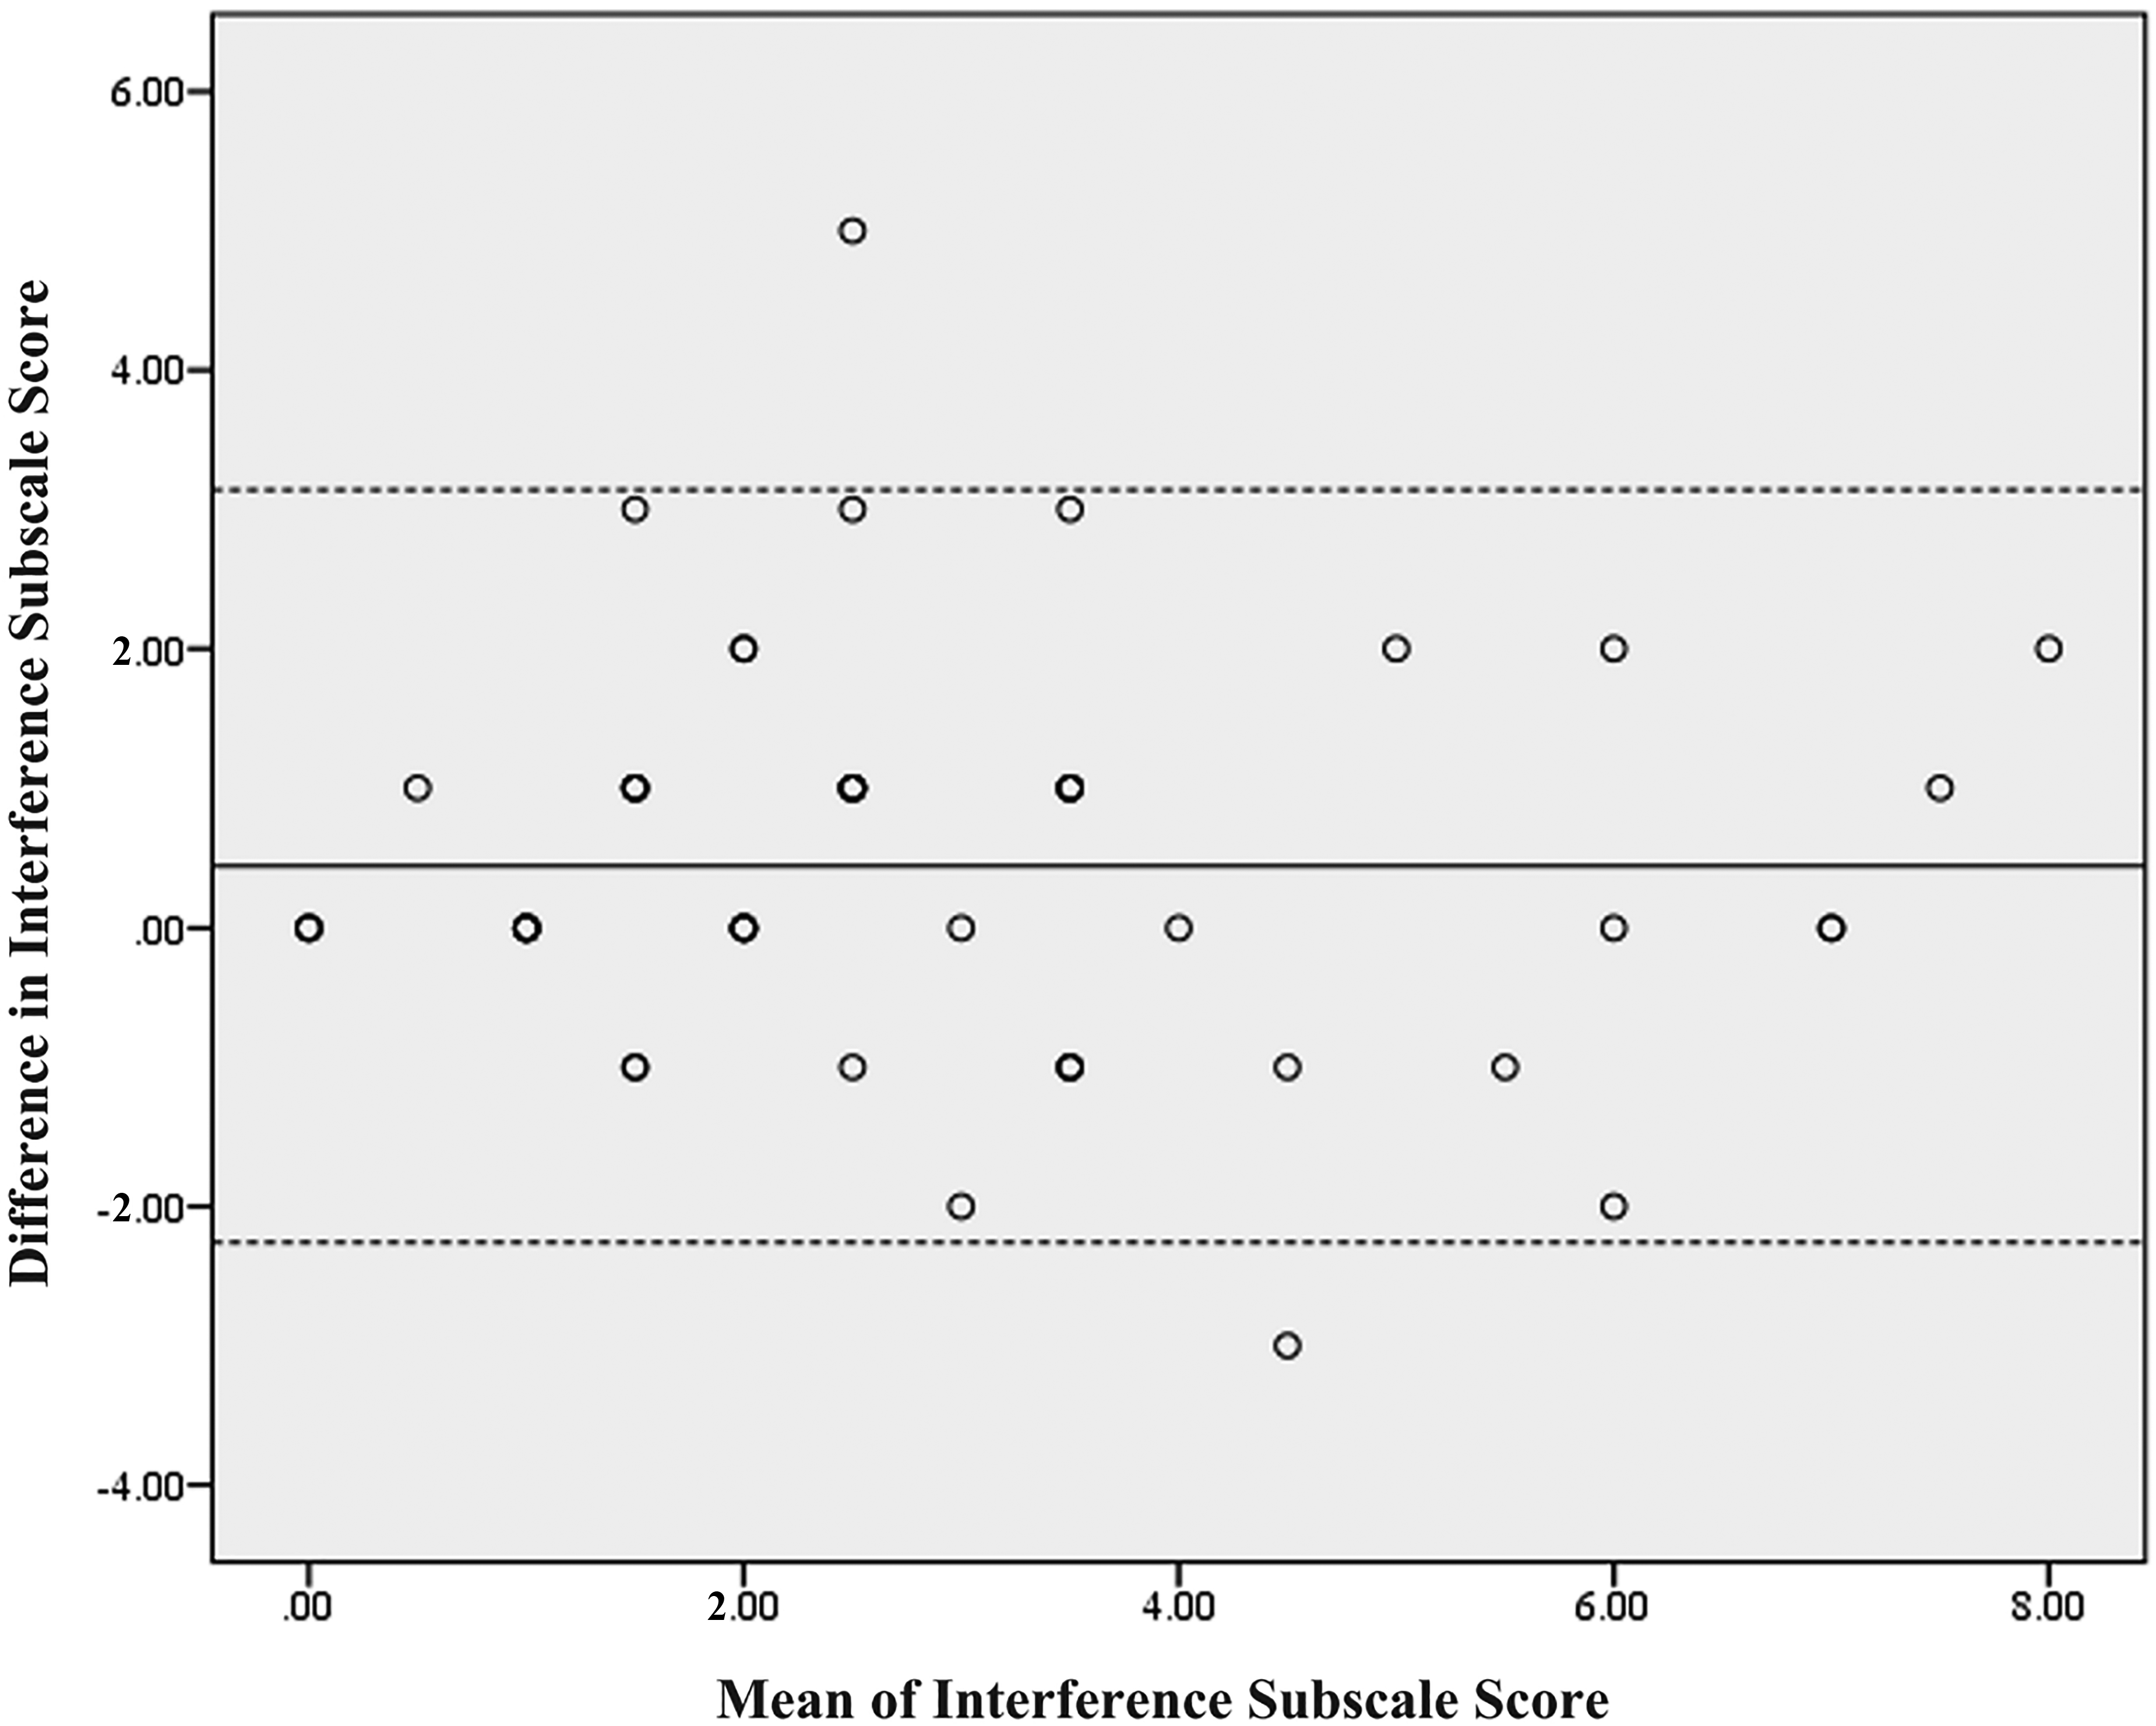
Bland–Altman plot for test–retest reliability of the BPI Interference subscale.
Table 2 shows the results of test–retest reliability indices for the BPI. The paired t test showed no significant differences between test–retest assessments for the Intensity subscale. For the Interference subscale, however, a small but significant difference was found (p = .022, d = 0.21). For the Intensity subscale, the ICC was .62 (95% CI [.43, .76]); for the Interference subscale, it was .76 (95% CI [.62, .86]). In terms of single-item systematic bias, only one significant difference was found for the least-pain item (p = .001, d = 0.45). The ICCs ranged from .40 to .66.
Reliability and MDC of the BPI
Note. N = 54. BPI = Brief Pain Inventory; CI = confidence interval; ICC = intraclass correlation coefficient; MDC = minimal detectable change; SEM = standard error of measurement.
The MDC values for the Intensity and Interference subscales were 2.57 and 2.34, respectively. For the four items of the Intensity subscale, the MDC values ranged from 2.82 to 4.07 (see Table 2).
Discussion
The BPI Intensity subscale was found to have unsatisfactory test–retest reliability (ICC = .62) in measuring LBP intensity. Similarly, Childs et al. (2005) reported an ICC of .61 (95% CI [.30, .77] for a multiple NPRS (i.e., average of three pain ratings of current, best, and worst pain) among patients with LBP. However, a reliability coefficient has to be >.70 to be considered satisfactory for group-level comparisons, and one that is >.90 is suggested to be sufficient for individual-level comparisons (Portney & Watkins, 2000).
The unsatisfactory test–retest reliability might be explained in three ways. The first is the fluctuating nature of pain (Robinson-Papp et al., 2015). The second is the difficulties that patients encounter in quantifying their pain intensity. It is possible that factors other than pain (e.g., mood, distress, tiredness) affect pain perception, and patients may include sensations and experiences other than pain intensity in their ratings (Müller et al., 2015; Robinson-Papp et al., 2015). The third is the therapeutic treatments received by the patients during the data collection period, which might have somewhat changed the symptoms of LBP. The possible changes in symptoms within a 1-wk test–retest interval may have led to lower ICC values. Given the modest test–retest reliability of the BPI Intensity subscale, prospective users should conservatively interpret scores on that subscale.
The test–retest reliability of the BPI Interference subscale (ICC = .76) was superior to that of the Intensity subscale (ICC = .62). This superiority might be because the construct of pain interference is more relevant to patients with LBP, and thus it is easier to conceptualize and rate than pain intensity (Robinson-Papp et al., 2015). However, we noticed a statistical difference between test and retest scores on the BPI Interference subscale, with a small effect size (d = 0.21), implying potential systematic bias, possibly as a result of the confounding effect of therapeutic intervention. On average, patients received two to three treatment sessions between the two assessments. Nevertheless, because the Cohen’s d value was close to the trivial level (i.e., <0.20), the systematic bias may not be of concern. The overall results support the BPI Interference subscale as a reliable measure for assessing the general pain interference caused by LBP.
This study is, to our knowledge, the first to report the MDC of the BPI. We found MDC values of 2.57 for the Intensity subscale and 2.34 for the Interference subscale. These results mean that changes in Intensity and Interference scores of >2.57 and >2.34 points, respectively, indicate real improvement (beyond random measurement error at the 90% confidence level) for an individual patient. In addition, no heteroscedasticity was found in the Bland–Altman plots of the subscales, indicating that the MDC values can be applied to patients with LBP of different levels of pain intensity and interference. The MDC value is particularly valuable in interpreting changes after an intervention in the contexts of clinical practice, case reports, and intervention research (Haley & Fragala-Pinkham, 2006). In addition, researchers conducting clinical trials are advised to report the proportion of a study sample that achieved a true change, which may help clinicians generalize research outcomes to clinical contexts. Such data would improve the utility of the results of an intervention study.
As for the single-item reliability for the BPI Intensity subscale, the test–retest reliability was moderate to good (ICCs = .40–.66). Because pain has a fluctuating nature, it was not surprising to find that the current-pain item had the lowest reliability. In addition, the SEM and MDC values of each Intensity item were all greater than those of the entire Intensity subscale; that is, as expected, the amount of random measurement error was greater for the single-item measure. Therefore, caution must be exercised in assessing LBP intensity when a single BPI Intensity item is used. If only a single Intensity item is used, we recommend the average-pain item because of its relatively higher ICC and lower SEM and MCD values. However, because the test–retest reliability of the Intensity subscale (average item score and individual item scores) was unsatisfactory, the Intensity subscale is not recommended; if used, its scores should be interpreted cautiously.
Limitations and Future Directions
Several limitations of our study are worth noting. The test–retest reliability of the BPI might have been underestimated because our patients received therapeutic treatment, which may have contributed to score variability. A shorter test–retest interval may improve the reliability. Moreover, our participants were patients who were actively seeking rehabilitation for LBP at hospitals, and a majority of them were female, had chronic pain (75%), and were diagnosed with a herniated intervertebral disc or root lesion (65%). Thus, our results may not be generalizable to the general population of people with LBP. With more samples, future studies could divide patients into predominant back pain and leg pain groups. It would be meaningful to individually provide the reliability and the MDC of the BPI for patients with two such patterns of LBP.
Implications for Occupational Therapy Practice
This study has the following implications for occupational therapy practice: The BPI Interference subscale was reliable for assessing pain interference among patients with LBP. Changes in the BPI Intensity and Interference subscale scores of >2.57 and >2.34 points, respectively, indicate real improvement for individual patients with LBP. The BPI Intensity subscale is not recommended, and if used, its scores should be interpreted cautiously.
Conclusion
The current study results suggest that, although the BPI is a commonly used pain intensity and pain interference measure for patients with LBP, caution should be exercised in interpreting the Intensity subscale score and its item scores.
Footnotes
Acknowledgments
Hsin-Yu Chiang and Ching-Lin Hsieh contributed equally to this work and serve as corresponding authors. This study was funded by the Kaohsiung Municipal Ta-Tung Hospital (KMTTH-103-029) in Kaohsiung, Taiwan. We thank Wei Liu, Guan-Yu Chen, and Han-Yun Cheng for their assistance with data collection and management. We are also grateful to the study participants for their contribution to this study.