





Abstract
This article details the development of a short-form Stroke Impact Scale Version 3.0 (SIS 3.0) using a machine learning algorithm (ML–SIS) and concludes that the measure has good potential to be efficient and informative for clinical settings and provides scores that are valid and comparable to those of the original measure.
The Stroke Impact Scale (SIS) is a disease-specific quality of life measure (Duncan et al., 1999), and it is a widely used outcome measure for clinical trials with patients with stroke (Karimi & Brazier, 2016). The most recent version, the SIS 3.0, contains 59 items covering eight domains of life affected by stroke: Strength, Memory and Thinking, Emotion, Communication, Activities of Daily Living, Balance, Hand Function, and Social Participation (Duncan, Bode, et al., 2003). However, administering the SIS 3.0 is time consuming, requiring about 20 min (MacIsaac et al., 2016; Mohammad et al., 2014), which hampers its utility in time-pressed clinical settings. A short-form SIS with sound psychometric properties would help resolve this limitation.
Four short forms of the SIS 3.0 have been developed (see Table A.1 in the Supplemental Appendix, available online with this article at https://research.aota.org/ajot): Duncan, Lai, et al. (2003) developed a 16-item version that provides a single total score representing physical function. Jenkinson et al. (2013) developed an eight-item version with one item for each domain that provides a single total score reflecting overall level of health-related quality of life. MacIsaac et al. (2016) developed an eight-item version almost identical to Jenkinson et al.’s that provides a total score. The only difference between this version and Jenkinson et al.’s version is the items selected for the Mobility domain. Mohammad et al. (2014) developed a 16-item version that provides eight domain scores based on two items in each domain.
Participant Characteristics (N = 1,010)
Note. Because we resampled the patients in the developing and validating data in each of the 50 repetitions, patients’ characteristics are not presented separately for each repetition. NIHSS = National Institutes of Health Stroke Scale.
In general, these short forms have two weaknesses. First, three of them provide only a single total score; the fourth, by Mohammad et al. (2014), provides eight domain scores. Given that the SIS 3.0 is a multidimensional construct (Duncan, Bode, et al., 2003; Duncan et al., 1999), the output of a single score is minimally informative. Second, the scaling of scores on these short forms is different from that of the original SIS 3.0, so the scores are not comparable. Accordingly, the interpretability and utility of these short forms are limited.
Machine learning (ML) refers to a core methodology of artificial intelligence, which is powerful in data prediction and classification (Abbas et al., 2018; Thabtah et al., 2018; Wall et al., 2012). In the rehabilitation fields, ML has shown great potential for shortening assessments without sacrificing substantial information or psychometric properties (Lin et al., 2021; Sahdra et al., 2016; Wall et al., 2012). For example, Lin et al. (2021) found that a 10-item ML-based Fugl-Meyer assessment for patients with stroke provided scores comparable to those of the original 50-item measure with good test–retest reliability (coefficients ≥ .90) and concurrent validity (rs ≥ .90). Therefore, ML appears to be a promising tool for developing short-form measures with sound psychometric properties.
Comparability of scores is a particular strength of ML-based assessments. If the eight domain scores of the SIS 3.0 are defined as the targets to be predicted, the scaling of scores between the ML-based measure and the original measure will be the same, so the domain scores of the ML–SIS will be comparable to the original, ensuring interpretability. Such an advantage cannot be achieved by traditional statistical methods, which use majorly linear transformation (i.e., summation of item scores as domain scores). The scaling of domain scores varies depending on the number of items, and thus the domain scores of the short form are not comparable to those of the original. ML methods can be a solution for improving the interpretability of short-form measures.
In this study, we developed a short-form SIS 3.0 using an ML algorithm (ML–SIS) that provides domain scores comparable to those of the original measure. We also examined the concurrent and convergent validities of the ML–SIS. The research question was, Does a short form (<50% of the total number of items) developed using the ML method yield valid domain scores comparable to those of the original SIS 3.0?
Method
Participants
We extracted data from the Field Administration of Stroke Therapy–Magnesium Trial database (ClinicalTrials.gov NCT00059332; Saver et al., 2014). That trial included people who were suspected of having stroke (identified by the Los Angeles Prehospital Stroke Screen), were ages 45 to 95 yr, had symptoms of stroke that lasted >15 min, and initiated treatment within 2 hr of onset. The data were collected between January 2005 and December 2012, representing a total of 1,700 patients. These patients completed the SIS 3.0 90 days after stroke onset. For this study, we extracted only patient-reported and complete data. We did not seek ethics approval for this study because the data we used were free of personal identifiers.
Procedure
We adopted a three-stage analysis to develop and validate the ML–SIS. In Stage 1, we calculated the contribution of the SIS items to the prediction of the original eight domain scores (Gevrey et al., 2003; Lin et al., 2021) by dividing the sum of the absolute values of the weights of each item by the sum of those of all items (Gevrey et al., 2003; Tozlu et al., 2020). The weights between the input and information-shared layers (see the Data Analysis section) were used because the item scores were multiplied by these weights and passed into the models for the prediction. A total of 50 deep neural network (DNN) models were trained using the patients’ responses to the 59 SIS items (Figure 1). The frequencies of items showing the highest contributions across 50 models were used to select items for the ML–SIS.
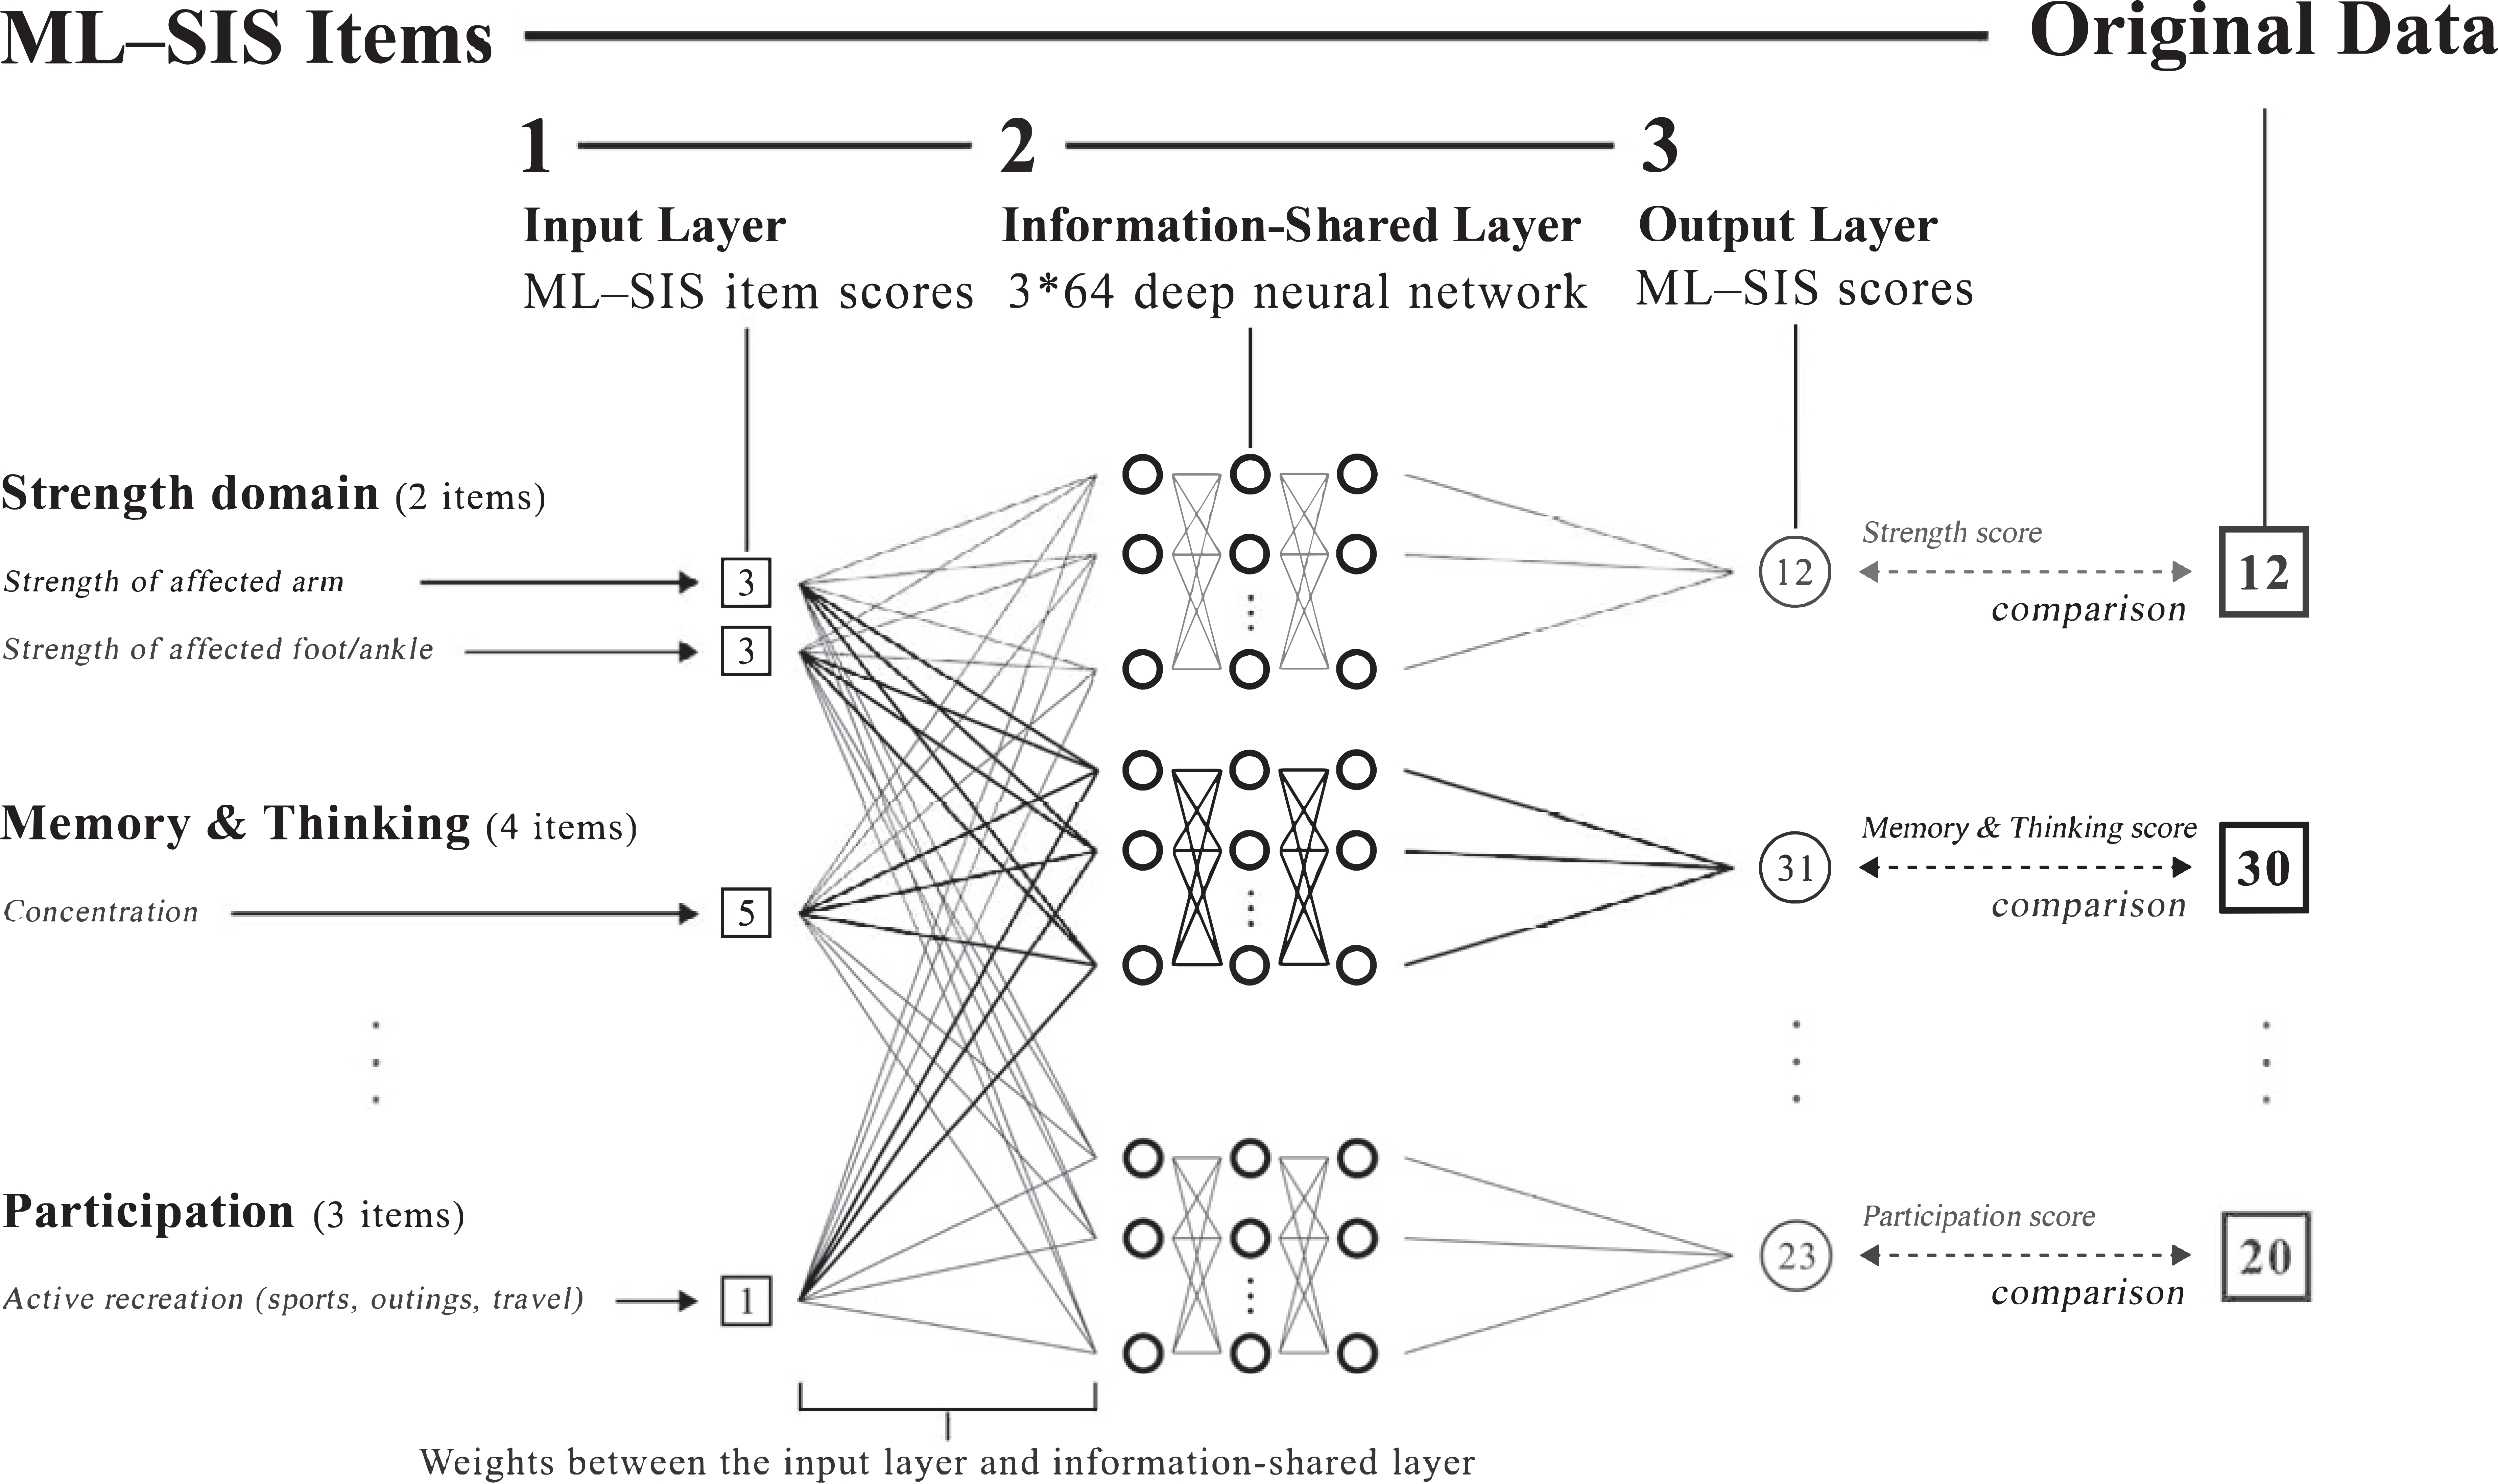
Deep neural network model used for the ML–SIS.
In Stage 2, we developed a scoring model for the ML–SIS. Another 50 DNN models were trained to predict the original domain scores using the selected items. The items were selected on the basis of the frequencies of items showing the highest item contributions across the 50 models alone. The number of items in each domain increased iteratively from one item to all items. We used the coefficient of determination (R 2) to validate the predictive power of the model and selected items in the validating sets. The inclusion of items continued until the average R 2 of the domain was ≥.90. To control for variations in the results, the training and validating processes were repeated 50 times.
In Stage 3, we examined the comparability of scores and psychometric properties of the ML–SIS using the scores provided by the 50 models in Stage 2. We compared the scores on the ML–SIS to those on the original SIS 3.0 and examined the concurrent and convergent validity of the ML–SIS.
Measures
The SIS 3.0 contains 59 items divided into eight domains of life that are of concern to patients affected by stroke (Duncan, Bode, et al., 2003). All items are scored using a 5-point Likert-type scale measuring patients’ satisfaction, self-perceived difficulty, and agreement with a statement (Chou et al., 2015). Higher scores indicate better quality of life (Karimi & Brazier, 2016). The SIS 3.0 has generally good test–retest reliability (intraclass correlation coefficients [ICCs] = .78–.96, except for the Social Participation domain [.67]), convergent validity (moderate correlations with quality of life measures), predictive validity (moderate correlations with related measures with a 3-wk interval), and responsiveness (effect sizes = .22–.52, except for the Emotion [.06] and Social Participation [.04] domains; Chou et al., 2015; Lin et al., 2010).
The National Institutes of Health Stroke Scale (NIHSS; Brott et al., 1989) was used to evaluate patients’ stroke severity. The NIHSS contains 11 items with a total score range of 0 to 42; higher scores indicate more severe stroke. Good psychometric properties, including test–retest reliability (κ = .66–.77), interrater reliability (ICCs ≥.92), and factorial validity (one-factor solution using factor analysis), have been shown in patients with stroke (Dewey et al., 1999; Goldstein & Samsa, 1997; Zandieh et al., 2012).
Data Analysis
The extracted data were randomly divided into a developing set and a validating set with a ratio of 4:1 to ensure that the sample size in the validating set would be ≥200 patients, which is the minimum for a large sample size for psychometric studies (Kyriazos, 2018). We used the developing set to develop the ML–SIS in Stages 1 and 2 and the validating set to validate the generalizability of the predictive power and the concurrent and convergent validity in Stages 2 and 3. For the data used in the 50 models, the pairs of developing set and validating set were generated using different random seeds, so the constituents of these sets were different across the 50 repetitions and could control the variations caused by sampling. The repetition of 50 epochs was selected because it has been reported to provide stable results (Li et al., 2019).
The DNN model contains three parts (Figure 1): input layer, information-shared layer, and output layer. The input layer was used to input item scores of the SIS 3.0 and the ML–SIS (59 neurons for Stage 1 and the equal numbers to the selected items for Stage 2). The information-shared layer was used to extract and analyze the information provided by the input layer and generated the results to the output layer. The output layer consisted of the eight domain scores of the ML–SIS (one neuron for each parallel model). The information-shared layer comprised three layers with 64 neurons in each layer.
We selected the three-layer network because it can solve most prediction probes (Goodfellow et al., 2017). The selection of 64 neurons in each layer is consistent with recommendations that the number of neurons be (1) larger than that of the input layer (maximum of 59 items, approximated using the power of 2; i.e., 26 = 64 neurons) and (2) consistent in all layers (Bengio, 2012). All neurons in the DNN model were fully connected with the rectified linear unit as the activation function, except that of the output layer, which was linear. To optimize the predictive power, each domain score was predicted by an independent three-layer DNN model with the same input layer. Accordingly, the ML–SIS was the combination of the eight parallel models (i.e., each parallel model predicted one domain score only).
The weights in the models were updated and trained in 600 epochs. In each epoch, the weights of the DNN models were fine-tuned to minimize the differences (mean squared error loss) in scores between the predicted eight domain scores of the ML–SIS and the eight domain scores of the original SIS 3.0 with the adaptive moment estimation optimizer (Abadi et al., 2016). To avoid overtraining, the early stopping method was used if the differences between the input and output layers did not increase for 50 epochs (Prechelt, 1998). To enhance the differences in the contribution of items, the L1 penalty was added to the input layer with a λ of 0.5 (Suárez-Álvarez et al., 2018). The analyses of the DNN models were performed in TensorFlow (Abadi et al., 2016).
The comparability of scores was examined with root-mean-square error (RMSE) and mean absolute error (MAE; Chai & Draxler, 2014). RMSE is sensitive to large errors and can be useful for detecting severe mispredictions (Chai & Draxler, 2014). RMSE was calculated as the square root of the average of the squared differences between the predicted domain scores and the original domain scores. MAE, used because of its better interpretability (representing the average magnitude of errors; Chai & Draxler, 2014), was calculated as the average of the absolute differences between the predicted domain scores and those of the original domain scores. The values of both indices range from zero to infinity, with smaller values indicating better prediction. We adopted a commonly used criterion, 10% of the domain scores, for acceptable random measurement error (Smidt et al., 2002).
For concurrent validity, Pearson’s correlations (rs) between the predicted eight domain scores of the ML–SIS and those of the original SIS 3.0 were calculated; we considered r ≥ .75 to indicate good concurrent validity (Van Deusen & Brunt, 1997). Regarding convergent validity, the interdomain correlations between the eight domain scores of the ML–SIS were compared to those of the SIS 3.0; we considered similar interdomain correlations between the two measures to indicate good convergent validity.
Results
We extracted SIS data for 1,289 patients. Data for the 1,010 patients with complete SIS scores were randomly assigned to the developing set (n = 808) and testing sets (n = 202). The patients’ average age was 67.9 yr (SD = 13.4; Table 1). The majority of patients were male (60.5%), White (77.7%), and diagnosed with ischemic stroke (79.6%). The average stroke severity (NIHSS score) was mild (M = 1.9, SD = 3.0).
The 28 items selected for the ML–SIS were those most frequently selected within the 50 models (see Table A.2 in the Supplemental Appendix, available online with this article at https://research.aota.org/ajot). The number of items in the Balance domain was reduced the most (by 77.8%); the number in the Emotion domain was reduced the least (by 11.1%).
Number of Items, Mean Scores, Comparability, and Concurrent Validity of the ML–SIS
Note. The 95% CI was calculated based on the results of the 50 repetitions in Stage 2. RMSE% and MAE% were calculated by dividing the means of RMSE and MAE by the corresponding domain scores (e.g., 20 for the Strength domain with 4 items). ADL = Activities of Daily Living domain; CI = confidence interval; MAE = mean absolute error; ML–SIS = short-form SIS 3.0 using a machine learning algorithm; R 2 = coefficient of determination; RMSE = root-mean-square error; SIS 3.0 = Stroke Impact Scale Version 3.0.
The ML–SIS provided similar scores (differences in average domain scores of <0.1), higher R 2s (average R 2s = .90–.96), and smaller residuals (average RMSE = 0.87–2.84, RMSE% = 2.7%–7.2%; average MAE = 0.49–1.85, MAE% = 1.6%–4.5%) compared with the original SIS 3.0 across the 50 repetitions (Table 2). The correlations between scores on the ML–SIS and on the original SIS 3.0 were high (rs = .95–.98; Table 2). Moreover, the interdomain correlations between the domain scores of the ML–SIS and the original SIS 3.0 were very similar (Table 3).
Interdomain Correlations of the ML–SIS and the SIS 3.0
Note. Coefficient ranges were calculated on the basis of the results of the 50 repetitions in Stage 2. ADLs = Activities of Daily Living domain; ML–SIS = short-form SIS 3.0 using a machine learning algorithm; SIS 3.0 = Stroke Impact Scale Version 3.0.
Discussion
The ML–SIS reduced by over half the number of items in the original SIS 3.0. ML–SIS scores for our sample were very close to their scores on the original SIS 3.0, with residuals smaller than 10% of the corresponding domain scores. These findings indicate that the ML–SIS can improve the efficiency of assessments targeting health-related quality of life in patients with stroke, and they support the utility of ML methods for the development of short-form measures.
The ML–SIS provided scores highly correlated with those of the original SIS 3.0, indicating sufficient concurrent validity. Furthermore, the interdomain correlations of the ML–SIS were very similar to those of the original SIS 3.0, indicating good convergent validity. These findings demonstrate that the ML–SIS can provide valid assessments of health-related quality of life for patients with stroke.
The ML–SIS has two advantages. First, it provides the eight domain scores of the original SIS 3.0, whereas most other short forms provide a single total score only. Thus, the ML–SIS can be as informative as the SIS 3.0 in identifying patients’ needs in specific domains. Second, scores on the ML–SIS have the same scaling as those of the SIS 3.0, indicating that the scores can be interchangeable. Accordingly, the ML–SIS may be used as an alternative to the SIS 3.0 in time-pressed clinical settings. Moreover, interchangeable scores can improve interpretability because scores on the ML–SIS can be compared to those found in previous studies using the SIS 3.0. These advantages strengthen the utility of the ML–SIS in both clinical and research settings.
The ML–SIS development process was less effective in reducing the number of items in the Emotion domain, possibly because of the diversity of the content of those items. For example, the ML–SIS includes three reverse-worded items, which may provide different information than the other six items assessing negative emotions (Suárez-Álvarez et al., 2018). Another example is that two items were related to patients’ interpersonal relationships (e.g., “feel that there is nobody you are close to”), which could not be predicted by items assessing purely emotional status (e.g., “feel sad”). Therefore, the ML–SIS may need more Emotion items to improve the predictive power. However, although the reduction of Emotion items was limited, the total number of items of the ML–SIS remained small. Thus, the ML–SIS can still be an efficient option.
Regarding accessibility, we developed an online system for administering the ML–SIS. As with other online self-report questionnaires, our system has an administrative interface to present the item content and response options, collect patients’ responses, and provide immediate results when the test is completed. The online system has better utility for two reasons. First, all 50 models used in Stage 2 are included; therefore, average scores and corresponding 95% confidence intervals can be provided to improve the robustness and interpretability of results. Second, because the DNN model is hosted on the server of the online system, the score calculations are performed on the server, avoiding additional burden on users’ devices. Thus, the online system requires no additional equipment and improves the feasibility of administration. Prospective users can contact the authors to access the online system.
Limitations
This study has at least three limitations. First, participants completed the SIS 3.0 90 days poststroke, so the results cannot be generalized to patients in the acute and chronic phases. Second, the data were analyzed using simulations of secondary data; in particular, the same data were used to calculate the correlations between the ML–SIS and the original SIS 3.0. Accordingly, the performance of the ML–SIS may have been overestimated and different from that obtained if the ML–SIS and the SIS 3.0 were administered separately. Third, the ML–SIS requires complete data with no missing values, potentially constraining its utility. Further cross-validation of our results in independent samples with different stroke chronicity (i.e., acute and chronic stages) is needed. Researchers can consider using alternative structures for analysis (e.g., number of layers and neurons in information-shared layers) and other ML algorithms (e.g., extreme gradient boosting).
Implications for Occupational Therapy Practice
This study has the following implications for occupational therapy practice: ▪ The ML–SIS can be an efficient alternative to the SIS 3.0 and may be used in routine assessments (e.g., weekly) to reduce the burden of administration and provide scores as informative as those of the full-length SIS 3.0. ▪ The ML–SIS is an example of how machine learning algorithms can be helpful in occupational therapy practice.
Conclusion
The ML–SIS has substantially fewer items and can produce scores that are similar and comparable to the original SIS 3.0 with good validity. Therefore, the ML–SIS can be used as an efficient alternative to the SIS 3.0 to obtain informative and valid assessments of health-related quality of life.
Supplemental Material
Supplementary material for Development of a Short-Form Stroke Impact Scale Using a Machine Learning Algorithm for Patients at the Subacute Stage
Supplementary material, sj-pdf-1-aot-10.5014_ajot.2022.049136.pdf for Development of a Short-Form Stroke Impact Scale Using a Machine Learning Algorithm for Patients at the Subacute Stage by Shih-Chieh Lee, Inga Wang, Gong-Hong Lin, Pei-Chi Li, Ya-Chen Lee, Chia-Yeh Chou, Chien-Yu Huang and Ching-Lin Hsieh in The American Journal of Occupational Therapy
Footnotes
Acknowledgments
Ya-Chen Lee and Ching-Lin Hsieh equally contributed to this work and both serve as corresponding authors. This work was supported by the Ministry of Science and Technology (MOST 110-2628-B-038-013, MOST 109-2314-B-038-147, and MOST 109-2314-B-002-110-MY3).
References
Supplementary Material
Please find the following supplemental material available below.
For Open Access articles published under a Creative Commons License, all supplemental material carries the same license as the article it is associated with.
For non-Open Access articles published, all supplemental material carries a non-exclusive license, and permission requests for re-use of supplemental material or any part of supplemental material shall be sent directly to the copyright owner as specified in the copyright notice associated with the article.
