





Abstract
Precis (for TOC): This psychometric comparison demonstrates the reliability and validity of three measures of depression—Center for Epidemiologic Studies Depression Scale, Beck Depression Inventory–II, and Geriatric Depression Scale—for patients with stroke.
Depression is a common psychological complication after stroke. Approximately 30% of patients develop depression in the early or late stages of stroke (Paolucci, 2008). Poststroke depression influences patients’ functional recovery and independence in performing activities of daily living (ADLs) and greatly affects their quality of life (Ezema et al., 2019; Kim et al., 2018; Towfighi et al., 2017). Moreover, depressive symptoms after stroke may be the main indicators of increased risk of mortality in patients with stroke (Ellis et al., 2010). To manage depressive symptoms, clinicians and researchers should administer sound measures to develop treatment plans and monitor their patients’ depression status.
The three self-report depression measures that currently and commonly are used to assess depression symptoms in patients with stroke are the Center for Epidemiologic Studies Depression Scale (CES–D; Radloff, 1977), the Beck Depression Inventory–II (BDI–II; Beck et al., 1996), and the Geriatric Depression Scale (GDS; Yesavage et al., 1982–1983). Poststroke depression symptoms include fatigue, loss of interest in usual activities, sleep disturbance, difficulty concentrating, and feelings of sadness (Kouwenhoven et al., 2011; Lee et al., 2021; Terroni et al., 2009). The items on the three measures assess similar depression symptoms. The CES–D was designed to assess depression symptoms in the general population. The BDI–II was developed to correspond to the criteria of the Diagnostic and Statistical Manual of Mental Disorders (4th ed.; DSM–IV; American Psychiatric Association, 1994) for the diagnosis of depressive disorders. The GDS was developed to assess depression symptoms in geriatric populations (Yesavage et al., 1982–1983). The BDI–II rates how respondents have been feeling in the past 2 wk. The time frame of 2 wk is based on the DSM–IV criteria for diagnosing major depressive disorder. The CES–D and GDS assess depression feelings in the past week. Both of these measures are free of charge; the BDI–II is not. All three instruments can be filled out by the respondent or through interviews and have short administration times (5–10 min; Moon et al., 2017; Smarr & Keefer, 2011). Thus, all three are suitable for assessing depression status in patients with stroke.
The psychometric properties of these three depression measures have been evaluated in patients with stroke. The construct validity of the CES–D has been examined using exploratory factor analysis, confirmatory factor analysis, and Rasch analysis (Kim & Park, 2011, 2012). The internal consistency and construct validity of the BDI–II were evaluated using Rasch analysis (Lerdal et al., 2014). The internal consistency, test–retest reliability, and construct validity of the GDS have been evaluated using confirmatory factor analysis (Chau et al., 2006; Sivrioglu et al., 2009). However, we note two restrictions.
First, explorations of the psychometric properties of these depression measures are limited. The reliability (e.g., test–retest reliability) of the CES–D and BDI–II has not been investigated, and the validity (e.g., discriminative validity and concurrent validity) of all three depression measures has not been examined. Test–retest reliability estimates whether a measure is free from random measurement error and can produce stable test results over repeated measurements (Hobart et al., 2004). Discriminative validity indicates whether a measure can differentiate varying levels of function in respondents (Brock et al., 2002). Concurrent validity refers to the degree of correlation between a particular measure and other measures of the same construct (Portney & Watkins, 2009).
Second, to the best of our knowledge, psychometric comparisons of the three depression measures in a single sample of patients with stroke are insufficient. There is scant information available to help clinicians and researchers when they have to select from the various measures of depression. It is necessary to provide empirical evidence based on comparisons of psychometric properties in a single sample of patients with stroke for clinicians and researchers. Therefore, in this study we aimed to examine and compare the psychometric properties of the CES–D, BDI–II, and GDS in a single sample of patients with stroke.
Method
Participants
A sample of outpatients with stroke from the Department of Physical Medicine and Rehabilitation in one hospital in southern Taiwan was recruited from March 2018 to April 2019. The five inclusion criteria were as follows: (1) this was the first onset of stroke, (2) age >20 yr, (3) onset of stroke >6 mo, (4) ability to follow instructions to complete the cognitive measure (Mini-Mental State Examination score ≥24; Folstein et al., 1975), and (5) stable condition without adjustment of any medications in the past 3 mo. The two exclusion criteria were (1) presence of visual neglect or visual field deficits (e.g., cataracts, glaucoma) and (2) a history of mental illness. This study was approved by the ethics review board of the hospital, and informed consent was obtained from all patients. The patients’ average age was 55.3 yr, 33.9% of them were women, and 54.2% of them had an ischemic stroke. The mean time since stroke onset was 44.9 mo.
Procedure
Three occupational therapists who worked at the hospital (Yi-Ju Chen, Wen-Chi Wu, and Min-Yuan Yu) collected data and helped the patients, who had been referred from other occupational therapists at the hospital, fill out the measures. In total, the three measures took approximately 20–30 min to complete. If the patients felt tired, they were given a short break. All patients who met the recruiting criteria filled out the CES–D, BDI–II, and GDS twice, with a 2-wk interval, in a quiet place, for the purpose of examining test–retest reliability. We selected a 2-wk interval to avoid weariness from filling out the measures at the second assessment and to reduce memory bias, which would affect test–retest reliability (Imam & Miller, 2012). At the first assessment, the Barthel Index (BI) was administered as well. The three occupational therapists were authorized to access the patients’ medical records to obtain demographic information (e.g., time since onset and stroke type).
Measures
The CES–D contains 20 items that assess depression symptoms in the past week (Radloff, 1977). These items are rated on a 4-point scale ranging from 0 (rarely or none of the time [<1 day a week]) to 3 (most or all the time [≥5 days a week]). Four items (i.e., Items 4, 8, 12, and 16) are expressed as positive descriptions and are reverse scored. The total score ranges from 0 to 60. A higher score indicates more severe depression symptoms. A CES–D score ≥16 indicates clinical depression (Blank et al., 2004).
The BDI–II assesses the severity of depression (Beck et al., 1996). It includes 21 sets of four or seven statements, rated on a 4-point scale ranging from 0 (e.g., I do not feel sad) to 3 (e.g., I am so sad or unhappy that I can’t stand it). Respondents select statements that best express their feelings in the past 2 wk. The total score ranges from 0 to 62. A higher score indicates more severe depression. The cutoff points for depression on the BDI–II are as follows: 0–13 = minimal depression, 14–19 = mild depression, 20–28 = moderate depression, and 29–62 = severe depression.
The GDS is used to detect depression status in the past week. It consists of 30 items rated on a 2-point scale (0 = no, 1 = yes; Yesavage et al., 1982–1983). Ten items with positive descriptions (Items 1, 5, 7, 9, 15, 19, 21, 27, 29, and 30) must be reverse scored. The total score ranges from 0 to 30, with higher scores indicating more serious depression. A score from 1 to 10 is considered indicative of normal functioning, with scores ≥11 indicating possible depression (Brink et al., 1982).
The BI includes 10 items that assess basic ADLs. Six of the items are rated on a 3-point scale (0–2), and the other items are rated on a 2-point (0–1) or 4-point (0–3) scale. The total score ranges from 0 to 20, with a higher score indicating a better degree of function in ADLs. The BI’s total score can be classified into two disability levels: (1) disability (≤18) and (2) without disability (19–20; Hsieh et al., 2007). Disability is defined as severe restriction in activity (Granger, 1985). The BI has shown good internal consistency, test–retest reliability, convergent validity, predictive validity, and responsiveness in patients with stroke (Hsueh et al., 2001).
Data Analysis
Reliability
We used Cronbach’s α to examine internal consistency. The criteria of coefficient α were >.90 for individual comparisons and >.70 for group comparisons (Aaronson et al., 2002). Intraclass correlation coefficients (ICCs) with a random effects model were applied to examine test–retest reliability. The standards of test–retest reliability were ≥.80 for measures used in research settings and ≥.90 for measures used in clinical settings (Nunnally & Bernstein, 1994). The random measurement error through the standard error of measurement (SEM) was calculated as the standard deviation of the first assessment
Validity
We examined discriminative validity using an independent-samples t test (α = .05) to compare the two groups of patients (with disability [BI ≤18] and without disability [BI ≥19]). Concurrent validity was evaluated using Pearson’s r to calculate correlations between the three measures. The criteria of concurrent validity were as follows: r < .40 = low correlation, .40 ≤ r < .75 = moderate correlation, and r ≥ .75 = high correlation (Salter et al., 2005).
Results
A convenience sample of 59 outpatients with stroke completed all three measures. In total, 39.0% of the participants had a BI score ≤18. Table 1 shows the patients’ demographic information.
Participant Demographic Information
Note. N = 59.
Some data are missing.
Reliability
Table 2 shows the results of internal consistency and test–retest reliability for the three depression measures in patients with stroke. For both the BDI–II and GDS, Cronbach's α was .92; for the CES–D, it was .85. For the GDS, the ICC was >.90; for the CES–D and BDI–II, it was .86 and .84, respectively. The MDC values of the CES–D, BDI–II, and GDS were 10.6, 13.5, and 5.8, respectively, and the MDC% of the three measures ranged from 49.9% to 98.3%. The Bland–Altman plots of the three depression measures are presented in Figure 1. The limits of agreement ranged from –11.74 to 11.44 for the CES–D, from –14.70 to 10.23 for the BDI–II, and from –6.31 to 6.04 for the GDS.
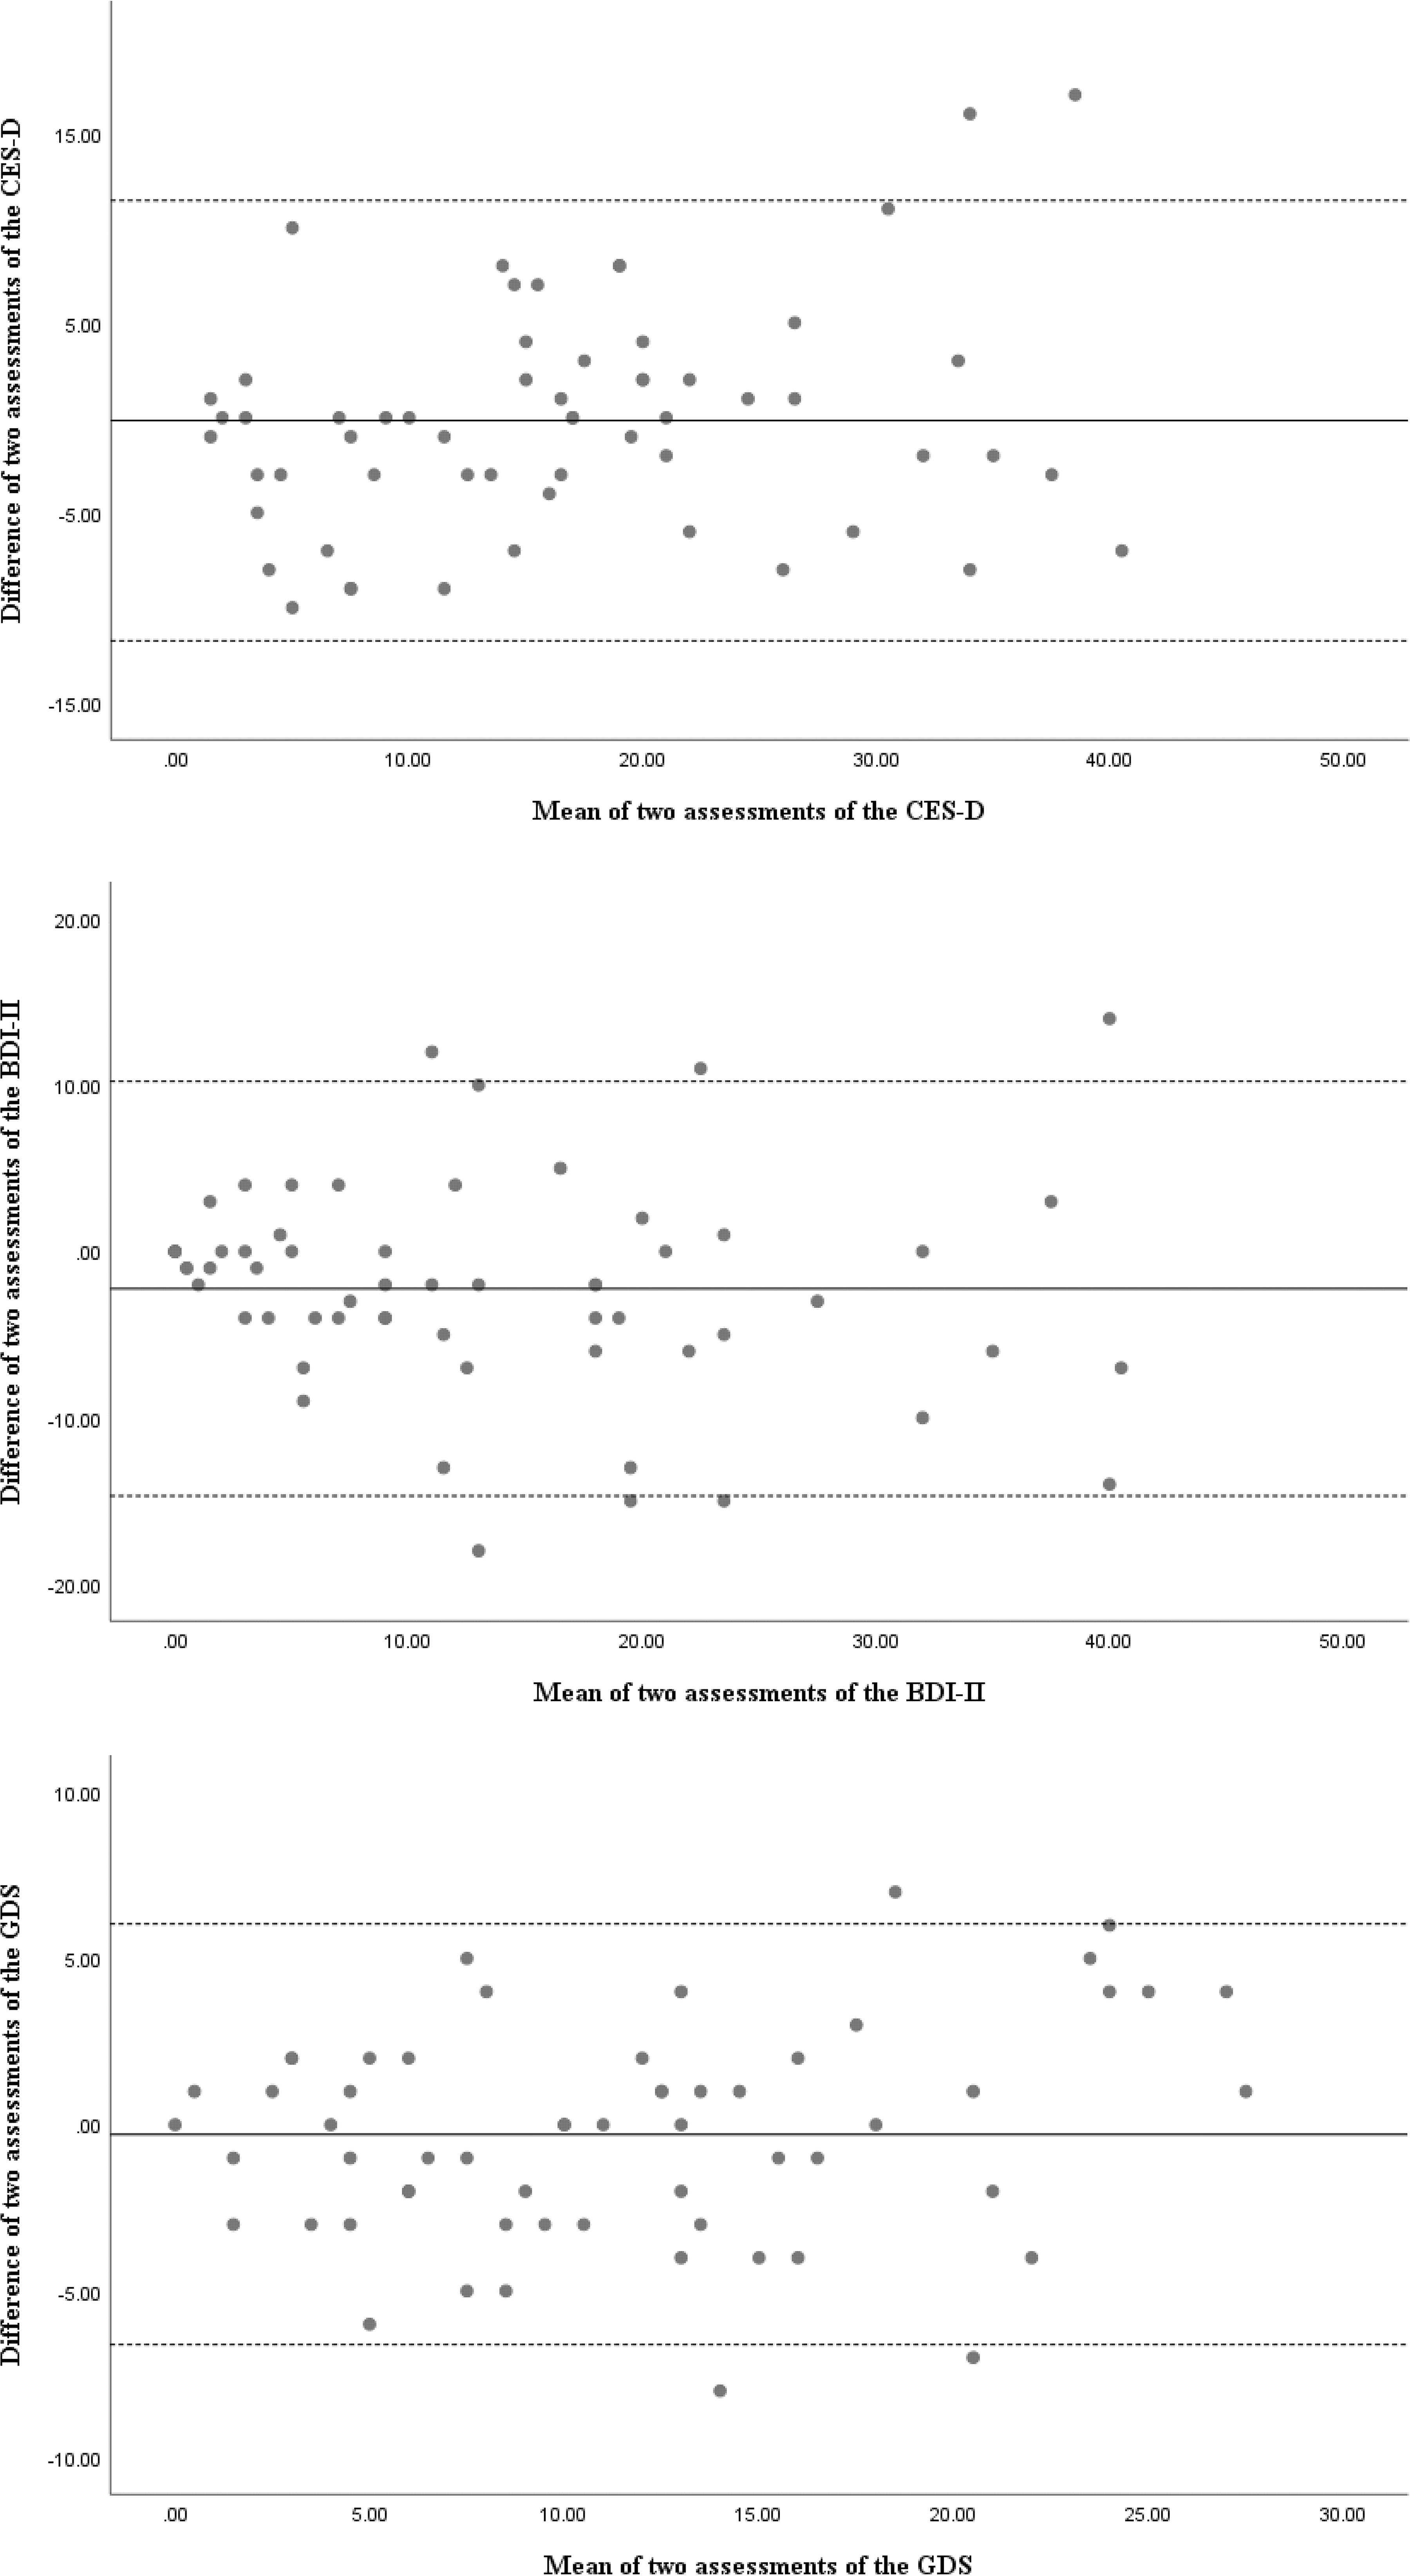
Bland–Altman plots.
Reliability and Validity of the Three Depression Measures
Note. Dashes indicate that data are not applicable. The degree of freedom for t is 58. BDI–II = Beck Depression Inventory–II; CES–D = Center for Epidemiologic Studies Depression Scale; CI = confidence interval; GDS = Geriatric Depression Scale; ICC = intraclass correlation coefficient; MDC = minimal detectable change; SEM = standard error of measurement.
p < .05.
Validity
The results of the t test showed a statistically significant difference in CES–D scores (p = .032) between the two groups (see Table 2). There were no significant differences in the t-test results for the other two measures (p = .095–.187). High correlations were observed among the three measures (r = .79–.89; see Table 2).
Discussion
This is the first study to simultaneously compare the psychometric properties of the CES–D, BDI–II, and GDS in a single sample of patients with stroke to evaluate how appropriate the three depression measures are for use in clinical and research settings. The findings provide empirical evidence for users to assess depression status in patients with stroke.
A reliable measure can produce consistent, precise, and stable results over time (Hobart et al., 1996). The CES–D, BDI–II, and GDS showed good internal consistency and test–retest reliability. Cronbach’s α for the BDI–II and GDS was >.90, which demonstrates that these two measures can be used not only in group comparison studies but also to follow individual scores. The GDS had the highest ICC value (>.90) and the lowest MDC%, indicating that it has the smallest random measurement error and best explains individual repeated results in clinical settings. These results showing that the GDS has sufficient internal consistency and test–retrest reliability are in accordance with those of a previous study on patients with stroke (α = .89 and r = .75, respectively; Sivrioglu et al., 2009). Our results suggest that all three measures, especially the GDS, are reliable for monitoring score changes in patients with stroke.
The MDC values, which can be applied as a threshold to ascertain whether an individual stroke patient’s score change indicates a real change (improvement or deterioration), were noted. We observed high MDC% of the three measures, demonstrating substantial random measurement error. The MDC% was estimated using the MDC value with a more robust confidence level (i.e., 95%). Patients with stroke may not attain a score change with 95% certainty on the three depression measures. The MDC values with 90%/80% confidence levels of the CES–D, BDI–II, and GDS were 8.9/6.9, 11.3/8.8, and 4.9/3.8, respectively. Clinicians and researchers can use MDC values with different confidence levels to explain the test results of the three depression measures.
The t-test results revealed that only the CES–D could distinguish between patients with stroke who did and did not have disabilities. The other two measures may not be useful in distinguishing patients with stroke who have different levels of disability. Thus, the CES–D has greater discriminative validity for patients with stroke. Regarding concurrent validity, our findings show high correlations among the three depression measures, which indicates that they assess similar depression-related concepts. Our findings also support the fact that these measures have good concurrent validity in patients with stroke.
This study has four limitations. First, we selected a convenience sample from one hospital in southern Taiwan and patients with a long onset time since their stroke, thus limiting the generalization of our findings. Second, we did not examine the minimal important difference, which considers whether the score changes after treatment are meaningful to patients from their perspective. Additional studies are warranted to compare the minimal important difference among these three depression measures in patients with stroke. Third, because of the small sample size we did not examine and compare construct validity using exploratory factor analysis, confirmatory factor analysis, or Rasch analysis. Future studies with large sample sizes are necessary to validate and compare the construct validity of these three depression measures for patients with stroke. Fourth and last, there was a testing effect from having the patients answer many questions on the three different measures at once, including tiredness and carelessness in filling out the measures.
Implications for Occupational Therapy Practice and Research
The results of this study have the following implications for occupational therapy practice and research: The GDS has better internal consistency and test–retest reliability for monitoring depression status in patients with stroke. The MDC values for the three depression measures can be useful when interpreting score changes in an individual patient with stroke.
Conclusion
The CES–D, BDI–II, and GDS showed sound internal consistency, test–retest reliability, and concurrent validity in patients with stroke. Among these three depression measures, the CES–D had better discriminative validity in distinguishing different levels of disability in patients with stroke. The GDS showed the best reliability; therefore, we recommend it to clinicians who are following the depression status of patients with stroke.