





Abstract
Evidence supports the utility of the touchscreen DriveSafe DriveAware (DSDA) for occupational therapists to use in conjunction with other clinical indicators to determine accurately whether drivers require further assessment.
Occupational therapists frequently provide advice regarding fitness to drive (Dickerson, 2013, 2014; Korner-Bitensky et al., 2007). This includes advising medical teams regarding which clients require further testing, advising clients and family regarding community mobility options, and providing support for driving cessation (Dickerson, 2013, 2014; Korner-Bitensky et al., 2007). Occupational therapists must screen clients for fitness to drive appropriately (Dickerson, 2013; Dickerson & Bédard, 2014; Dickerson et al., 2014). Therefore, they require valid tools that provide reliable data without subjecting clients to extensive and questionable cognitive testing (Dickerson, 2013; Vrkljan et al., 2011).
For many years, researchers have examined clinical tests to identify one that accurately predicts driving performance. Researchers (Asimakopulos et al., 2012; Bédard et al., 2008; Molnar et al., 2006) have advised that suitable fitness-to-drive screens must have evidence-based cutoff scores with sensitivity, specificity, and positive and negative predictive values (PPV and NPV, respectively) above 80% and two cutoff scores for trichotomizing drivers into “likely to pass,” “likely to fail,” and “further testing” (Laycock, 2011; Molnar et al., 2006), with a small percentage of drivers (10%–20%) classified as “further testing” (Bédard et al., 2008). The screen must be sufficiently predictive to avoid misclassifications (Bédard et al., 2008), particularly minimizing the portion of unsafe drivers who are classified as safe. In addition, the tests should reflect real-world driving so clients feel that they have been assessed fairly and, therefore, are likely to accept the results (Dalchow et al., 2010).
No fitness-to-drive screen has been identified that meets these criteria: Short, simple tests (e.g., the Comprehensive Trail Making Test; Reynolds, 2002) do not have the discriminative power to screen drivers (Kay et al., 2008), and longer tests approaching acceptable predictive validity (e.g., the Sensory-Motor and Cognitive Tests; Innes et al., 2007) often have lengthy administration times, require specialized training and equipment, or lack face validity (Dalchow et al., 2010; Dickerson et al., 2014; Fildes, 2008; Molnar et al., 2006). Many driver screening tools assess discrete component cognitive or visual processing skills but have limited capacity to predict performance in complex, dynamic tasks such as driving (Dickerson et al., 2014; Kay et al., 2009a). Occupational therapists at the University of Sydney developed an assessment of global awareness of the driving environment more than 30 yr ago that is conceptually different from other tests; the desktop (original) DriveSafe DriveAware (DSDA; Kay et al., 2009a) and its precursor, the Visual Recognition Slide Test (Kay et al., 2008), do not deconstruct driving performance into component skills (Kay et al., 2008, 2009a).
The original DSDA is a cognitive fitness-to-drive screen that trichotomizes participants by means of two evidence-based cutoff scores based on the likelihood of passing an on-road assessment (Kay et al., 2009a). Previous research provides evidence of its construct validity, internal reliability (Hines & Bundy, 2014; Kay et al., 2008, 2009a, 2009b), and test–retest reliability (O’Donnell et al., 2018). The original DSDA identifies safe drivers with a sensitivity of 91% to 93%, identifies unsafe drivers with a specificity of 96%, and correctly classifies 90% of drivers (Hines & Bundy, 2014; Kay et al., 2009a). Considering the design criteria described (Asimakopulos et al., 2012; Bédard et al., 2008; Dalchow et al., 2010; Molnar et al., 2006), we converted the original DSDA into a brief (10-min) touchscreen tool for occupational therapists and other health professionals.
The purpose of this study was to examine the construct validity, internal reliability, and predictive validity of the data gathered with the touchscreen DSDA. The criterion measure was Performance Analysis of Driving Ability (P-Drive; Patomella et al., 2010), a standardized on-road assessment of driving ability.
Method
This prospective study took place in 10 driving clinics in Australia and New Zealand. The University of Sydney Human Research Ethics Committee (Project Number 2012/2812) provided approval for this study. St. Vincent’s Hospital Sydney Human Research Ethics Committee (Project Number HREC/13/SVH/294) provided ethics approval for the hospital sites.
Participants
The final sample consisted of 134 participants ages 18 yr and older (M age = 68 yr, SD = 16.9) who had been referred to determine the impact of a medical condition on fitness to drive. We consecutively included participants who met these inclusion criteria: a valid driver’s license, vision within license-authority guidelines, completion of at least 1 yr of high school, and English as a first language. We excluded participants who had a developmental delay, psychiatric illness, or aphasia. We included participants younger than 65 yr if they had a medical condition that could potentially affect their cognitive capacity for driving. We included participants ages 65 yr and older with any diagnosis because of the increased possibility of cognitive impairment and community concern regarding the cognitive fitness-to-drive of older drivers. Of the 142 individuals who initially agreed to participate, 1 withdrew after failing the on-road assessment, 5 did not meet inclusion criteria, and 2 did not complete the on-road assessment. Six participants (n = 4 women; M age = 69 yr) declined to participate.
The final sample (94 men, 40 women) had the following diagnoses: stroke or transient ischemic attack (TIA; n = 42; 31%), dementia or memory loss (n = 38; 29%), traumatic brain injury (TBI; n = 15; 11%), other neurological conditions (n = 13; 10%), unsafe driving report and no diagnosis (n = 9; 7%), Parkinson’s disease (n = 7; 5%), physical deficits and age 65 yr or older (n = 7; 5%), and general medical conditions (n = 3; 2%). The Mini-Mental State Examination–2: Standard Version (MMSE–2:SV) 1 sample mean was 26.64/30, with the following result for each diagnostic group: stroke or TIA, M = 27.14, SD = 2.62; dementia or memory loss, M = 22.84, SD = 4.56; TBI, M = 28.66, SD = 1.72; other neurological conditions, M = 27.09, SD = 2.47; unsafe driving report and no diagnosis, M = 25.38, SD = 5.26; Parkinson’s disease, M = 28, SD = 1.63; physical deficits and age 65 yr or older, M = 28, SD = 1.15; and general medical conditions, M = 26.00, SD =1.73.
Instruments
We used two standardized assessments: the touchscreen DSDA (Cheal & Kuang, 2015) and P-Drive (Patomella et al., 2010).
Touchscreen DSDA
The touchscreen DSDA consists of two subtests: DriveSafe and DriveAware. Scores on DriveSafe separate drivers into preliminary “safe,” “unsafe,” and “further testing” categories. DriveAware scores are then applied to generate a final trichotomy based on the likelihood of passing an on-road assessment: “likely to pass,” “requires further testing,” and “likely to fail.”
Touchscreen DriveSafe
The touchscreen DriveSafe measures awareness of the driving environment by means of visual search and assumes that attention is critical to safe driving (Kay et al., 2009a, 2009b). DriveSafe consists of 10 images of a four-way intersection. Each image includes two to four potential hazards (i.e., people or vehicles located in a particular place and moving a particular direction). Hazards are presented for 4 s and then disappear, leaving only the intersection. Participants recall information about the hazards by touching the blank intersection to identify (1) each object from an array, (2) the location, and (3) the direction of movement. The examinee identifies 28 objects (items). Each piece of correctly identified information yields 1 point; the maximum score is 84, 28 points for each object category (i.e., type, location, and direction). The touchscreen DriveSafe is self-administered using an iPad with written and audio instructions.
Touchscreen DriveAware
The touchscreen DriveAware measures awareness of one’s own driving abilities (Kay et al., 2009b). It is a supplement to the DriveSafe to increase predictive accuracy (Kay et al., 2008). DriveAware consists of seven questions: two self-administered and five practitioner-administered. Each yields a discrepancy score (i.e., difference between examinees’ self-rating and practitioners’ ratings or actual performance on DriveSafe). The total maximum score is 17.
P-Drive
P-Drive is a standardized observational assessment of on-road driving. Twenty-five items comprise four categories: maneuvers, orients, follows regulations, and attends and acts (Patomella et al., 2010). Items are scored on a 4-point criterion-referenced rating scale (4 = competent). A score of 1 on any item is interpreted as unsafe driving. Examiners’ scores are based on the least competent behavior observed for each item. P-Drive allows route variation across participants, because scoring is based on observed behaviors. The third author (Ann-Helen Patomella) adjusted P-Drive for this study because of differences between road laws in Australia and New Zealand and those in Sweden. Summed scores yield a raw score out of 100. Cutoff scores of both 81 (Selander et al., 2011) and 85 (Patomella & Bundy, 2015) have been proposed in two Scandinavian studies; however, no cutoff scores were set for Australia and New Zealand at the time of this study. Although cutoff scores informed the decisions made, final determinations also considered examiner judgment using the following pass–fail criteria applied in previous DSDA research: pass (i.e., safe and legal driving without intervention), conditional pass (i.e., safe and legal driving with restrictions), intervention (i.e., lessons required), and fail (i.e., failure to meet safe and legal driving criteria). Data for the pass and conditional pass groups were collapsed for analysis because both groups had achieved the criterion for safe driving.
Procedures
Sixty percent of the participants (n = 81) were assessed in Australia. Occupational therapy driving examiners (n = 16) conducted the assessments. The first three authors (Beth Cheal, Anita Bundy, and Ann-Helen Patomella) trained examiners in two 1-hr interactive webinars, testing for consistency in P-Drive scoring. Examiners designed driving routes using compulsory route inclusions recommended by researchers (Di Stefano & Macdonald, 2010; Patomella & Bundy, 2015) and in consultation with driving instructors (n = 21) who rated the challenge level for each route for comparison across centers. The first author (Cheal) reviewed all data to ensure that participants met the study criteria and assessments were conducted according to protocols.
Examiners administered the touchscreen DSDA, the MMSE–2:SV, and vision and physical function screenings off road. After the off-road assessment, participants completed the 60-min on-road assessment in a dual-controlled vehicle; participants and examiners were blinded to DSDA results. A driving instructor seated in front provided route instructions and monitored safety. The occupational therapist examiner, seated in the rear, recorded driving performance and scored the P-Drive at the conclusion of the on-road assessment.
Data Analysis
We used the partial credit Rasch model (Winsteps Version 3.72.2; Linacre, 2014) to examine evidence for construct validity and internal reliability. Winsteps converts raw scores to interval scores (measures) expressed as log-odds probability units (logits) and generates a single hierarchy describing item difficulty and participant ability. Our analyses followed an iterative process, with results from each phase informing the next. This allowed us to create the most parsimonious item set and ensure that each item contributed to the unidimensional construct represented by the subtest. We examined the following sources of evidence for both subtests (Bond et al., 2020).
We calculated point-measure correlations and ensured that each was positive (i.e., the item was part of the construct). For each item, Winsteps generated two pairs of goodness-of-fit statistics expressed as mean square (MnSq) and standardized values (ZStd). Goodness-of-fit statistics revealed how well data conformed to Rasch model assumptions: (1) Participants who are more able have a greater likelihood of passing difficult items and (2) easy items are easy for all people. We considered removing items with both MnSq and ZStd values outside acceptable ranges (i.e., MnSq between 0.5 and 1.7 and ZStd between −2 and 2; Bond et al., 2020; Linacre, 2022; Wright & Linacre, 1994).
To ensure a match of test items with participant ability, we compared the spread of item difficulty and range of participant ability. We examined areas along the hierarchy where more than one item was at the same difficulty level, suggesting redundancy. We identified gaps along the hierarchy indicating participants whose abilities were not measured precisely.
We examined the results of a principal-components analysis (PCA) of Rasch model residuals provided by Winsteps to identify any unexpected patterns among groups of items indicating that multiple dimensions are distorting measurement. A unidimensional measure is desirable to confirm that differences are being captured in the construct being examined. We checked that the proportion of empirical variance explained by the measures closely matched the Rasch-predicted model variance in the first factor and that the percentage of explained variance was much greater than the percentage of unexplained variance; the desired eigenvalue of the first contrast was <3 (Linacre, 2003, 2014). We also completed a differential item function analysis (DIF) to check that women and men did not differ systematically on items (i.e., ts < 1.96).
To test for internal reliability, we examined Winsteps-generated person reliability indices (Cronbach’s α equivalent) and number of strata. Strata indicate how reliably the test identifies statistically distinguishable groups (Fisher, 2007) and are calculated using the Winsteps-generated separation index (G); number of strata (H) = [(4 × G) + 1]/3. We sought person reliability indices ≥.80 (Fisher, 2007) and H values ≥2.0.
We examined the evidence for predictive validity by establishing optimal lower and upper cutoff scores for each subtest using receiver operating characteristic (ROC) curves. Lower cutoff scores maximized the identification of unsafe drivers while minimizing misidentification of safe drivers (i.e., sensitivity and PPV). Upper cutoff scores maximized the identification of safe drivers while minimizing misclassification of unsafe drivers (i.e., specificity and NPV). Data from participants categorized as “requiring further testing” (n = 20) were excluded from this analysis, because the pass–fail category was indeterminate for these participants.
Results
We removed one item from DriveSafe before the first analysis because examiners reported technical difficulties with administration. Point-measure correlation coefficients were positive. All DriveSafe items had goodness-of-fit statistics within acceptable ranges (Table 1). Except for the most competent drivers, the ranges of item difficulty and participant ability were comparable. There were few gaps along the hierarchy (Figure 1).
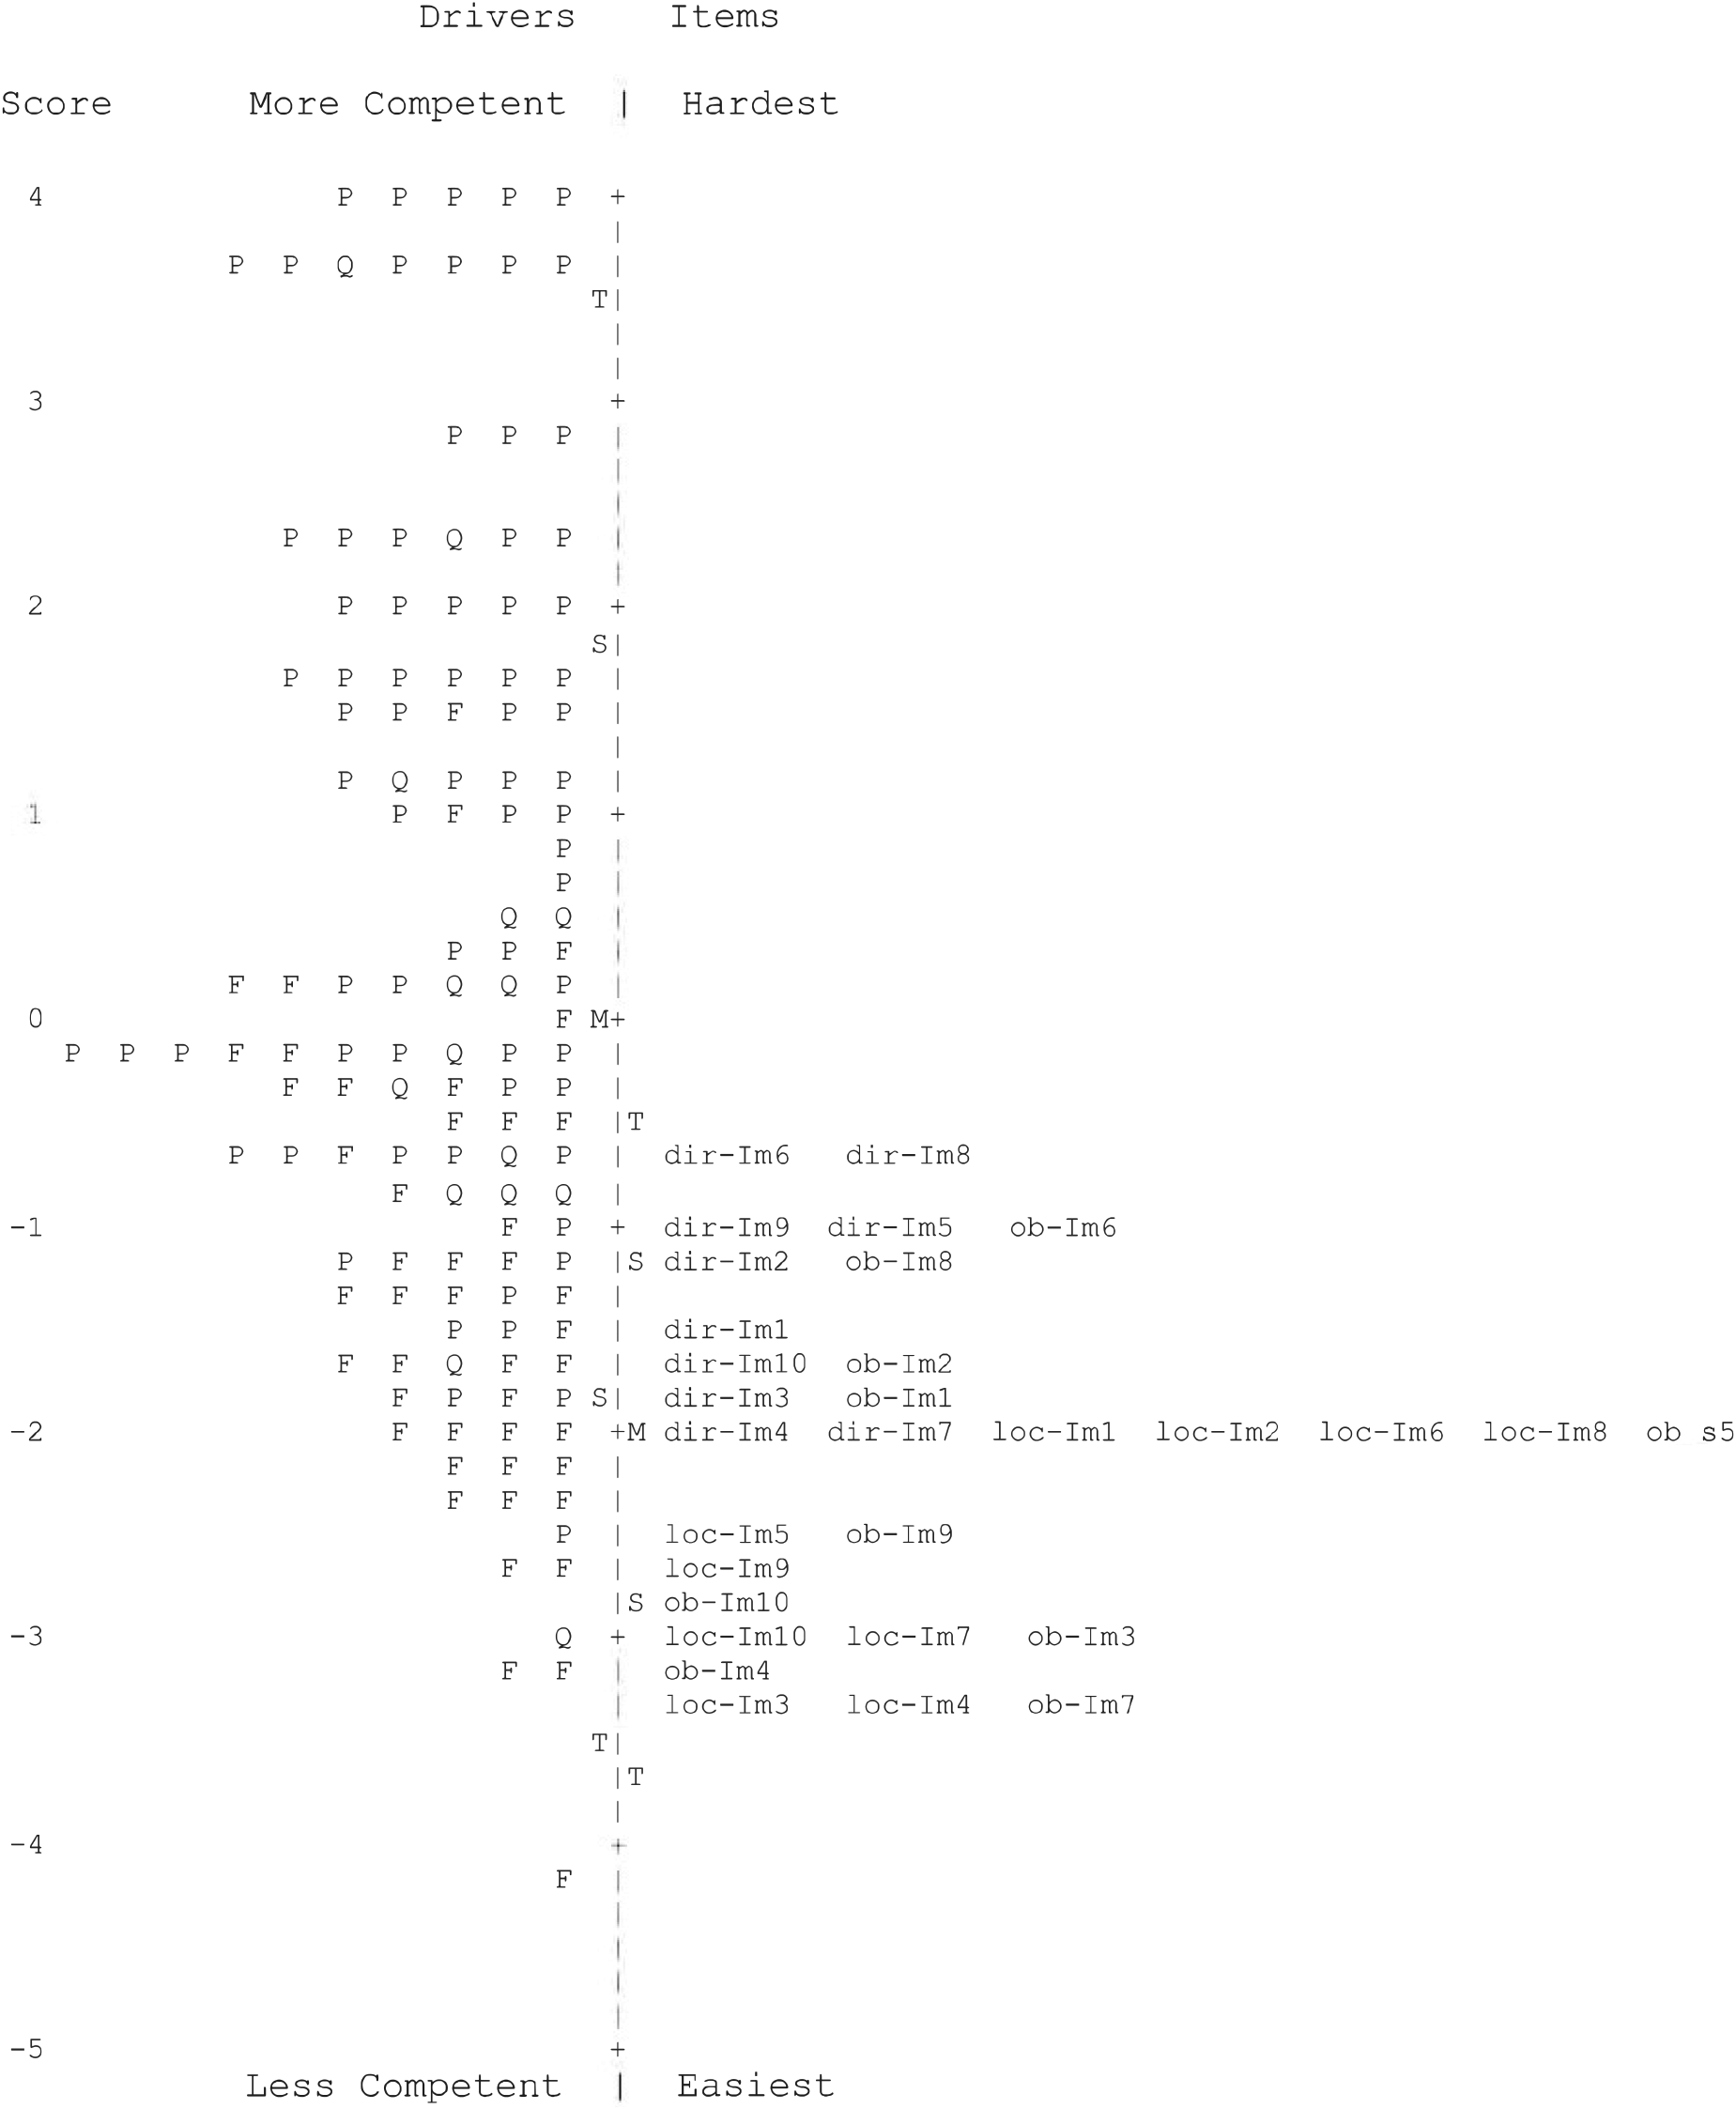
Map of driver ability and item difficulty for the touchscreen DriveSafe subtest.
Goodness-of-Fit Statistics, Item Measures, and Standard Errors for the Touchscreen DriveSafe and DriveAware Items
Note. DA = DriveAware; DS = DriveSafe; DSDA = DriveSafe DriveAware; infit = inlier-sensitive fit; IM = item measure; MnSq = mean square; outfit = outlier-sensitive fit; ZStd = standardized value.
Two cases were excluded from analysis; no data were recorded.
Fit statistics outside acceptable range.
DriveSafe separated participants into more than five strata (G = 3.76; H = 5.34), providing evidence that it is sensitive enough to distinguish multiple levels of awareness of the driving environment. A high reliability index (.93) provided evidence for the replicability of person placement along the hierarchy. The PCA yielded an empirical variance (55.1%) that closely matched the modeled variance (56.4%). The percentage of variance unexplained in the first contrast was 4.6% (eigenvalue = 3.1), slightly more than desired (i.e., eigenvalue < 3) but much less than the variance explained by items (14.8%; eigenvalue = 9.9) and persons (40.4%; eigenvalue = 27.0). DIF analysis revealed no significant difference between men and women on any item.
DriveAware point-measure correlations were positive, ranging from .64 to .82 (M = .70), indicating that all items are part of the construct. All items except Item 5 had fit statistics within acceptable ranges (see Table 1). The hierarchy of DriveAware items indicated that awareness of performance on the test was easier than awareness of the reason for being tested; awareness of reduced driving performance was the most difficult (Figure 2). The map revealed gaps where there were people but no items.
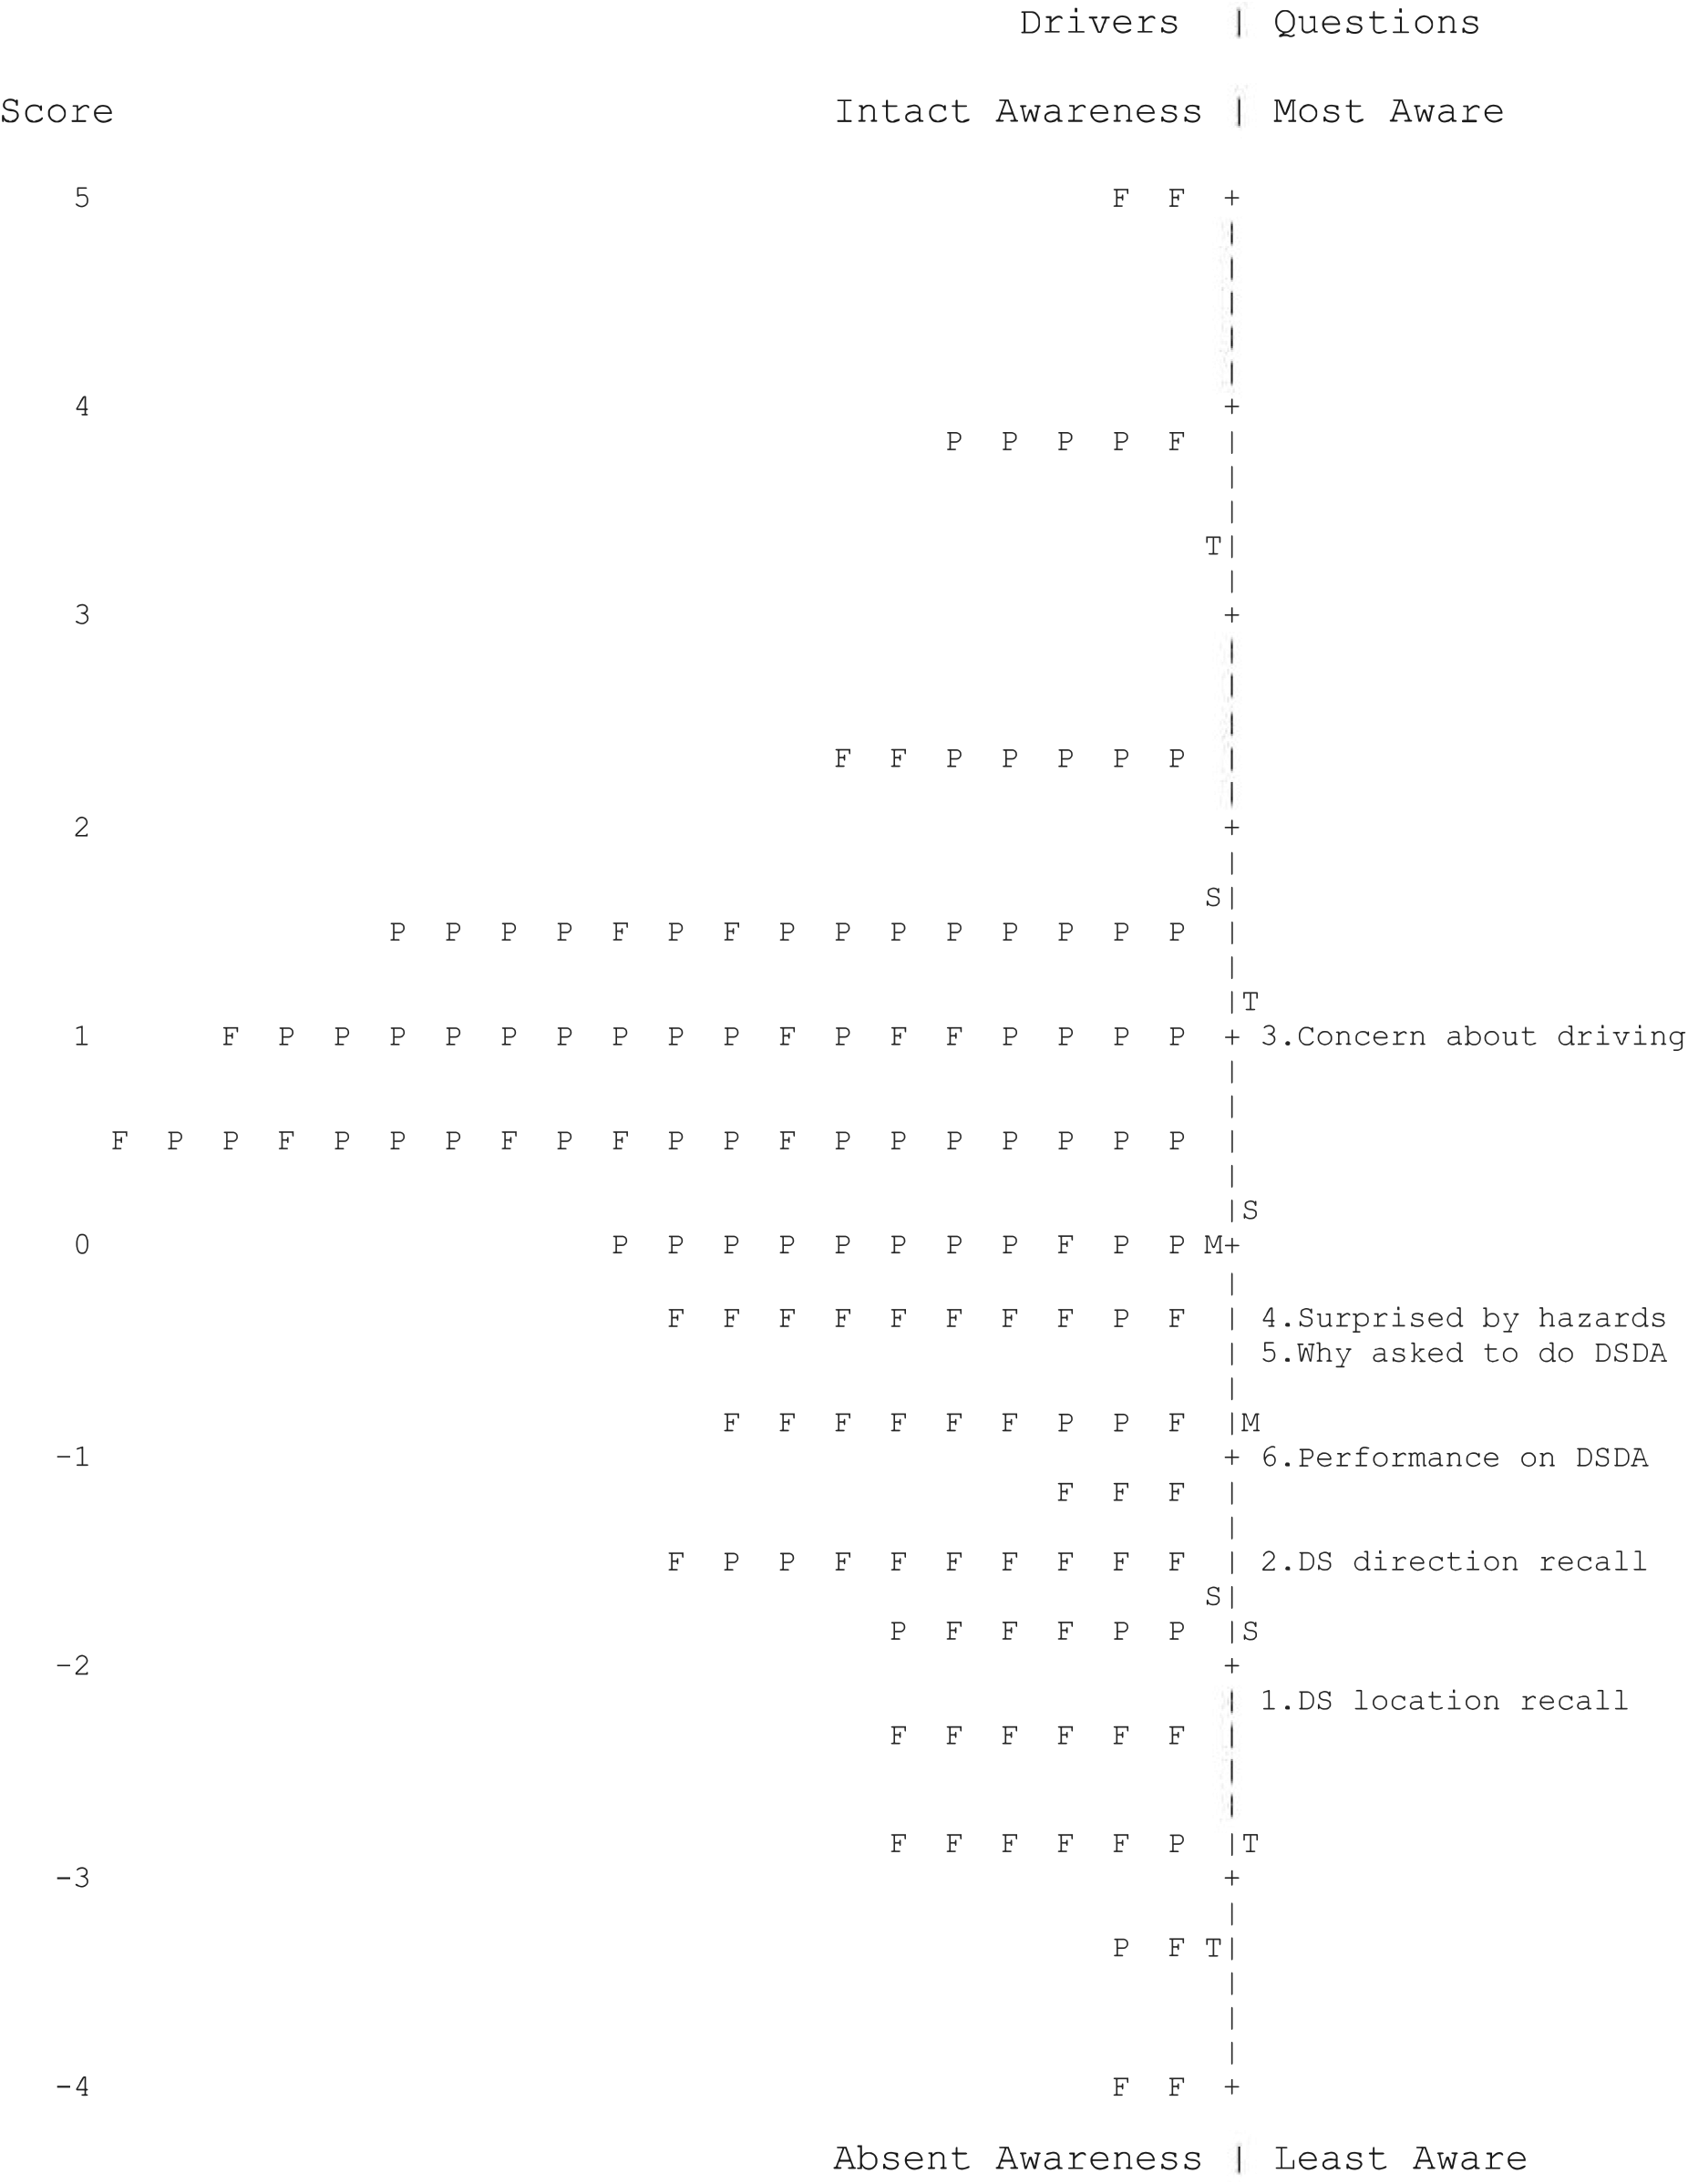
Map of driver ability and item difficulty for the touchscreen DriveAware Subtest.
The person reliability index (.80) was acceptable. A separation index of 1.98 revealed about three strata (H = 2.95). The PCA yielded a modeled variance (59.3%) closely matching the empirical variance (59.4%). The percentage of variance unexplained in the first contrast was 11.4% (eigenvalue = 1.6), within the acceptable range and less than the percentage of variance explained by items (16.1%; eigenvalue = 2.2) and persons (46.3%; eigenvalue = 6.1). DIF analysis revealed that women’s scores were significantly more discrepant than men’s scores (t = −3.35) on Item 1 (“How well did you remember the location of people and vehicles?”).
The purpose of the predictive validity analysis was to determine how accurately the cutoff scores work for predicting drivers deemed to pass and fail the road test. Thus, data from participants categorized as “requiring further testing” (n = 20) were excluded from this analysis because the pass–fail category was indeterminate for these participants. ROC curves revealed optimal upper and lower cutoff scores of, respectively, 57 and 72 for DriveSafe and 10 and 13 for DriveAware. The lower cutoff scores revealed a sensitivity of 91% (95% confidence interval [CI] [84, 96]) and 89% (95% CI [82, 97]) for DriveSafe and DriveAware, respectively. Upper cutoff scores revealed a specificity of 94% (95% CI [87, 99]) and 91% (95% CI [84, 99]) for DriveSafe and DriveAware, respectively. Overall, accuracy of classification was 88%: 39 true positives, 4 false positives, 49 true negatives, and 8 false negatives (Table 2). Of the 112 validity sample cases, 47.3% passed the driving assessment, 42.0% failed, and 10.7% required further testing or intervention.
Descriptive Statistics for Touchscreen DriveSafe and DriveAware Lower and Upper Cutoff Scores
Note. NPV = negative predictive value; PPV = positive predictive value.
Discussion
The purpose of this study was to examine the psychometric properties of data gathered with the touchscreen DSDA. Evidence from the analysis indicated that touchscreen DSDA data retained the strong psychometric qualities of the original DSDA (Hines & Bundy, 2014; Kay et al., 2008, 2009a, 2009b), with acceptable evidence for internal reliability and construct validity.
The touchscreen DSDA met the criteria set by researchers for a useful driver screen. Researchers (Asimakopulos et al., 2012; Bédard et al., 2008; Kay et al., 2009a; Molnar et al., 2006) agree that the statistics that are most valuable to practitioners selecting assessment tools are sensitivity, specificity, PPV, and NPV; these statistics should be ≥80% (Asimakopulos et al., 2012), which was achieved by the touchscreen DSDA. Eight participants passed the DSDA but failed the on-road assessment (false negatives); we could discern no distinguishing characteristics. Nonetheless, occupational therapists should use professional judgment and other clinical indicators in addition to the touchscreen DSDA to support fitness-to-drive determinations. Further supporting its clinical utility, the touchscreen DSDA has two cutoff scores for trichotomizing drivers, reducing the problem of overlapping scores (Molnar et al., 2006); places only 11% of participants in the “further testing” category (Bédard et al., 2008); takes around 10 min to complete; and has high face validity (i.e., participants can perceive its relationship to driving).
The map of items and drivers indicates that DriveSafe most precisely differentiates less competent drivers. However, DriveSafe is designed to identify safe drivers; distinguishing excellent drivers is unnecessary. The hierarchy of items on the touchscreen DriveSafe indicates that participants found direction of movement the most difficult to recall and object type the easiest for most items, consistent with previous research. The hierarchy of items on the touchscreen DriveAware also was consistent with previous iterations of DriveAware (Kay et al., 2009a, 2009b). The DriveAware map revealed gaps where no items measured the least aware or most aware participants. However, the purpose of DriveAware is to provide additional information for categorizing participants when DriveSafe results are borderline; the test is not used alone.
DriveAware Item 5 (“Why have you been asked to complete DriveSafe DriveAware?”) had fit statistics outside the acceptable range, indicating some erratic responses. Nonetheless, we retained Item 5 because of its contribution to judging participant insight. DIF analysis revealed that, compared with men, women tended to underestimate their performance on Item 1 (“How well did you remember the location of people and vehicles?”). Studies that examine gender differences in self-rated driving performance have consistently shown that women express less confidence in their performance than men (Ackerman et al., 2011; D’Ambrosio et al., 2008; Morgan et al., 2009). Health professionals should be mindful of gender differences when interpreting DriveAware results.
Limitations and Future Research
P-Drive allows consistent scoring over variable routes; nonetheless, conditions likely varied somewhat. Relatively small numbers in participant groups precluded systematic examination of differences by diagnostic group. However, the results of the PCA indicated no evidence that diagnoses separated groups. Further research confirming the cutoff scores for specific diagnostic groups is needed (e.g., for drivers with dementia or after a stroke).
Implication for Occupational Therapy Practice
The findings of this study have the following implication for occupational therapy practice: ▪ The touchscreen DSDA is a brief, practical, and psychometrically sound screen of cognitive fitness to drive that occupational therapists and other health professionals can use to predict on-road performance for medically at-risk drivers.
Conclusions
The touchscreen DSDA is sufficiently predictive to be used as a first-level screen of cognitive fitness to drive; furthermore, it produces psychometrically sound data. Only clients with inconclusive results require referral for further testing. Clients who are identified as likely to be safe can avoid unnecessary testing, and clients who are identified as likely to be unsafe can be advised to discontinue driving.
Footnotes
Acknowledgments
This research study was based on dissertation work completed at the University of Sydney by Beth Cheal as part of the requirements for a doctor of philosophy degree. Portions of this article have been published online as part of this completed dissertation.
1The MMSE-2:SV is a 30-point standardized assessment of cognitive status that is interchangeable with the Mini-Mental State Examination (Folstein et al., 2010).