





Abstract
The Turkish version of the Revised Low Vision Independence Measure (LVIM–R) is a valid and reliable assessment tool for occupational therapy practice in low vision rehabilitation.
Low vision causes limitations in people’s ability to perform vision-dependent tasks in daily life. According to the World Health Organization (2006), low vision is defined as visual acuity (VA) of less than 0.30 (6/18, 0.5 logarithm of the minimum angle of resolution [logMAR]) to equal to or better than 0.05 (3/60, 1.3 logMAR) or a corresponding visual field loss to less than 20° in the better eye with best possible correction. Low vision is a broad term that encompasses a variety of conditions. Some people have decreased VA, whereas others have visual field loss, issues with contrast sensitivity, or color vision and night vision anomalies, alone or in combination. Inconveniences and challenges in daily life are extremely diverse in this multidimensional population. For example, some people need dark glasses, whereas others benefit from increased lighting.
Occupational therapy practitioners require an understanding of the variety of physical conditions and needs experienced by people with low vision to provide successful rehabilitation that eliminates challenges or minimizes their effects (Colenbrander & Fletcher, 1995). In low vision rehabilitation, occupational therapy practitioners help patients improve their performance of activities of daily living (ADLs) and instrumental activities of daily living (IADLs; Cimarolli et al., 2012; Haymes et al., 2002).
Development of an effective intervention plan requires reliable and valid assessment of a patient’s activity performance. Occupational therapy practitioners use a person-centered approach to evaluation and intervention in which patients report from their own perspective the problems they experience in performing activities (Smith et al., 2019). Margolis et al. (2002) underlined the necessity of patient reporting and the importance of valid and reliable tools to measure vision-related activity performance.
Although available measures of activity performance for people with low vision typically are designed to assess patients’ perceptions of their quality of life, few scales directly measure their activity performance. Smith (2013) developed the Low Vision Independence Measure (LVIM), which assesses the activity performance of people with limited vision, to address this requirement. The LVIM is a self-report measure designed to track patients’ progress in low vision rehabilitation programs aimed at improving occupational performance and increasing participation in vision-dependent ADLs and IADLs. The LVIM is guided by the Occupational Therapy Practice Framework: Domain and Process (OTPF–4; American Occupational Therapy Association [AOTA], 2020) and contains 52 questions from eight areas of occupation in the OTPF–4 (Smith, 2013). Smith et al. (2020) revised the LVIM to include 46 questions, and the LVIM–R was determined to be valid and reliable. The aim of the current study was to evaluate the validity and reliability of the Turkish version of the LVIM–R for people with low vision.
Method
Participants
We recruited people with low vision from among patients who applied to an ophthalmology training and research clinic where one of the authors (Bayazıt İlhan) worked. After an ophthalmic examination, patients who met the criteria for low vision were asked to participate in the study. Inclusion criteria were age ≥18 yr, VA between 0.5 and 1.3 logMAR, and consent to participate in the study. Patients who had a neurological or mental disorder causing cognitive dysfunction were excluded. The first author (Esma Özkan) collected data in 25 to 30 visits to the clinic during the 15-mo period between April 2020 and July 2021.
Before the study began, all participants read and signed an informed consent form, which was witnessed throughout the procedure. While the researcher (Esma Özkan) was interviewing the participants, a nurse from the clinic was present in the evaluation room as a volunteer interview witness. The research was approved by the Non-Invasive Research Ethics Committee of the University of Health Sciences Turkey (No. 2020–128). Esma Özkan read the Turkish LVIM–R items to participants who were unable to read because of visual impairment.
Instrument
The LVIM–R is a patient-report questionnaire in which patients assign difficulty ratings to vision-dependent ADL and IADL tasks. The LVIM–R has 46 items in eight subscales: Self Care, Food Preparation, Home Management, Communication, Financial Management, Leisure, Mobility, and Shopping. Patients rate the difficulty of each task using a 4-point Likert-type scale in which 1 = unable, 2 = very difficult, 3 = moderately difficult, and 4 = not difficult. Patients have the option to select not applicable; such responses are considered to be incomplete data, and the item and response are subtracted from the Total score and impairment level. Patients may complete the LVIM–R using any optical or nonoptical device. The LVIM–R takes approximately 15 min to administer (Smith et al., 2020). The participant’s Total score is the sum of all item responses in all subscales; the subscales do not need to be scored separately.
Translation Process
The Turkish LVIM–R was translated from English in accordance with Hambleton and Patsula’s (1999) recommendations for cross-cultural adaptation of a scale. Two physiotherapists who were native Turkish speakers and fluent in English and who understood the study aims independently translated the scale into Turkish. The second author (Bayazıt İlhan), an ophthalmologist, compared the two translations and resolved the differences, creating a draft of the Turkish version. The physiotherapists, who each had a PhD and worked in the rehabilitation field, reviewed the draft, which was presented in a structured document with the original and Turkish versions side by side. Their feedback was elicited to obtain expert opinions. Generally, experts gave their opinions on the expression of activities in the form commonly used in society. This feedback was evaluated, and a Turkish version was drafted by Esma Özkan and Bayazıt İlhan.
The draft translation was independently translated back into English by two native English speakers who were fluent in Turkish; both were unaware of the study goals and unfamiliar with the English version of the LVIM–R. The two back translations were similar in terms of language and meaning, demonstrating linguistic comparability between the original scale and the translated version. We evaluated the scale components for semantic (word meaning), idiomatic (idiom meaning), experiential (existence and meaning of experiences), and conceptual (using concepts in the same context) equivalence. We piloted the scale with Turkish people with low vision to ensure that the scale items were understandable. After the pilot research, minor adjustments were made to the Turkish version of the scale to reflect the suggestions of persons with low vision, and the final Turkish LVIM–R was finalized.
Visual Acuity
To compare patients with different levels of disease severity, we chose the VA criterion as a predictor of disease severity and grouped patients accordingly. In this study, visual acuity was defined as the VA in the better eye with best correction. Bayazıt İlhan evaluated VA during the examination and recorded letter scoring, a precise measurement of VA, in logMAR. LogMAR is a convenient scoring system with a constant .10 log unit of difference between each successive line in the scale. A value of .00 corresponds to minimum angle of resolution (MAR) = 1.0 (6/6, 20/200), and logMAR values go negative with better VA. When MAR = 10.0 (6/60, 20/200), logMAR = 1.00 (Bailey & Lovie-Kitchin, 2013).
Data Analysis
After required error checks and adjustments, data from the forms for collecting LVIM–R responses and sociodemographic information were uploaded to a computer. Numbers and percentages were calculated for categorical data, and means and standard deviations were calculated for continuous data.
Before the validity and reliability analysis, we investigated whether each item supported the structure by computing item–total correlations and change in Cronbach’s α of the dimensions if the item was deleted (Field, 2013). The relationship between the scale items was evaluated using Pearson correlation coefficients (Likert, 1932). The cutoff for the corrected item–total correlations was .30, as recommended by Nunnally and Bernstein (1994). Cronbach’s α was calculated for internal consistency reliability; according to Cortina (1993), however, Cronbach’s α should not be the only criterion used in the estimation of reliability because it cannot produce adequate and appropriate results in most conditions. Therefore, we also used Armor’s θ for overall reliability (Armor, 1974), McDonald’s ω for composite reliability (Lucke, 2005), and intraclass correlation coefficients (ICCs) for test–retest reliability (Kline, 1998). One of the authors (Esma Özkan) conducted the retest 2 wk later with the identical procedures. The .70 cutoff point suggested by Nunnally (1978) was used for Cronbach’s α.
The most important assumption for the parceling method is the unidimensionality of the items being combined (Marcoulides & Schumacker, 2001). We used principal-components analysis (PCA) and then confirmatory factor analysis (CFA) to evaluate the unidimensionality structure. Some items in the scale had floor and ceiling effects and deviated from the multivariate normal distribution, so item parceling techniques were used to avoid ill-fitting results from CFA (Kelloway, 2015). The suitability of the data structure for factor analysis was determined by the Kaiser–Meyer–Olkin (KMO) test and Bartlett’s test of sphericity (Pett et al., 2003). The cutoff point for factor loadings obtained from PCA was .32 (Tabachnick & Fidell, 2013). The suitability of the factor structure created by the item parceling method with the observation data was tested with CFA.
We used item parceling techniques in the CFA for two reasons (Smith et al., 2019). First, the sample size was small; the item ratio of the sample did not meet the requirement of at least 5 or at least 200 participants as specified by Kline (2016). The second reason is that the Likert-type scales yielded ordinal data, and their distribution (mostly because of floor and ceiling effects) did not fit the multivariate normal distribution most of the time; thus, CFA might have yielded ill-fitting results (Kelloway, 2015). Item parceling techniques and exploratory structural equation modeling methods have been proposed as a solution to this problem (Asparouhov & Muthén, 2009; Marsh et al., 2009). For these reasons, and because the number of items was high, we used the item parceling method (Bandalos, 2002; Bandalos & Finney, 2001; Nasser-Abu Alhija & Wisenbaker, 2006). In parceling, the sum or average of the items brought together is used.
The maximum likelihood method was used as the parameter estimation method. The fit of the measurement model to the data was evaluated with the significance of the factor loadings (if Student’s t test value was greater than 1.96), the comparative fit index (CFI) with χ2 and normed χ2 (χ2/df), the Tucker– Lewis Index (TLI), and the root mean square error of approximation (RMSEA; Brown, 2015). IBM SPSS Statistics (Version 21) and IBM SPSS Amos (Version 21; Arbuckle, 2019) were used for data evaluation. The significance level was set at .05.
Results
Participants
The study included 89 participants (Table 1). The mean VA in logMAR of the right eye was .865 (SD = .276) and of the left eye was .858 (SD = .270). Participants’ diagnoses included diabetic retinopathy (n = 39), macular degeneration (n = 20), glaucoma and optic neuropathies (n = 19), Behçet’s disease (n = 5), retinal dystrophy (n = 4), and other (n = 2).
Participant Characteristics (N = 89)
Item Analysis
There were no missing LVIM–R data in the data set. The corrected item–total correlations for all 46 items exceeded the cutoff of .30 (Table 2). In addition, there was no significant change in Cronbach’s α if each item was deleted (α = .964 or .965 for all). The distribution of answers to the scale items indicated that some items had a ceiling (<15%) or floor (>15%) effect.
Item Analysis Results and Factor Loadings of the Single-Factor Structure Obtained by Principal-Components Analysis
Note. CO = Communication; FM = Financial Management; FP = Food Preparation; HM = Home Management; LE = Leisure; MO = Mobility; SC = Self-Care; SH = Shopping.
N = 89, no. of items = 46, Cronbach’s α = .965, M = 107.910 (SD = 29.833).
Eigenvalue = 18.217, ratio of variance explained = 39.603%, Cronbach’s α = .965, Armor’s θ = .966, McDonald’s ω = .981 for Visual Field or Scotoma and .980 for Visual Acuity, Kaiser–Meyer–Olkin test = .812, Bartlett’s test of sphericity: χ2(1035) = 4,133.692 (p < .001).
Principal-Components Analysis
The KMO value of .812 exceeded the value of .700 recommended by Kaiser (1974), indicating that the available data showed sampling adequacy. Bartlett’s test of sphericity (χ2 = 4,133.692, p < .001) could be factored because the correlation matrix of the sampling was different from the identity matrix. The eigenvalue of the unidimensionality structure was 18.217, and the variance explanation ratio was 39.603%. The factor loadings for the fit of the single-component structure were in the range of .436–.756, which exceeded the cutoff of .32 (Table 2).
Confirmatory Factor Analysis
On the basis of the eight-factor structure proposed by Smith (2013), the LVIM–R items were parceled into two factors: (1) Visual Field or Scotoma and (2) Visual Acuity, with the domain-representativeness approach (Williams & O’Boyle, 2008) and evaluated by CFA using the maximum likelihood estimation method (see Table 3). The two-factor first-order CFA, shown in Figure 1, indicated that the factor structure is compatible with the data structure, χ2(8) = 9.566, p = .297. The normed χ2 of 1.196 showed good agreement, and the CFI (.998), TLI (.996), and RMSEA (.047) indicate good fit. The t values of the factor loadings were greater than 1.96, indicating that the standardized factor loadings were statistically significant. The standardized coefficients were in the range of .930–.963 for Visual Field or Scotoma and .930–.948 for Visual Acuity. The goodness-of-fit statistics and significant factor loadings support the structural validity of the two-factor model (Hu & Bentler, 1999; Schermelleh-Engel et al., 2003).
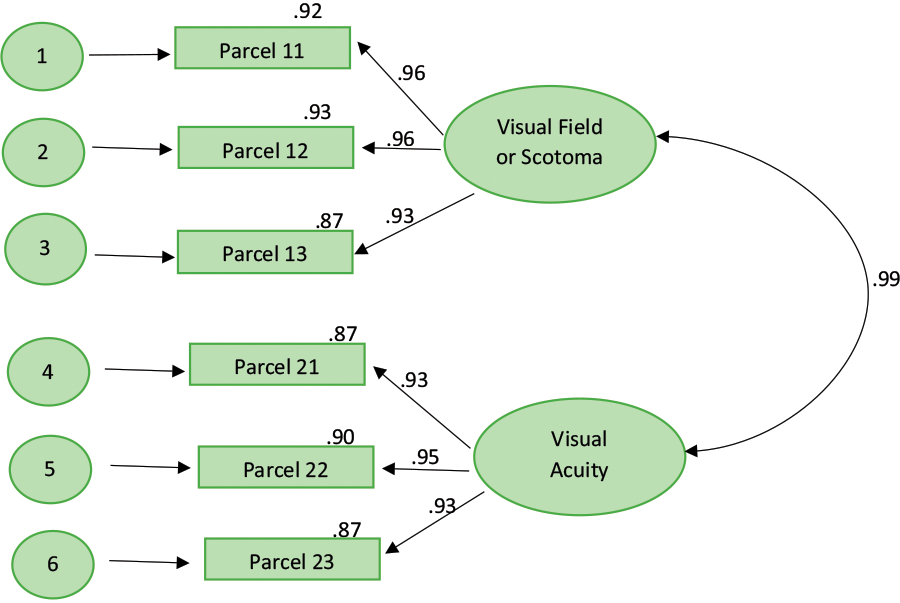
First-order confirmatory factor analyses (two-factor model).
Confirmatory Factor Analysis Parameter Estimation Results
Note. χ2(8) = 9.566 (p = .297), normed χ2 = 1.196, comparative fit index = .998, Tucker–Lewis Index = .996, root mean square error of approximation = .047. CO = Communication; FM = Financial Management; FP = Food Preparation; HM = Home Management; LE = Leisure; MO = Mobility; NA = not applicable; SC = Self-Care; SH = Shopping.
Cronbach’s α = .964, McDonald’s ω = .981.
Cronbach’s α = .954, McDonald’s ω = .980.
Reliability Analysis
The Cronbach’s α of all 46 items in the scale was .965 (Table 2). PCA indicated that Armor’s θ using the highest eigenvalue was .966. Test–retest reliability ICCs were .995 for Visual Field or Scotoma, .997 for Visual Acuity, and .997 for the Total score. CFA yielded composite reliability values of McDonald’s ω = .981 for Visual Field or Scotoma and .980 for Visual Acuity.
Discussion
Overall, our findings demonstrate that the Turkish version of the LVIM–R with a two-factor structure is a valid and reliable scale for evaluating the activity performance of people with low vision. Our results confirmed the scale’s structural validity, demonstrating that the items are homogeneous, and its structural unidimensionality, demonstrating that the scale measures a single variable. Considering the reliability coefficients in terms of factor analysis, the Armor θ coefficient in our study supports Cronbach’s α and reflects that the Turkish LVIM–R has strong reliability.
CFA revealed that all parameter values were significant in the parceling model created for two factors using the domain-representativeness approach. Significance is necessary, but not sufficient, for the model in question to be correct or acceptable. In addition, we found the measurement model to be acceptable as a whole, as indicated by χ2 values indicating good fit with the data structure and normed χ2 values showing good agreement, as well as by CFI, TLI, and RMSEA values. Smith et al. (2019) found similar goodness-of-fit statistics; CFI (.989) and TLI (.980) indicated good fit, whereas RMSEA (.072) indicated moderate fit. Composite reliability values for the Visual Field or Scotoma and Visual Acuity factors indicate good internal consistency of the items in each factor (Lucke, 2005). Test–retest reliability ICCs for Visual Field or Scotoma, Visual Acuity, and Total score surpassed the .700 cutoff, indicating that the scale gives consistent results over a 2-wk period.
Limitations
This study has some limitations. The sample size was small, and all participants were recruited from the same low vision unit. In addition, participant examinations began in early 2020, but because of coronavirus disease 2019 restrictions the low vision clinic where the study was conducted could not serve patients for an extended time; therefore, our data collection process was long. Planned future studies will be carried out with more participants.
Implications for Occupational Therapy Practice
This study has the following implications for occupational therapy practice: ▪ The Turkish LVIM–R is a valid and reliable measure of activity performance in people with low vision. ▪ The Turkish LVIM–R can be used to identify activities to address in the patient’s plan of care and to measure outcomes of the intervention. ▪ Future research by occupational therapists evaluating the independence of people with low vision is expected to contribute to the development of low vision rehabilitation procedures.
Conclusion
Occupational therapy practitioners providing low vision rehabilitation evaluate patients’ ability to perform vision-dependent ADLs. Use of valid and reliable assessments is essential to develop patient-centered treatment plans and measure rehabilitation outcomes. The Turkish version of the LVIM–R can help Turkish-speaking practitioners and researchers working in low vision rehabilitation implement evidence-based interventions and research to improve the activity performance of people with low vision.
Footnotes
Acknowledgments
We thank nurse Nurten Türe Özcan, who helped us as a volunteer witness during our research; academician physiotherapists Ayşe Göktaş, Sümeyye Belhan Çelik, Duygu Türker, and Tezel Yıldırım Şahan, who helped us in the development of the Turkish version of the LVIM–R; and all the participants who took part in the research as volunteers.