





Abstract
This study found that the use of serial trichotomization in clinical tests of unfit drivers increases the accuracy of predicting pass and fail outcomes and reduces the number of drivers undergoing unnecessary on-road assessments.
Fitness to drive is an individual’s ability to control a motor vehicle on all public roads without compromising their or others’ safety (Brouwer & Ponds, 1994; Transportation Research Board, 2016). Health care professionals, including physicians and occupational therapists, have a mandatory or discretionary responsibility to report medically at-risk drivers to their provincial transportation ministries in Canada (Canadian Council of Motor Transport Administrators [CCMTA], 2021). The transportation ministries may refer at-risk drivers to complete a comprehensive driving evaluation (CDE), consisting of a battery of clinical tests and an on-road driving assessment that is typically performed by occupational therapists (CCMTA, 2021). On the basis of the CDE, determinations of fitness to drive include whether drivers are fit to continue driving, unfit to continue driving, or indeterminate, and they require further driving assessment, rehabilitation, or both (CCMTA, 2021). Generally, medically at-risk drivers are fit to drive if they meet the conditions to drive legally (e.g., visual standards) and can physically and sufficiently operate a motor vehicle; alternatively, drivers must have insight and be able to compensate for any visual or motor losses and not have cognitive impairments (CIs), pain, and/or medication that impairs their ability to drive legally and safely (CCMTA, 2021).
Although the CDE is considered the gold standard for assessing fitness to drive (Bellagamba et al., 2020; Sawada et al., 2019), the standards do not specify which clinical tests or cut points are most valid for the CDE (CCMTA, 2021). Rather, the standards state the medical conditions (e.g., cardiovascular, cerebrovascular, circulatory, metabolic, musculoskeletal, neurological, psychiatric, respiratory, sleep disorders) that can affect fitness to drive; the sensory (i.e., vision, hearing), cognitive, and motor functions necessary for driving; and the suggested clinical tests to use on the basis of research (CCMTA, 2021). Because at-risk drivers cannot compensate for CI that impairs driving ability, the standards prioritize an assessment of cognitive function and suggest using the Montreal Cognitive Assessment (MoCA; Nasreddine et al., 2005); Trail Making Test, Part A and Part B (Trails A and Trails B, respectively; Lezak, 1995); and the Useful Field of View® (UFOV; CCMTA, 2021).
Studies show that the MoCA, Trails A, Trails B, and UFOV predict driving outcomes in medically at-risk drivers (Asimakopulos et al., 2012; Choi et al., 2014; Crizzle et al., 2012; Egeto et al., 2019; Hird et al., 2016; Krasniuk et al., 2019; Ranchet et al., 2012; Rashid et al., 2020; Roy & Molnar, 2013; Selander et al., 2020; Woutersen et al., 2017). However, findings vary across research studies, showing that different clinical tests and cut points with varying levels of error, are predictive of fitness to drive (Asimakopulos et al., 2012; Egeto et al., 2019; Hird et al., 2016; Smedslund et al., 2015; Rashid et al., 2020; Roy & Molnar, 2013). These findings, which are also reported in the standards (CCMTA, 2021), indicate that no single test should be used on its own to determine one’s fitness to drive (Bédard & Dickerson, 2014; Vrkljan et al., 2011). Accordingly, when implementing the evidence-based standards into practice, various clinical tests and cut points are used (Korner-Bitensky et al., 2011; Vrkljan et al., 2013), some of which may not be useful for accurately determining fit and unfit drivers (Dickerson et al., 2014). This results in more drivers than necessary undergoing the on-road assessment, which can increase the workload for assessors and increase wait times for clients referred for a CDE. A different approach that includes various clinical test scores with 100% sensitivity and specificity may increase the certainty of fitness to drive determinations.
Serial trichotomization is a process that provides two separate cut points: a 100% sensitivity cut point representing scores that determine passing a CDE with 100% certainty; and a 100% specificity cut point representing scores that determine failing a CDE with 100% certainty (Gibbons et al., 2017; Yamin et al., 2020). Two studies show that serial trichotomization using the MoCA (or the modified Mini-Mental State Examination; MMSE; Teng & Chui, 1987), Trails A and Trails B, among other tests (i.e., the Clock Drawing Test, Motor-Free Visual Perceptual Test–3), predicts pass and fail outcomes in medically at-risk drivers (n = 83; Gibbons et al., 2017) and in older drivers with CI or dementia (n = 105; Yamin et al., 2020). However, this process has not yet been examined using the UFOV in medically at-risk drivers or when controlling for a primary diagnosis of CI.
The purpose of this study is to examine whether serial trichotomization using different clinical tests (e.g., the UFOV) can similarly predict pass–fail outcomes with 100% sensitivity and specificity in medically at-risk drivers referred for a CDE compared with the CDE outcome determined by an occupational therapist. We compared the process with the MoCA, Trails A and Trails B, and the UFOV in the total sample and in participants with and without CI. If serial trichotomization of different clinical tests can predict pass–fail outcomes in medically at-risk drivers, the process could be used to reduce potential errors associated with the variation in clinical assessments performed across settings.
Method
Study Design
We received ethics approval from the University of Saskatchewan to collect and analyze retrospective CDE data of medically at-risk drivers with medical conditions that could increase their risk of dangerous driving or crashes. Physicians identified these risks as potentially precluding the drivers’ abilities to drive safely or legally and, therefore, referred them for CDEs to determine their fitness to drive. The CDEs were administered by one occupational therapist with training and experience (i.e., graduate certificate in assessing driving capabilities) in assessing fitness to drive as per the regulated standards (CCMTA, 2021). The CDEs occurred in real-world clinical practice settings at a driving assessment center in Southwestern Ontario from 2011 to 2017.
Participants
One hundred ninety-nine medically at-risk drivers were referred by physicians for CDEs ▪ for having medical conditions that could affect their fitness to drive (82.5%), ▪ to reassess their fitness to drive (9.5%), ▪ to test or install adaptive equipment (4.5%), ▪ for being involved in a motor vehicle crash (1.0%), ▪ for having an expired driver’s license (0.5%), or ▪ for a reason not stated (2.0%).
The inclusion criteria were that participants met the province’s regulated visual acuity standards (i.e., corrected or uncorrected binocular visual acuity ≥20/50) and had complete data on all clinical tests and the CDE outcome. Participants were excluded if they did not meet the province’s regulated visual acuity standards, because they would have been referred for a vision examination (Ministry of Transportation of Ontario, 2018). If participants had missing data on any of the clinical tests or the CDE outcome, it would not be possible to analyze their data by means of serial trichotomization. Overall, 55 drivers were excluded for not having complete data on the MoCA (n = 13), Trails A (n = 13), Trails B (n = 10), UFOV1 (n = 26), UFOV2 (n = 34), UFOV3 (n = 38), and/or CDE outcome (n = 7). The final sample included 142 medically at-risk drivers.
Data Collection and Procedures
We collected participants’ demographics (i.e., age, gender, education, license status, number of years driving, and primary diagnosis) and clinical test scores on the MoCA, Trails A, Trails B, and UFOV. The MoCA (i.e., paper format) assesses general cognitive function with scores from 0 to 30 (Nasreddine et al., 2005). A score less than 26 on the MoCA detects CI in 90% of people with mild CI and 100% of people with Alzheimer’s disease (Nasreddine et al., 2005). The Trails A (i.e., paper format) assesses processing speed and visual scanning through connecting 25 numbers sequentially in ascending order (Lezak, 1995). Taking 120 s or longer to complete the test has been shown to indicate impairment (Byszewski et al., 2012). The Trails B (i.e., paper format) assesses divided attention and executive functioning through connecting 25 numbers and letters sequentially in ascending order (Lezak, 1995). Taking 180 s or longer to complete the test has been shown to indicate impairment (Roy & Molnar, 2013). The UFOV (i.e., computer PC model and touch screen) includes three subtests that assess processing speed (i.e., UFOV1), divided attention (i.e., UFOV2), and selective attention (i.e., UFOV3) through responding to visual stimuli displayed on a screen (Visual Awareness Research Group, 2009). Scores of 350 to 500 ms indicate very slowed processing speed on UFOV1 and severe difficulty with divided attention on UFOV2, and a score of 500 ms indicates severe difficulty with selective attention on UFOV3 (Visual Awareness Research Group, 2009).
The same occupational therapist who administered participants’ clinical assessments also administered the on-road assessment, which occurred during the day in non-inclement weather conditions. While sitting in the passenger seat of a vehicle with dual-pedals and automatic transmission, the occupational therapist assessed the participants’ abilities to adjust to stimuli, accept gaps, steer, use signals, regulate speed, maintain vehicle positioning, visually scan the environment, and yield on a predetermined route with 95 total maneuvers observed when driving straight (n = 47), turning left (n = 9), turning right (n = 15), and changing lanes (n = 24) in residential, suburban, urban, and expressway environments. The on-road assessment took 45 to 60 min to complete. On-road assessment outcomes included a pass–fail outcome that was based on a scoring system where those who correctly performed at least 50% of the total maneuvers passed, and those who made a hazardous error (e.g., failing to yield, crash) or correctly performed less than 50% of the total maneuvers failed.
The CDE outcomes (i.e., pass, fail, indeterminate) were determined on the basis of the occupational therapist’s judgment of the driver’s overall performance on the clinical and on-road assessments. Drivers who were considered fit to continue driving safely and legally received a pass outcome, those who were considered unfit to continue driving safely and legally received a fail outcome, and an indeterminate outcome was given if the occupational therapist considered that more lessons and retesting were required before a definitive pass–fail determination could be made.
Data Analysis
We performed all analyses with IBM SPSS Statistics (Version 28.0), using a significance level of p < .05. Means (with SDs) and ranges were used to summarize continuous data, and frequencies and percentages were used to summarize categorical data. One-way Welch analyses of variance (i.e., violations in homogeneity and normality assumptions) or χ2 tests were used to determine differences in demographic and clinical test scores among participants with pass, fail, or indeterminate CDE outcomes.
A contrast receiver operating characteristic (ROC) curve was performed to discern the difference in the area under the curve (AUC) for each clinical test in predicting pass (i.e., pass–indeterminate) versus fail outcomes on the CDE in participants with and without CI. A statistically significant AUC of 0.7 or higher out of 1.0 showed that the clinical test had acceptable discrimination between CDE outcomes (Streiner & Cairney, 2007). For each clinical test, we computed the sensitivity and specificity cut points of ROC curves to determine pass outcomes (i.e., 100% sensitivity cut point: scores better than 100% sensitivity) and fail outcomes (i.e., 100% specificity cut point: scores worse than 100% specificity). Indeterminate outcomes were scores that were worse than the 100% sensitivity cut point and better than the 100% specificity cut point (Gibbons et al., 2017; Yamin et al., 2020). As shown in prior studies (Gibbons et al., 2017; Yamin et al., 2020), serial trichotomization involved arranging the clinical tests in order from most to least predictive of CDE outcomes and using the 100% sensitivity and specificity cut points to identify pass and fail outcomes. The indeterminate outcomes were then funneled to subsequent clinical tests until all CDE outcomes were classified.
Results
Sample Characteristics
Participants ranged in age from 24 to 94 yr (M = 69.2, SD = 14.1); 69% of the participants were ages 65 yr and older, 71.8% were male, and 61.3% had at least a Grade 12 education. Participants had been driving for a mean of 51.0 yr (SD = 13.5, range = 8–74); 53.5% had a valid driver’s license, 15.5% had a suspended license, 28.2% had a temporary license, and 2.8% had a beginner’s license. Participants had a mean of 2.4 (SD = 1.3, range = 0–6) comorbidities. The primary diagnoses were as follows: ▪ CIs (46.8%, including dementia) ▪ Cerebrovascular disease (19.7%) ▪ musculoskeletal conditions (5.6%) ▪ Parkinson’s disease (4.9%) ▪ multiple sclerosis (4.2%) ▪ traumatic or acquired brain injury (3.5%) ▪ or other brain injuries/conditions (2.8%) ▪ depression or anxiety disorders (3.5%) ▪ cancer (2.1%) ▪ chronic pain (1.4%) ▪ peripheral vascular disease (1.4%) ▪ chronic obstructive pulmonary disease (0.7%) ▪ vertigo (0.7%) ▪ myocardial infarction (0.7%).
A total of 2.0% did not have a primary diagnosis.
Clinical Performance
The sample had a mean score of 22.6 (SD = 4.2, range = 10–30) on the MoCA; 116 (81.7%) scored below 26, indicating possible CI. The mean time to complete the Trails A was 61 s (SD = 30, range = 14–241); for the Trails B, it was 215 s (SD = 147, range = 49–786). Six participants (4.2%) took 120 s or longer to complete the Trails A, indicating impairment in processing speed and visual scanning, whereas 68 (47.9%) took 180 s or longer to complete the Trails B, indicating impairment in divided attention and executive functioning. Participants had mean scores of 38.3 ms (SD = 61.8, range = 9–393) on the UFOV1, 194.6 ms (SD = 171.8, range = 9–500) on the UFOV2, and 329.7 ms (SD = 149.4, range = 16–500) on the UFOV3. One participant (0.7%) scored 393 ms on the UFOV1, indicating very slowed processing speed; 33 (23.2%) scored between 350 and 500 ms on the UFOV2, indicating severe difficulty with divided attention; and 47 (33.1%) scored 500 ms on the UFOV3, indicating severe difficulty with selective attention (with 21 of 47 also scoring 500 ms on the UFOV2).
Comparing Performance by CDE Outcome
As shown in Table 1, 46 participants passed (32.4%) and 39 failed (27.5%) the CDE; 57 (40.1%) had indeterminate outcomes. Age, number of years driving, a primary diagnosis of CI, and scores on all clinical tests significantly differed among participants with pass, indeterminate, and fail outcomes on the CDE. Participants who failed the CDE were significantly more likely to have CI than those with indeterminate or pass outcomes.
Comparing Performance of Medically At-Risk Drivers with Pass, Indeterminate, or Fail Outcomes on the Comprehensive Driving Evaluation
Note. Ten responses are missing for number of years driving. MoCA = Montreal Cognitive Assessment (0–30); Trails A and Trails B = Trail Making Test, Parts A and B (in seconds); UFOV1–3 = Useful Field of View® Subtests 1 through 3 (in milliseconds).
As shown in Table 2, post hoc comparisons (i.e., Games-Howell) showed that participants who failed versus passed the CDE were significantly older, with a higher number of years driving, and they performed significantly worse on the MoCA, Trails A, Trails B, UFOV1, UFOV2, and UFOV3. In addition, participants who failed, compared with those with indeterminate outcomes on the CDE, were significantly older and performed significantly worse on the MoCA, Trails A, Trails B, UFOV2, and UFOV3. Last, participants with indeterminate outcomes, compared with those who passed the CDE, were significantly older, with a higher number of years driving, and they performed significantly worse on the MoCA, Trails A, Trails B, UFOV2, and UFOV3.
Post Hoc Comparisons of Pass, Indeterminate, or Fail Outcomes on the Comprehensive Driving Evaluation
Note. Ten responses are missing for number of years driving. MoCA = Montreal Cognitive Assessment (0–30); Trails A and B = Trail Making Test, Parts A and B (in seconds); UFOV1–3 = Useful Field of View® Subtests 1 through 3 (in milliseconds).
Identifying Fit and Unfit Medically At-Risk Drivers With 100% Sensitivity and Specificity
As shown in Table 3, all clinical tests showed significant and moderate discrimination in detecting CDE outcomes in the total sample, in participants with CI, and in participants without CI except for the Trails A test (AUC = 0.67, p = .06). The area difference under the curve was not significantly different between participants with and without CI on the MoCA (z = −0.16, p = .87), Trails A (z = 0.34, p = .73), Trails B (z = 0.61, p = .54), UFOV1 (z = 0.17, p = .87), and UFOV2 (z = 0.17, p = .87); but it was significantly different on the UFOV3 (z = −2.1, p = .01). The clinical tests that were most to least predictive of pass and fail outcomes with 100% sensitivity and specificity were the UFOV3, UFOV2, UFOV1, Trails B, MoCA, and Trails A in the total sample; the UFOV3, UFOV2, Trails B, Trails A, UFOV1, and MoCA in participants with CI; and the UFOV3, UFOV2, Trails B, UFOV1, Trails A, and MoCA in participants without CI.
Identifying Fit and Unfit Medically At-Risk Drivers With 100% Sensitivity and Specificity
Note. AUC = area under the curve; CI = cognitive impairment; MoCA = Montreal Cognitive Assessment; ROC = receiver operating characteristic; Trails A and B = Trail Making Test, Parts A and B; UFOV1–3 = Useful Field of View® Subtests 1 through 3.
The funneling models of serial trichotomization of the MoCA, Trails A, Trails B, and UFOV1–3 that predict pass and fail outcomes with 100% sensitivity and specificity for the total sample and for participants with and without CI are presented in Figure 1. The clinical tests predicted 43.7% pass and 34.5% fail outcomes in the total sample (21.8% were indeterminate); 31.8% pass and 51.5% fail outcomes in participants with CI (16.7% were indeterminate); and 78.4% pass and 18.9% fail outcomes in participants without CI (2.7% were indeterminate).
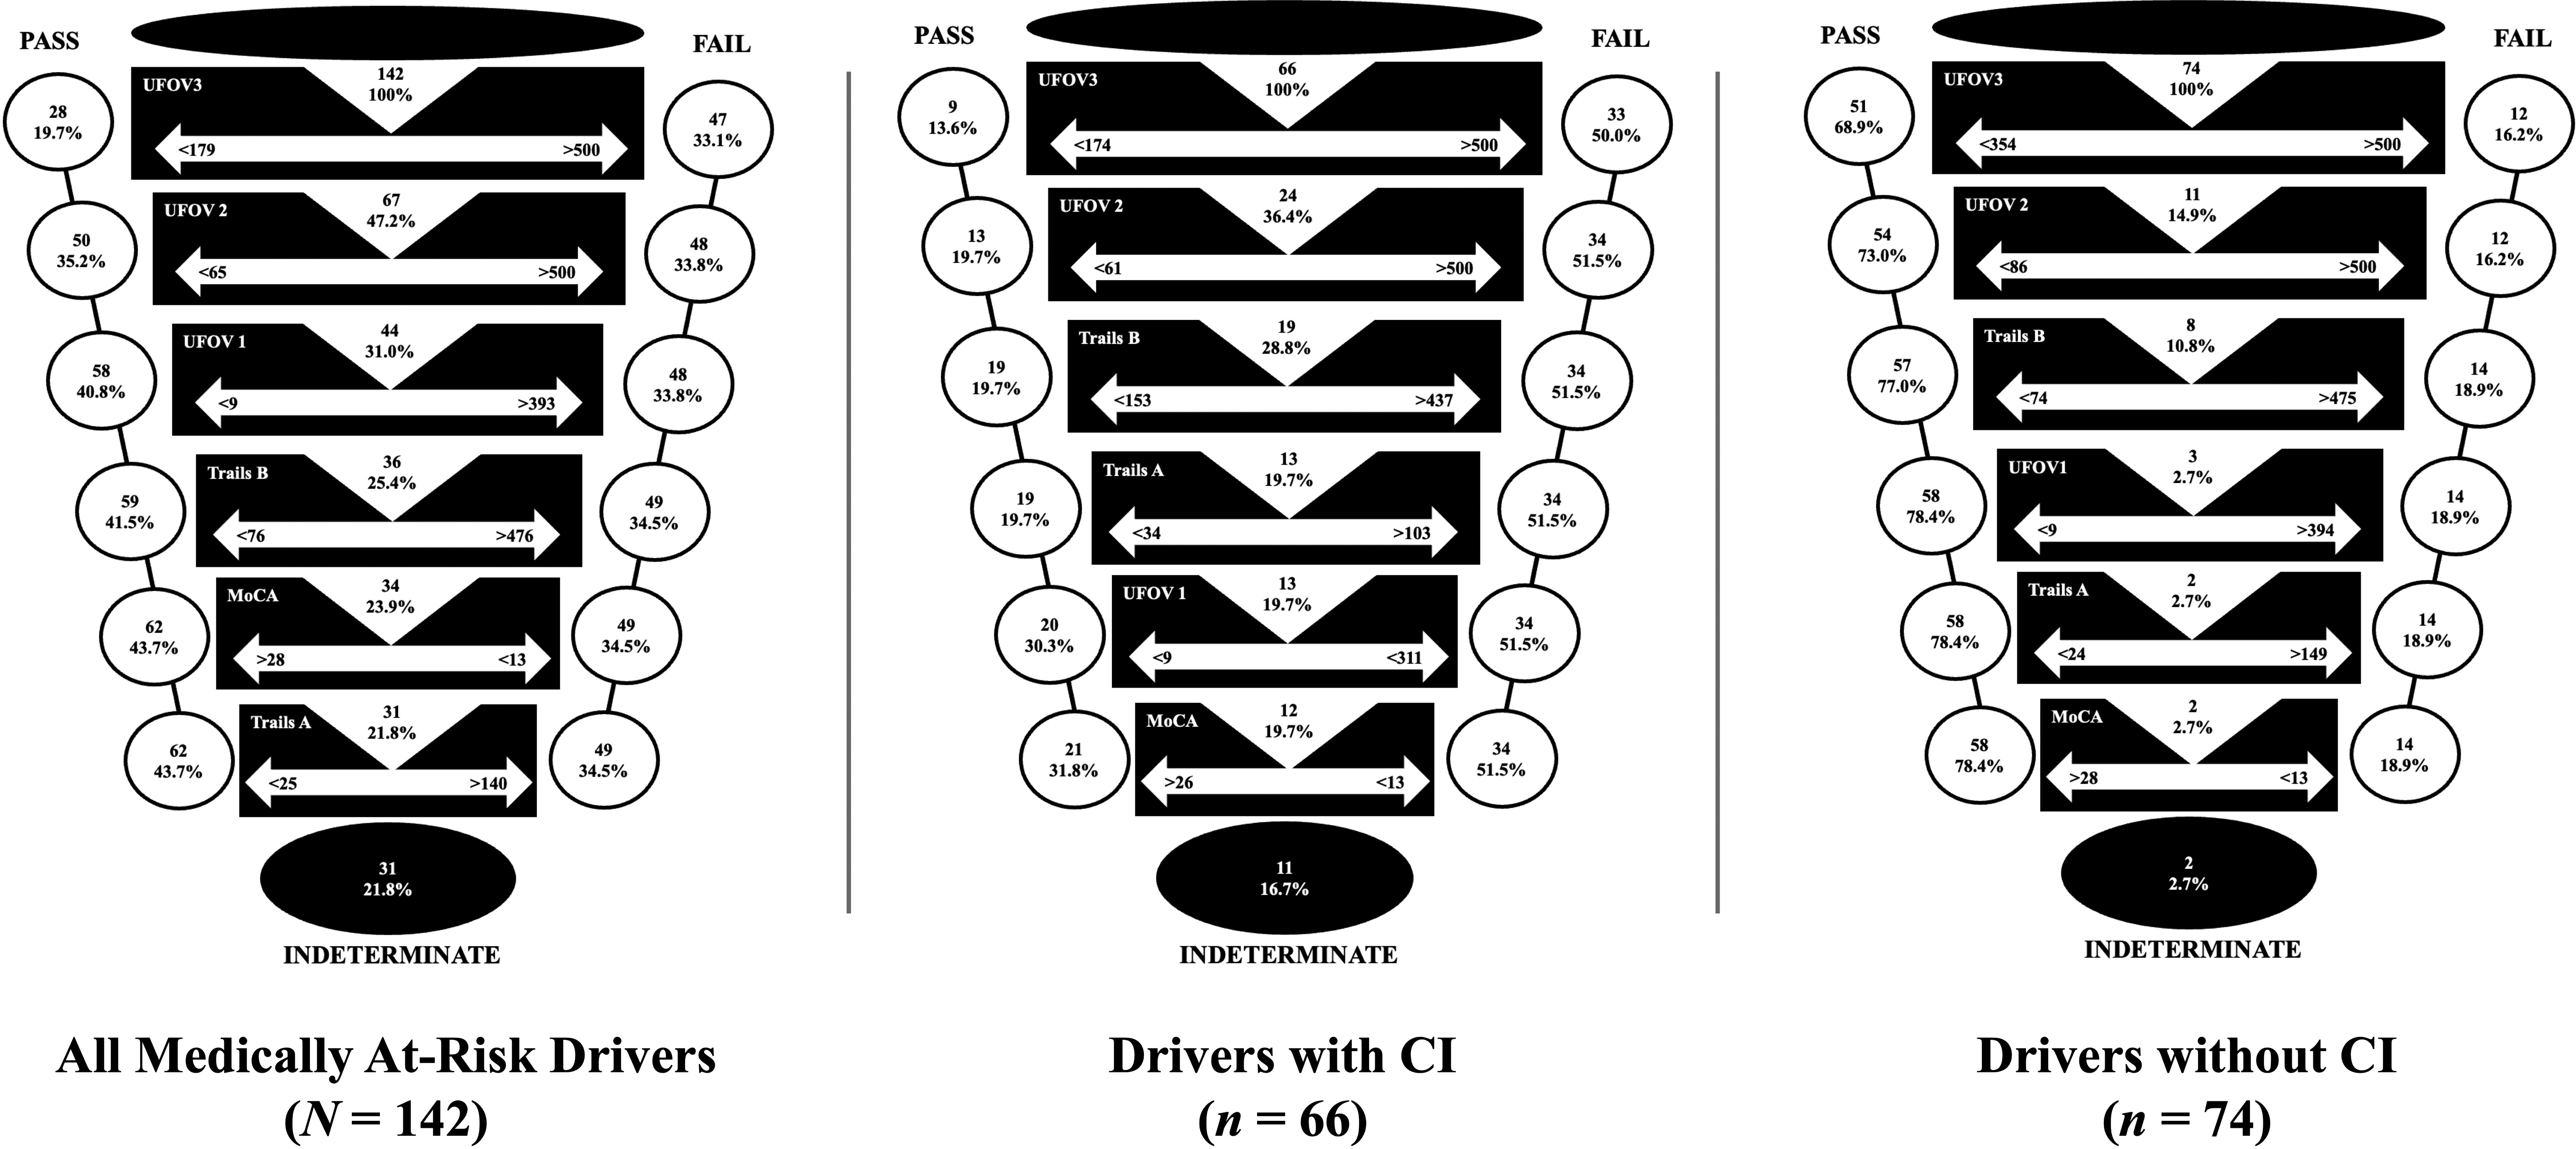
Funneling model of serial trichotomization identifying fit and unfit medically at-risk drivers.
Discussion
Compared with the CDE outcome, serial trichotomization of the MoCA, Trails A and B, and UFOV1–3 predicted more pass (43.7% vs. 32.4%) and fail (34.5% vs. 27.5%) outcomes in the total sample of medically at-risk drivers. Together, the six clinical tests predicted 78.2% of the pass–fail outcomes with 100% sensitivity and specificity, which is similar to the findings with the five tests (78.3%) used in the Gibbons et al. (2017) study and slightly better than the findings with the four tests (63.8%) used in the Yamin et al. (2020) study. When comparing serial trichotomization between drivers with and without CI in our study, the clinical tests predicted 83.3% and 97.3% of the pass– fail outcomes with 100% sensitivity and specificity, respectively. Moreover, the clinical tests predicted more drivers with CI to fail (51.5% vs. 31.8% passed) and more drivers without CI to pass the CDE (78.4% vs. 18.9% failed), which is likely because those who failed were significantly more likely to have CI and perform significantly worse on all clinical tests. Overall, our study’s findings show that serial trichotomization with different tests (e.g., UFOV) and populations (e.g., medically at-risk drivers with and without CIs) can be used to identify fit and unfit drivers with 100% certainty.
Our funneling model of the total sample shows that the UFOV1–3 predicted 93.5% of fit (58 of 62 passed) and 97.9% of unfit drivers (48 of 49 failed) with 100% sensitivity and specificity (i.e., 74.6% of 78.2% total). The 100% sensitivity cut points indicate that those who were predicted to pass had scores showing normal processing speed and divided and selective attention on the UFOV1–3. Conversely, the 100% specificity cut points show that most who were predicted to fail scored 500 ms on the UFOV3 (with 44.7% also scoring 500 ms on UFOV2). These findings indicate that the UFOV was most accurate in predicting CDE outcomes, and those who were predicted to fail had severe difficulties in divided and selective attention.
Following the UFOV, the Trails B and MoCA together predicted the remaining 3.6%, and the Trails A did not predict any CDE outcomes. Almost all drivers showed impairment on the MoCA in our study (M = 22.6, SD = 4.2, range = 10–30); in the Gibbons et al. (2017) study (M = 23.6, SD = 4.3; range was not specified); and in the Yamin et al. (2020) study, which used the modified MMSE (M = 84.7, SD = 14.2, range = 21–99). In all three studies, over 80% (i.e., 80.7%–87.3%) scored as indeterminate using either the MoCA or the modified MMSE, and the 100% sensitivity and specificity cut points predicted only a few with intact cognitive function to pass (26–28 on the MoCA and 98 on the modified MMSE) and a few with severe CI to fail (13–16 on the MoCA; 78 on the modified MMSE; Canadian Task Force on Preventative Health Care, 2016; Gibbons et al., 2017; Yamin et al., 2020). Accordingly, both the MOCA and the modified MMSE provided a lower ability to predict pass and fail outcomes with 100% sensitivity and specificity in these samples.
Although almost all drivers performed well on the Trails A in our study (M = 60 s, SD = 30, range = 14–241) and in the Gibbons et al. (2017) study (M = 46.9 s, SD = 33.2; range not specified), participants in the Yamin et al. (2020) study showed a higher variability and poorer performance (M = 76.3 s, SD = 63.1, range = 24–300), which is likely due to their sample comprising all older adults and having CI or dementia (100% vs. 12% in the Gibbons et al. (2017) study or 46.5% in our study). Accordingly, the Trails A provided a higher ability to predict pass–fail outcomes in the Yamin et al. (2020) study than in the Gibbons et al. (2017) study or in our study, where the test could not distinguish between pass and fail outcomes in those who performed well. However, participants in our study showed the highest variability and poorest performance on the Trails B (M = 214 s, SD = 127, range = 49–786), compared with the participants in the Gibbons et al. (2017) study (M = 158.1 s, SD = 139.5; range was not specified) and the Yamin et al. (2020) study (M = 186.7 s, SD = 87.4, range = 43–300), which is likely as a result of almost half of our sample having CI and having a broader age range (24–94 yr). The high variability and poor performance on the Trails B predicted only a few to pass (14 drivers with scores ≤76 s) or fail (6 drivers with scores ≥476 s) with 100% sensitivity and specificity.
Overall, the findings in this study, and compared with prior studies, show that serial trichotomization of clinical tests predict pass–fail outcomes with 100% sensitivity and specificity, even when using different clinical tests and in different medically at-risk drivers. Because the order of most to least predictive depends on performance on the tests, as well as the medical conditions and types of impairments experienced by drivers, using several clinical tests that have been shown to predict driving outcomes may help identify those with the best combination and most ability in predicting pass–fail outcomes (Gibbons et al., 2017; Yamin et al., 2020).
Study Limitations
The sample in this study comprised medically at-risk drivers referred by physicians for a CDE. Accordingly, we could not collect information on their medical history (i.e., prescribed medication or confirmed diagnoses) that could affect their fitness to drive, retrospectively. Because our sample was heterogenous, comprising people ages 24–94 yr, with various medical conditions, the clinical tests may not be commonly used for some of the medical conditions (e.g., mental illness or disorders, chronic pain). Although the occupational therapist administered both clinical and on-road assessments, which could influence CDE outcomes, it is standard practice for one assessor to administer both clinical and on-road portions of the CDE (Vrkljan et al., 2013). Fatigue was not measured during the CDEs; however, the order of assessments was the same across participants.
Future Research Directions
Further studies should examine the serial trichotomization of various clinical tests, including the UFOV, on larger samples of medically at-risk drivers. Because our sample was heterogeneous (e.g., age, medical condition), further research may consider whether serial trichotomization of clinical tests are confounded by demographics. Examining serial trichotomization longitudinally may be useful in standardizing (i.e., establishing reliable and valid) cut points for pass, fail, and indeterminate outcomes as medical conditions and statuses change over time.
Implications for Occupational Therapy Practice
Building on prior studies (Gibbons et al., 2017; Yamin et al., 2020), our study shows the benefits of using serial trichotomization to predict pass–fail outcomes with 100% sensitivity and specificity. Accordingly, occupational therapists or others who assess fitness to drive should consider the following: ▪ A sole clinical test cannot determine one’s fitness to drive with 100% accuracy. ▪ Implementing serial trichotomization of various clinical tests into practice can help in judging with greater certainty on whether drivers who have been identified as fit or unfit to drive with 100% sensitivity and 100% specificity should progress to the on-road driving assessment. ▪ As our findings show that serial trichotomization reduced the number of indeterminate outcomes by approximately twofold, the process reduces the number of drivers required to undergo further (e.g., off-road or on-road) assessment or driver rehabilitation. Accordingly, serial trichotomization of clinical tests can improve the certainty of fitness to drive determinations, as well as workloads and client wait times.
Conclusion
Serial trichotomization, compared with an assessor’s judgment, is more accurate in determining fitness to drive by means of identifying pass–fail outcomes on the CDE. Implementing serial trichotomization into clinical practice may improve the certainty of decisions before undergoing the on-road driving assessment, making the CDE more efficient. In addition, future studies examining serial trichotomization with more clinical tests and larger sample sizes may help determine which clinical tests and cut points are most valid for assessing fitness to drive.
Footnotes
Acknowledgments
We acknowledge the occupational therapist who performed the CDEs in Ontario. This work was supported by a university Research Incentive Fund from the Canadian Institutes of Health Research.