





Abstract
This study highlights how the built environment and opportunities for social participation are associated with a community’s overall health.
A central belief in occupational therapy is that participation in a variety of meaningful occupations at home, work, and social places promotes health (American Occupational Therapy Association [AOTA], 2020). This belief is iterated in various seminal models that posit the interconnectedness between person, environment, and occupation and their relationship to health (Christiansen et al., 2015). For example, walking has been associated with improved health outcomes; engaging in this form of physical activity is influenced by the proximity of built environment structures and access to amenities because the availability of walkable destinations is significantly associated with the likelihood of walking (Chudyk et al., 2015; Machón et al., 2020). Therefore, access to diverse occupational opportunities, especially within walking distance, may become increasingly important to promote physical activity, health, and social functioning.
In previous studies, researchers have explored the interplay between various environmental access factors (e.g., proximity to grocery amenities, access to parks and fitness facilities, and access to exercise opportunities) to ascertain their effects on population behavior and health outcomes (Levasseur et al., 2015; Slater et al., 2019; Tretter, 2020). These types of factors have been evaluated through the Walk Score® (Walk Score, n.d.) and the AARP Livability Index (AARP, n.d.) to create tools that evaluate and score communities. These scores provide consumers and policymakers insights that help guide community infrastructure planning and individual consumer investment decisions.
Community scores are especially salient to older adults because they often experience declining levels of physical health and mobility (Hébert, 1997). After the loss of functional autonomy, older adults travel less and shorter distances (Soule et al., 2005). Presumptively, proximity to amenities and walkability become key environmental features that can maximize older adults’ physical activity to improve their health and quality of life. The purpose of this study was to investigate how diverse occupational opportunities within walking distance are related to positive health outcomes.
Method
We conducted a quantitative study with a causal–comparative design to perform a path analysis to evaluate the associations between a community’s livability factors and access to built environment characteristics and compare it with the population’s overall health. We used the data from the AARP Livability Index and Walk Score to analyze the relationship between community variables and the health of the community in the metro Atlanta area. We used a publicly available secondary data set and thus institutional review board approval and informed consent were not applicable to our study.
Overall Health Data: The AARP Livability Index
The AARP Livability Index is a publicly available tool that objectively measures “age-friendliness” by ascertaining a specific livability score determined by a neighborhood and a health score for a specific community or neighborhood identified by zip code, city, or county (AARP, n.d.). A zip code’s neighborhood score was calculated by combining scores for the following nine variables: (1) access to grocery stores and farmers markets, (2) access to parks, (3) libraries, (4) jobs by transit, (5) jobs by auto, (6) diversity of destination, (7) activity density, (8) crime rate, and (9) vacancy rate. The health score was derived from a composite of data sets, including the following six variables: (1) tobacco use, (2) obesity prevalence, (3) access to exercise opportunity, (4) health care professional shortage areas, (5) preventable hospitalization rate, and (6) patient satisfaction. These data are collected from government and private sources encompassing policies, services, census data, and health-monitoring databases. The scores range from 0 to 100, with 50 representing the national average. Higher ratings indicate a more age-friendly and livable community. The AARP Livability Index is now used as a standardized measure to compare communities.
Walkability Data
The Walk Score is openly available and a free online tool that provides an objective measure called walkability by assigning a score between 0 and 100 for any given location or zip code. Higher scores indicate areas favorable and accommodating to walking. The Walk Score uses an algorithm based on decay function to assign the raw score to each location based on the network distance of the location to various amenities (such as grocery stores, dining and drinking locations, parks, and schools) and measurable variables (such as block length within a mile from the location). Although inputting a zip code on the Walk Score website will provide a single score for that zip code, the company also provides walkability data of latitude–longitude coordinates of locations for a small fee. For this study, we used a computer-selected 100 random zip codes around the metro Atlanta area. Each zip code was further randomized to create 10 random coordinates per zip code. The procedure created 1,000 data points for 100 zip codes around Atlanta.
We purchased the walkability data for the 1,000 data points. However, 22 zip code data were discarded for missing points. Walkability data from each zip code were averaged to create the final data set for the remaining 78 zip codes that matched with zip codes from the AARP Livability Index data. A subdataset called social walk score was computed from the final walkability data set by creating a composite score from the data that can promote social participation within walking distance, namely, (1) culture, (2) dining and drinking, (3) errands, (4) grocery, (5) park, (6) school, and (7) shopping. These seven data were selected because they are important factors in a community that can promote social participation within walking distance. Average scores from these seven variables were used to determine social walk scores. After the AARP data and the Walk Score data were matched, we created a built environment characteristics data set by combining and averaging scores of (1) destination diversity, (2) access to grocery stores, (3) exercise opportunity access, (4) library access, (5) errands access, and (6) average social score.
Measurement
The independent variables included access to destination diversity, access to exercise opportunities, activity density, access to errands, and Walk Score. The dependent variables included health score and social walk score.
Power Analysis
We conducted an a priori power analysis using G*Power (Version 3.1.9.7; Faul et al., 2007) for sample size estimation, on the basis of the total 106 zip codes in the Atlanta metro area considering a medium effect size using Cohen’s (1988) criteria (ZIP Code, n.d.). With a significant criterion of α = .05 and power = .80, the minimum sample size needed for linear multiple regression with a fixed model with three predictors was 77. Therefore, our sample size is adequate to yield a medium effect for the study hypotheses.
Data Analysis
The overall health data and walkability data were combined in IBM SPSS Statistics (Version 27). Spearman correlation tests were performed to evaluate the relationship between variables from both data sets. After running correlations, statistically significant variables were analyzed to evaluate their association with health. The variables were then organized into health, personal, and social opportunities to select the most pertinent variable that contributed to each group. We created a model depicting the causal flow of the variables using a grouping of variables. On the basis of the logical background and results of the correlation and multiple regression analyses, we formulated an initial conceptual model of the relationship between the factors considered to influence social score and health score. A path analysis was conducted to assess the pattern of effects that several variables yielded on a community’s overall health score. Subsequently, we conducted a multiple regression analysis using the average social walk score and health score as dependent variables. After running the multiple regression analysis, the variables that had the strongest associations were identified. In the path analysis, we further examined the direct, indirect, and overall effects of each factor influencing the health score. The level of significance was set at a 5% risk rate.
Results
A significant relationship was found between all variables except average block length and intersection density on health score and block length on exercise opportunity. Strong correlations between health score and destination diversity, activity density, exercise opportunity, crime, Walk Score, errand access, and average social score were confirmed through Spearman’s tests (Table 1).
Correlation Between Measurement Items
*p < .05. **p < .01.
A path analysis was conducted to determine the causal effect of various components that affect a community’s overall health and social score. Before running the path analysis, an initial model was created to represent the causal flow of variables (Figure 1). When conducting the path analysis, the following assumptions were evaluated:
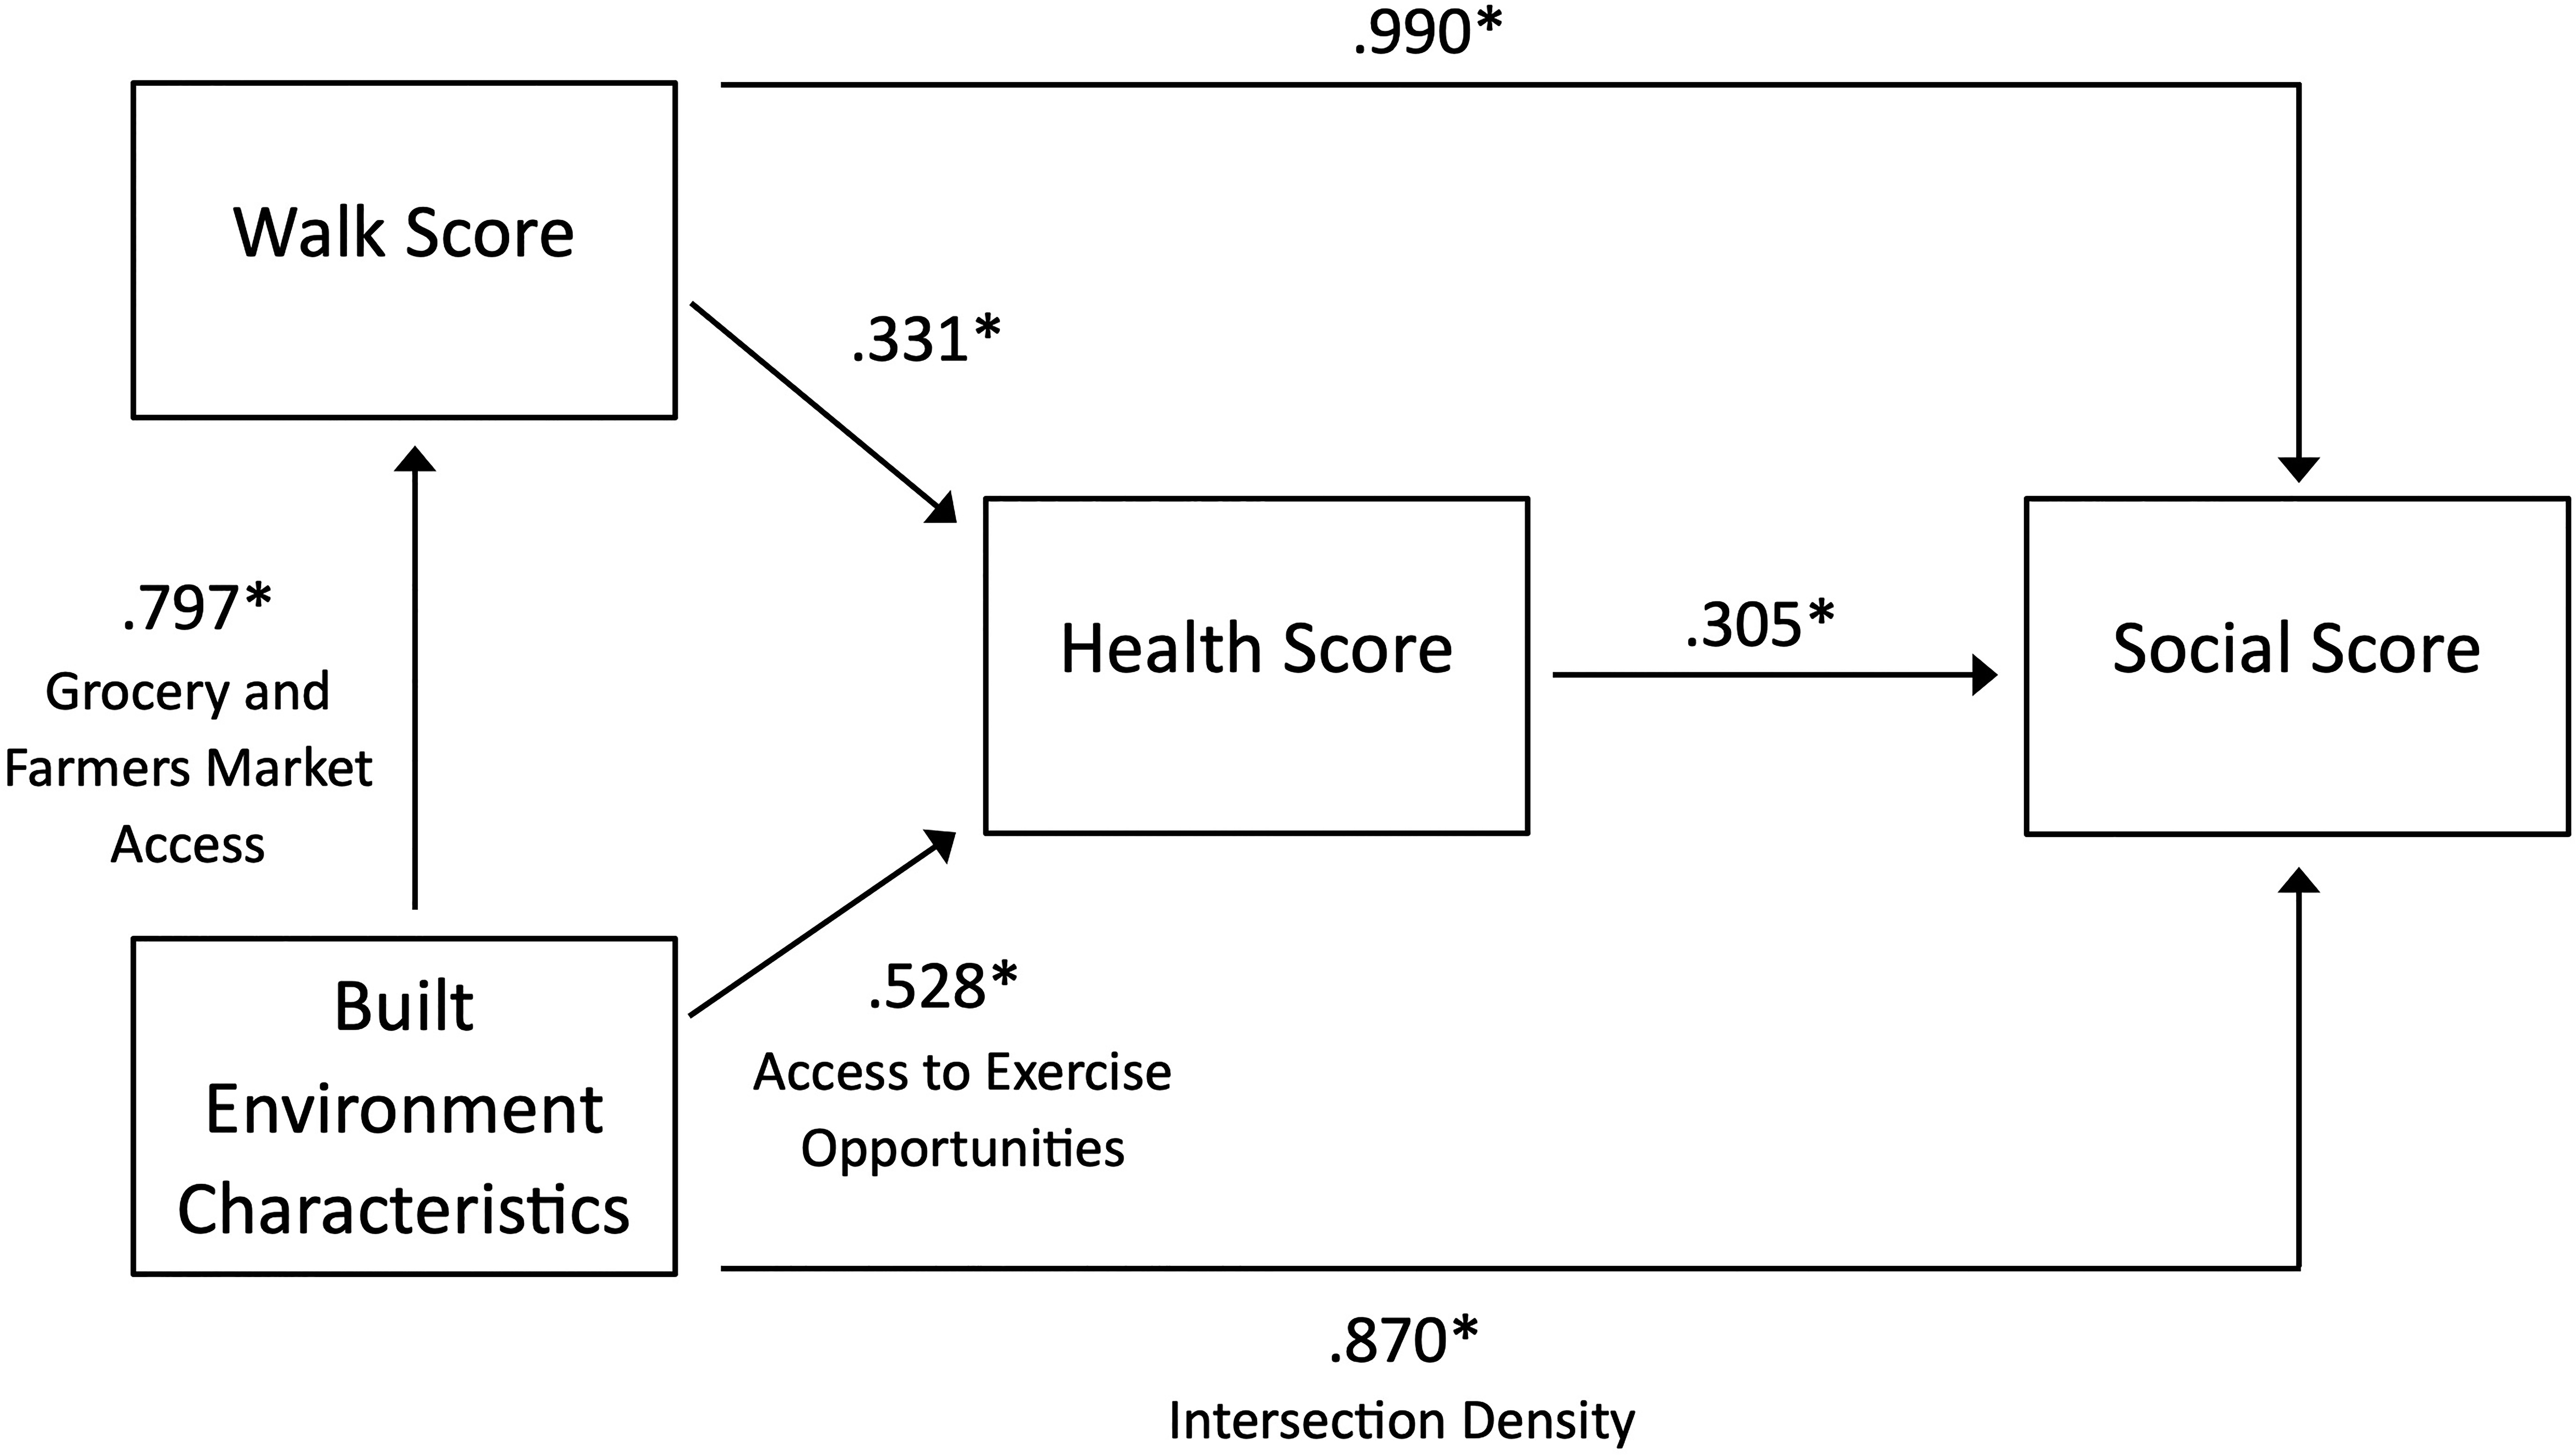
Initial path analysis model with associated correlations.
Hypothesis 1. Walk Score is positively correlated with built environment.
Hypothesis 2. Walk Score is positively correlated with health scores.
Hypothesis 3. Walk Score is positively correlated with social participation scores.
Hypothesis 4. Built environment is positively correlated with health scores.
Hypothesis 5. Built environment is positively correlated with social participation scores.
Hypothesis 6. Health scores are positively correlated with social participation scores.
The initial model analysis indicated that Walk Score and built environment characteristics produced a significant direct association with social score and an indirect association via the health score (see Figure 1). We also conducted several subcategories of associations. The results revealed that access to exercise opportunity (β = .528) and diversity of destinations (β = .543) of built environment characteristics were associated with health score, and the intersection density (β = .739) of built environment characteristics was associated with social score. Interestingly, the grocery and market access component of environmental characteristics produced a significant association (β = .797) with Walk Score. The initial model presented in Figure 1 offered opportunities for further simplification of the model. Therefore, a revised model was created with one dependent variable, health score (Figure 2). The revised model used destination diversity and social walk score as the most direct paths (as independent variables) associated with health score. The direct effects of destination diversity (β = .543) and social walk score (β = .369) were significant at the p < .001 level. The indirect effect was not applicable in the final model; therefore, the total effect is equal to the direct effect.
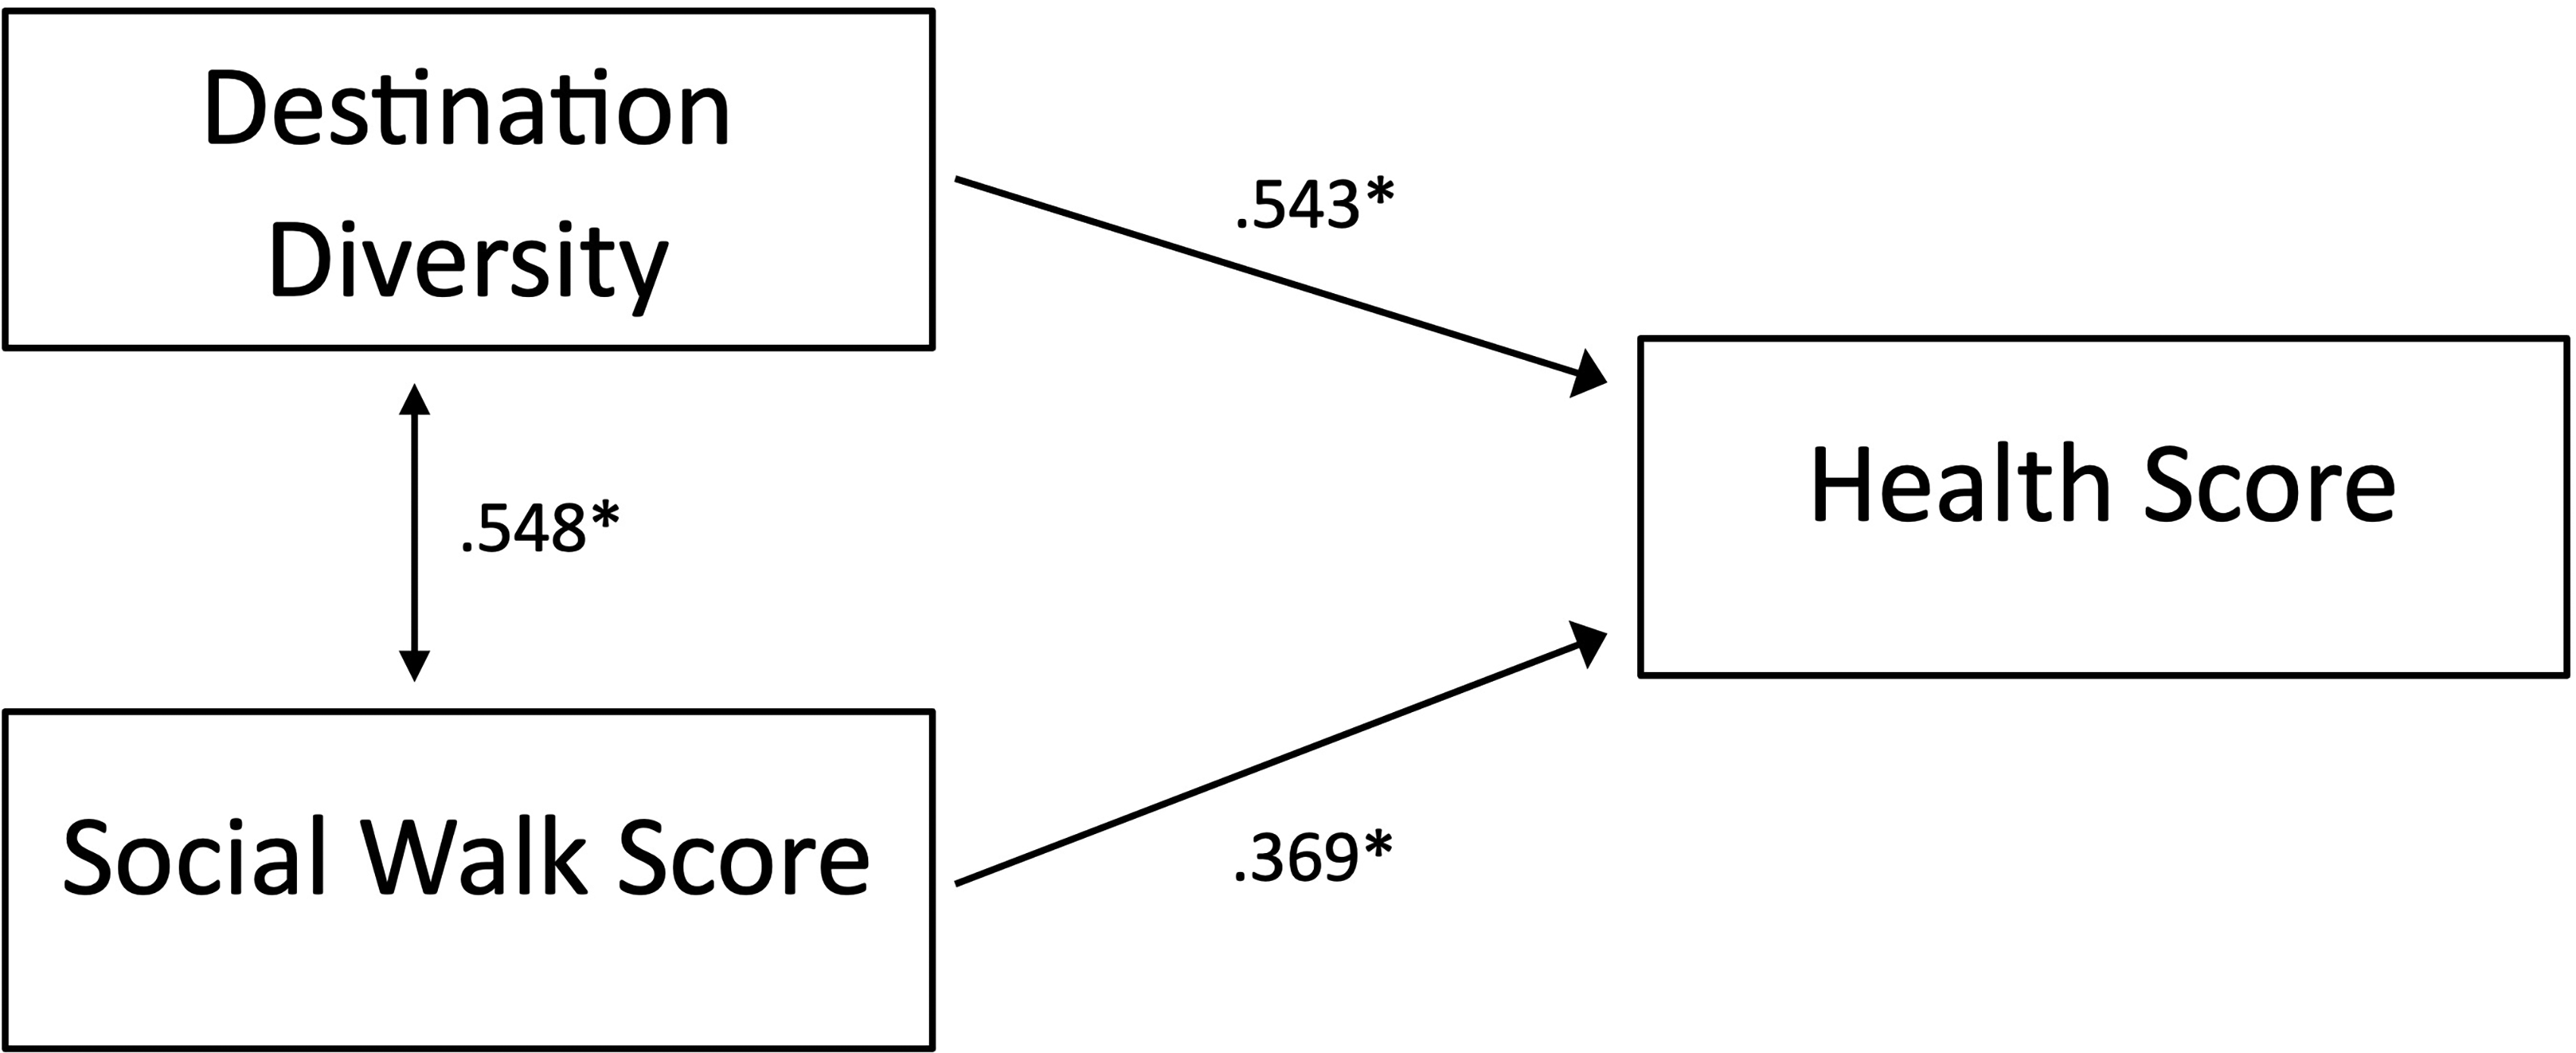
Interconnectedness of variables relating to a community’s overall health score.
Discussion
Existing literature has revealed various associations between built environment and health. Moreover, types of destinations have been scrutinized to delineate the strongest associations. Some associations that may be assumed to yield significant positive outcomes, such as proximity to parks or exercise opportunities, do not in some cases (Slater et al., 2019). However, some built environment components, such as proximity and access to groceries, are strongly associated with positive outcomes. Preliminary data indicate that some destinations are more relevant to older adults (Tung et al., 2016). The results of this study revealed similar associations.
Because many factors are associated with health outcomes, the main aim of this research was to explore the effects of walkability on health, focusing on destination diversity and opportunities for socialization. The results showed a significant association between the diversity of destinations and a community’s health score and social walk score. This finding indicates a potential relationship between social participation opportunities and a community’s health score. The results suggested that communities with increased diversity of walkable destinations have more opportunities for social engagement, leading to positive health outcomes for the community. These results are consistent with previous studies that showed social participation to be associated with improved health outcomes (Seeman et al., 1993).
Limitations
Data collection required the use of multiple third-party applications and sources. Data Axle Reference Solutions was used to collect addresses from a marketing database to efficiently collect 1,000 latitude and longitude coordinates. After addresses were collected, Geocod.io was used to convert the addresses into coordinates. These coordinates were sent to Walk Score to output the scores on the basis of “snapped” coordinates, which were slightly different because of rounding. Moreover, the returned snapped coordinates were evaluated with CVS2GEO, a reverse geocode file processing vendor, to yield the returned zip codes. Although inconclusive as to the source of the errors, this process yielded some minor anomalous data points. In future or like studies, rigorous data validation is recommended.
Implications for Occupational Therapy Practice
The field of occupational therapy is diversifying in several ways, such as increasing the number of nontraditional work settings, becoming more involved at the group and population level, and recognizing health management as a separate and more robust occupation (AOTA, 2020). In response to a changing profession with a focus more on holistic health, occupational therapy practitioners can use the data from Walk Score and the AARP Livability Index to provide more comprehensive assessments and interventions to better address client health and well-being. This study has the following implications at the individual, group, and population levels of practice: At the individual level of practice, occupational therapy practitioners may use these data in practice to address instrumental activities of daily living (including community mobility and shopping) as well as many aspects of health management, leisure, and social participation. The community data can provide practitioners with information on how to best facilitate client participation across these diverse occupations to achieve optimal health and well-being. Similarly, at the group level of practice, occupational therapy practitioners can use these data when working with groups of individuals or families in the community to address access to community resources, occupational opportunities, and social participation. At the population level of practice, these data would be highly useful to inform practices that support occupational engagement and population health when working with organizations, advocating for policy initiatives or assisting with community planning.
Conclusion
This investigation underscores the importance of social participation for a person’s health and quality of life. Health outcomes were associated with a community’s diversity of destinations and opportunities for social participation, indicating that participation in a variety of group activities contributes to community members’ well-being. Moreover, occupational therapy practitioners are aware of how integral environments are to a person’s participation and subsequent health outcomes. Using a holistic perspective and knowledge of a community’s environmental structure and resources, occupational therapy practitioners may be better equipped to improve health at the individual, group, and population levels, benefiting the health of entire communities.
Footnotes
Acknowledgments
The study was supported by funding from the Department of Occupational Therapy for dataset procurement and for a graduate assistantship for Madison Medina.