





Abstract
This study proposes a method to facilitate comparisons of children’s coloring skills with peers that can provide valuable insights into children’s development.
Coloring is a popular and enjoyable activity among preschool children, and it can be considered a form of play because of its inherent characteristics of being fun, fostering creativity, and providing a sense of accomplishment (Marfuah & Sofiah, 2021). Consequently, coloring skills can be considered an important component of essential play skills for children. Furthermore, coloring offers a multitude of developmental benefits. By engaging in coloring activities, children are able to channel their imaginations and emotions through the vivid array of colors, simultaneously practicing patience and emotional regulation through the rhythmic and repetitive motions (Carsley et al., 2015; Turturro & Drake, 2020). Coloring serves as a reflection of children’s developmental progress, encompassing cognitive abilities (Holt et al., 2019), fine motor skills (Fitrianingsih & Sari, 2019; Jumiyati et al., 2023; Oktavia et al., 2019), and visual–motor integration (Martino & Lape, 2021). For instance, a child’s aptitude for coloring can unveil their grasp of color recognition, arrangement of hues, attention span, dexterity, and eye–hand coordination. Accordingly, coloring proficiency serves as a reflective mirror of multifaceted developmental skills, providing a nuanced glimpse into a child’s growth within these specific domains.
Coloring is a common activity at home and in school, given the abundance of coloring materials and resources. Teachers have integrated coloring into early childhood education curricula, and parents have reported their children engaging in coloring activities at least once a week (Gruber & McNinch, 1994). Enhancing coloring skills is a meaningful educational objective for educators and parents alike, which serves as a tool to enrich a child’s developmental capabilities during their formative preschool years. Furthermore, owing to the entertaining nature of coloring and its reflection of several developmental facets, the assessment coloring skills offers a means for educators, parents, and pediatric practitioners to delve deeper into a child’s play skills and gauge their progress across diverse developmental dimensions such as cognition, fine motor skills, and visual–motor integration. However, currently, the scoring of coloring skill is highly reliant on subjective descriptive comments such as good, beautiful, or not seriously coloring. Although these subjective descriptions provide straightforward assessments of coloring performance, their utility is limited for two reasons. First, the descriptive comments are difficult to interpret further because the key indicators for determining coloring performance are largely unknown. Second, such subjective descriptions are difficult to analyze because of the lack of a consistent rating scale and the large variation in the descriptions. Moreover, the meanings of those descriptions could vary by person. Therefore, it is difficult to draw scientific conclusions from coloring tasks with these subjective comments. To address these issues, a quantitative scoring method with clear indicators for determining coloring skills in preschool children is needed.
Four indicators of children’s coloring skills— coloring outside the lines, unexpected blank areas, entropy, and complexity—have been proposed from drawing developmental theory (Dennis, 1984; Eddowes, 1995) and previous studies (Jumiyati et al., 2023; Oktavia et al., 2019). The first two indicators, coloring outside the lines and unexpected blank areas, are proposed on the basis of fine motor and cognitive developmental milestones. Moreover, a study by Huang et al. (2022), which investigated the relationships of coloring performance with cognition and activities of daily living in patients with dementia, identified coloring outside the lines and filling shapes completely (i.e., unexpected blank areas) as important indicators. That is, the less frequently children color outside the lines and the fewer blank spaces remain, the better their coloring skills are. These two indicators are commonly used as rating criteria in assessments of fine motor skills. For example, the Peabody Developmental Motor Scales, Second Edition, includes an item that assesses a child’s ability to color within two lines (Foli & Fewell, 2000). Therefore, these two indicators can reasonably reflect children’s levels of coloring skill.
The next two indicators were proposed by Sigaki and colleagues (Papia et al., 2023; Sigaki et al., 2018). They used entropy and complexity to capture local spatial patterns in images, which might reflect coloring skill. Entropy refers to the amount of disorder or chaos present in images, with higher levels of disorder corresponding to higher entropy ratings. Thus, entropy captures the degree of organization or disorganization in coloring patterns. Complexity, however, represents the variability of patterns within an image, ranging from simplicity to complexity. Given the typical progression of children’s motor and cognitive development (Nugroho et al., 2021), it is expected that children’s coloring abilities will evolve from disordered (scribbles) to ordered patterns and from simplicity (single color and simple patterns) to complexity (varied colors and intricate patterns; Lowenfeld & Brittain, 1987).
The four aforementioned indicators demonstrate potential for scoring children’s coloring skills. Thus, in this study, we aimed to use these four indicators to quantify children’s coloring abilities comprehensively from a coloring task. Moreover, the psychometric properties of this scoring method were also examined.
Method
Participants
This study was part of a large project utilizing artificial intelligence to assess children’s motor skills, emotion states, and attention (Lin et al., 2023). Children who met the inclusion criteria (1) were between 3 and 6 yr old; (2) could successfully follow commands of at least two steps given by the researchers for completing the coloring activity and the Beery-Buktenica Developmental Test of Visual–Motor Integration, Chinese version (Beery VMI–C); and (3) agreed to be recorded on video. Our study participants were kindergarten children from Tainan City. A total of 239 children, mean age = 4.91 yr (SD = 0.98), were recruited in our study, and approximately half of them (49.8%) were boys. Among the children, about 5% to 6% had a diagnosis of developmental delay or disability, and about 8% had received rehabilitation services (e.g., occupational therapy and physical therapy). The majority of these children came from families within the middle- class bracket, with a monthly family income ranging from NT$50,000 to NT$100,000. Additionally, a significant number of parents possessed a college degree (mothers: 60.3%; fathers: 51.9%). A majority of the children (56.9%) resided solely with their parents. Table 1 shows the demographics of the participants. A sample size over 200 was considered adequate for factor analysis (Comrey & Lee, 2013). This study was approved by the institutional review board of a medical center in Taipei, Taiwan.
Demographic Characteristics of the Participants
Note. N = 239.
Measures
Coloring Activity
An A4-sized sheet of paper with a train template design was provided for the children to color. The train was composed of basic shapes—squares, triangles, circles, and rectangles of different sizes—and it was printed on the top half of the paper (see Figure A.1 in the Supplemental Material, available online with this article at https://research.aota.org/ajot). The train was intentionally designed to include both large and small sizes, incorporating a variety of shapes suitable for preschool children in Levels K1 to K3 (3–6 yr old). To ensure its appropriateness, we sought validation after designing it. We invited two experienced pediatric occupational therapists to assess its suitability for preschool children. Both pediatric occupational therapists unanimously affirmed the train’s suitability for this age group.
Beery-Buktenica Visual–Motor Integration, Chinese Version
In our study, we administered the Beery VMI–C as a measure of convergent validity for coloring skill (Liu & Lu, 1999). The Beery VMI–C consists of 27 items that necessitate children to imitate or copy geometric shapes. A higher sum of scores on this measure indicates a better ability of visual–motor integration. The Beery VMI–C has demonstrated excellent psychometric properties (Liu & Lu, 1999).
Procedure
To recruit participants, we contacted the school principal by phone to establish communication and provide an overview of our research project. Once the principal expressed willingness to participate in our study, we disseminated the research cover letter and recruitment notice to parents through the school teachers. Parents who indicated their agreement to partake in the research returned the response forms to our team also through teachers. Subsequently, researchers provided the parents with the informed consent documents. On receiving the informed consent documents from parents, researchers organized the group evaluation sessions within the kindergartens. The group evaluation included activities of coloring, origami, and copying a person, which were designed by the research team. The Beery VMI–C was also administered to each child. Each group consisted of three to six children, and the entire administration time lasted approximately 40 to 50 min. After the group activities, the researchers scanned the colored pictures.
Data Analyses
Four indicators were computed from the colored images, including entropy, complexity, coloring outside the lines, and unexpected blank areas.
The entropy was calculated using the following formula:
where P is the probability distribution =
The complexity was calculated using the following formula, which captures the degree of structural complexity present in the aforementioned matrix:
where
where
We assessed the coloring outside the lines by the following steps. First, the colored images were converted into grayscale images. Second, the contours of the colored train were drawn using the OpenCV programming function. Third, the contour image was converted into a binary image (Table A.2a). Finally, we assessed the white regions of the binary image, including the whole train image and the areas where the coloring was outside the lines.
The area of unexpected blank areas was calculated using the following steps. First, we merged the black-and-white image obtained as described in the previous paragraph with the grayscale image to create a new image (Table A.2b). Next, we identified and measured the blank areas in the new image, which were then classified as unexpected blank areas.
Among the four indicators, smaller values of entropy, coloring outside the lines, and unexpected blank areas indicated better coloring skill, whereas larger values of complexity indicated better skill. To sum up the four indicators to represent coloring skill, and for easier understanding by the readers, we further added minus signs to the values of entropy, coloring outside the lines, and unexpected blank areas to transform the scale. The four indicators were transformed into z scores and summed up to represent the coloring skill (i.e., the coloring skill index).
The psychometric properties of the scoring method were examined, including internal consistency, convergent validity, discriminant validity, and construct validity. To examine the internal consistency, we used Cronbach’s α. Cronbach’s α higher than .8 and .7 indicated good and acceptable internal consistency, respectively (Ertaş et al., 2004).
To examine the convergent validity, we used Pearson’s r to calculate the correlations between coloring skill index, the Beery VMI–C scores, and the children’s chronological ages. A Pearson’s r greater than .5 indicated good convergent validity.
To examine the discriminant validity, we compared the scores between the typically developing children and those with a developmental delay or disability. The developmental delay or disability was coded on the basis of caregivers’ reports. The differences in gender and age were examined initially. If significant differences in gender or age existed between the two groups, an analysis of covariance would be used, with gender and age as covariates. If gender and age were not significant, an independent t test would be used for comparing the two groups. Significant differences in coloring skill between the two groups indicated good discriminant validity.
Construct validity was examined using confirmatory factor analyses. Model fit was examined with the following fit indexes: the root-mean-square error of approximation (RMSEA), the comparative fit index (CFI), the goodness of fit (GFI), and the standardized root-mean-square residual (SRMR). RMSEA ≤ .05, CFI > .95, GFI > .95, and SRMR < .8 indicate good model fit.
Coloring Patterns From the Four Indicators
A two-step cluster analysis was then applied to the four indicators to classify children’s coloring patterns. First, a hierarchical method was used to explore the potential clusters. A tree diagram was used to help inspect the potential clustering. Second, we used K-means clustering to identify the final clusters. After the clusters were identified, we used an analysis of variance to investigate the differences among the four indicators as well as the coloring skill index, VMI scores, and ages to explore the characteristics of the identified clusters.
Results
Internal Consistency of the Coloring Skill Index
The results of our study showed that Cronbach’s α was .80, indicating good internal consistency.
Convergent Validity of the Coloring Skill Index
The coloring skill index was moderately correlated with age (r = .59, p < .05) and visual–motor integration (r = .66, p < .05).
Discriminant Validity of the Coloring Skill Index
Because age and gender were not significant differences between the typically developing group and the developmental delay or disability group (p < .05), the t test was used to examine differences in coloring skill. The average scores for coloring skill were 0.10 (SD = 3.10) and −1.74 (SD = 3.78) for children without and with developmental delay or disability, respectively. A significant difference in coloring skill existed between the two groups (T = 2.05, p = .04).
Construct Validity of the Coloring Skill Index
Because the complexity was calculated from entropy, which was anticipated highly correlated, a correlation between these two indices was added in the model. The results of the confirmatory factor analyses found that the fit indexes of the one-factor model were acceptable: χ2(1) = 7.93, CFI = .99, GFI = .98, SRMR = .036, and RMSEA = .13. Figure 1 shows the factor structure and factor loadings of coloring skills.
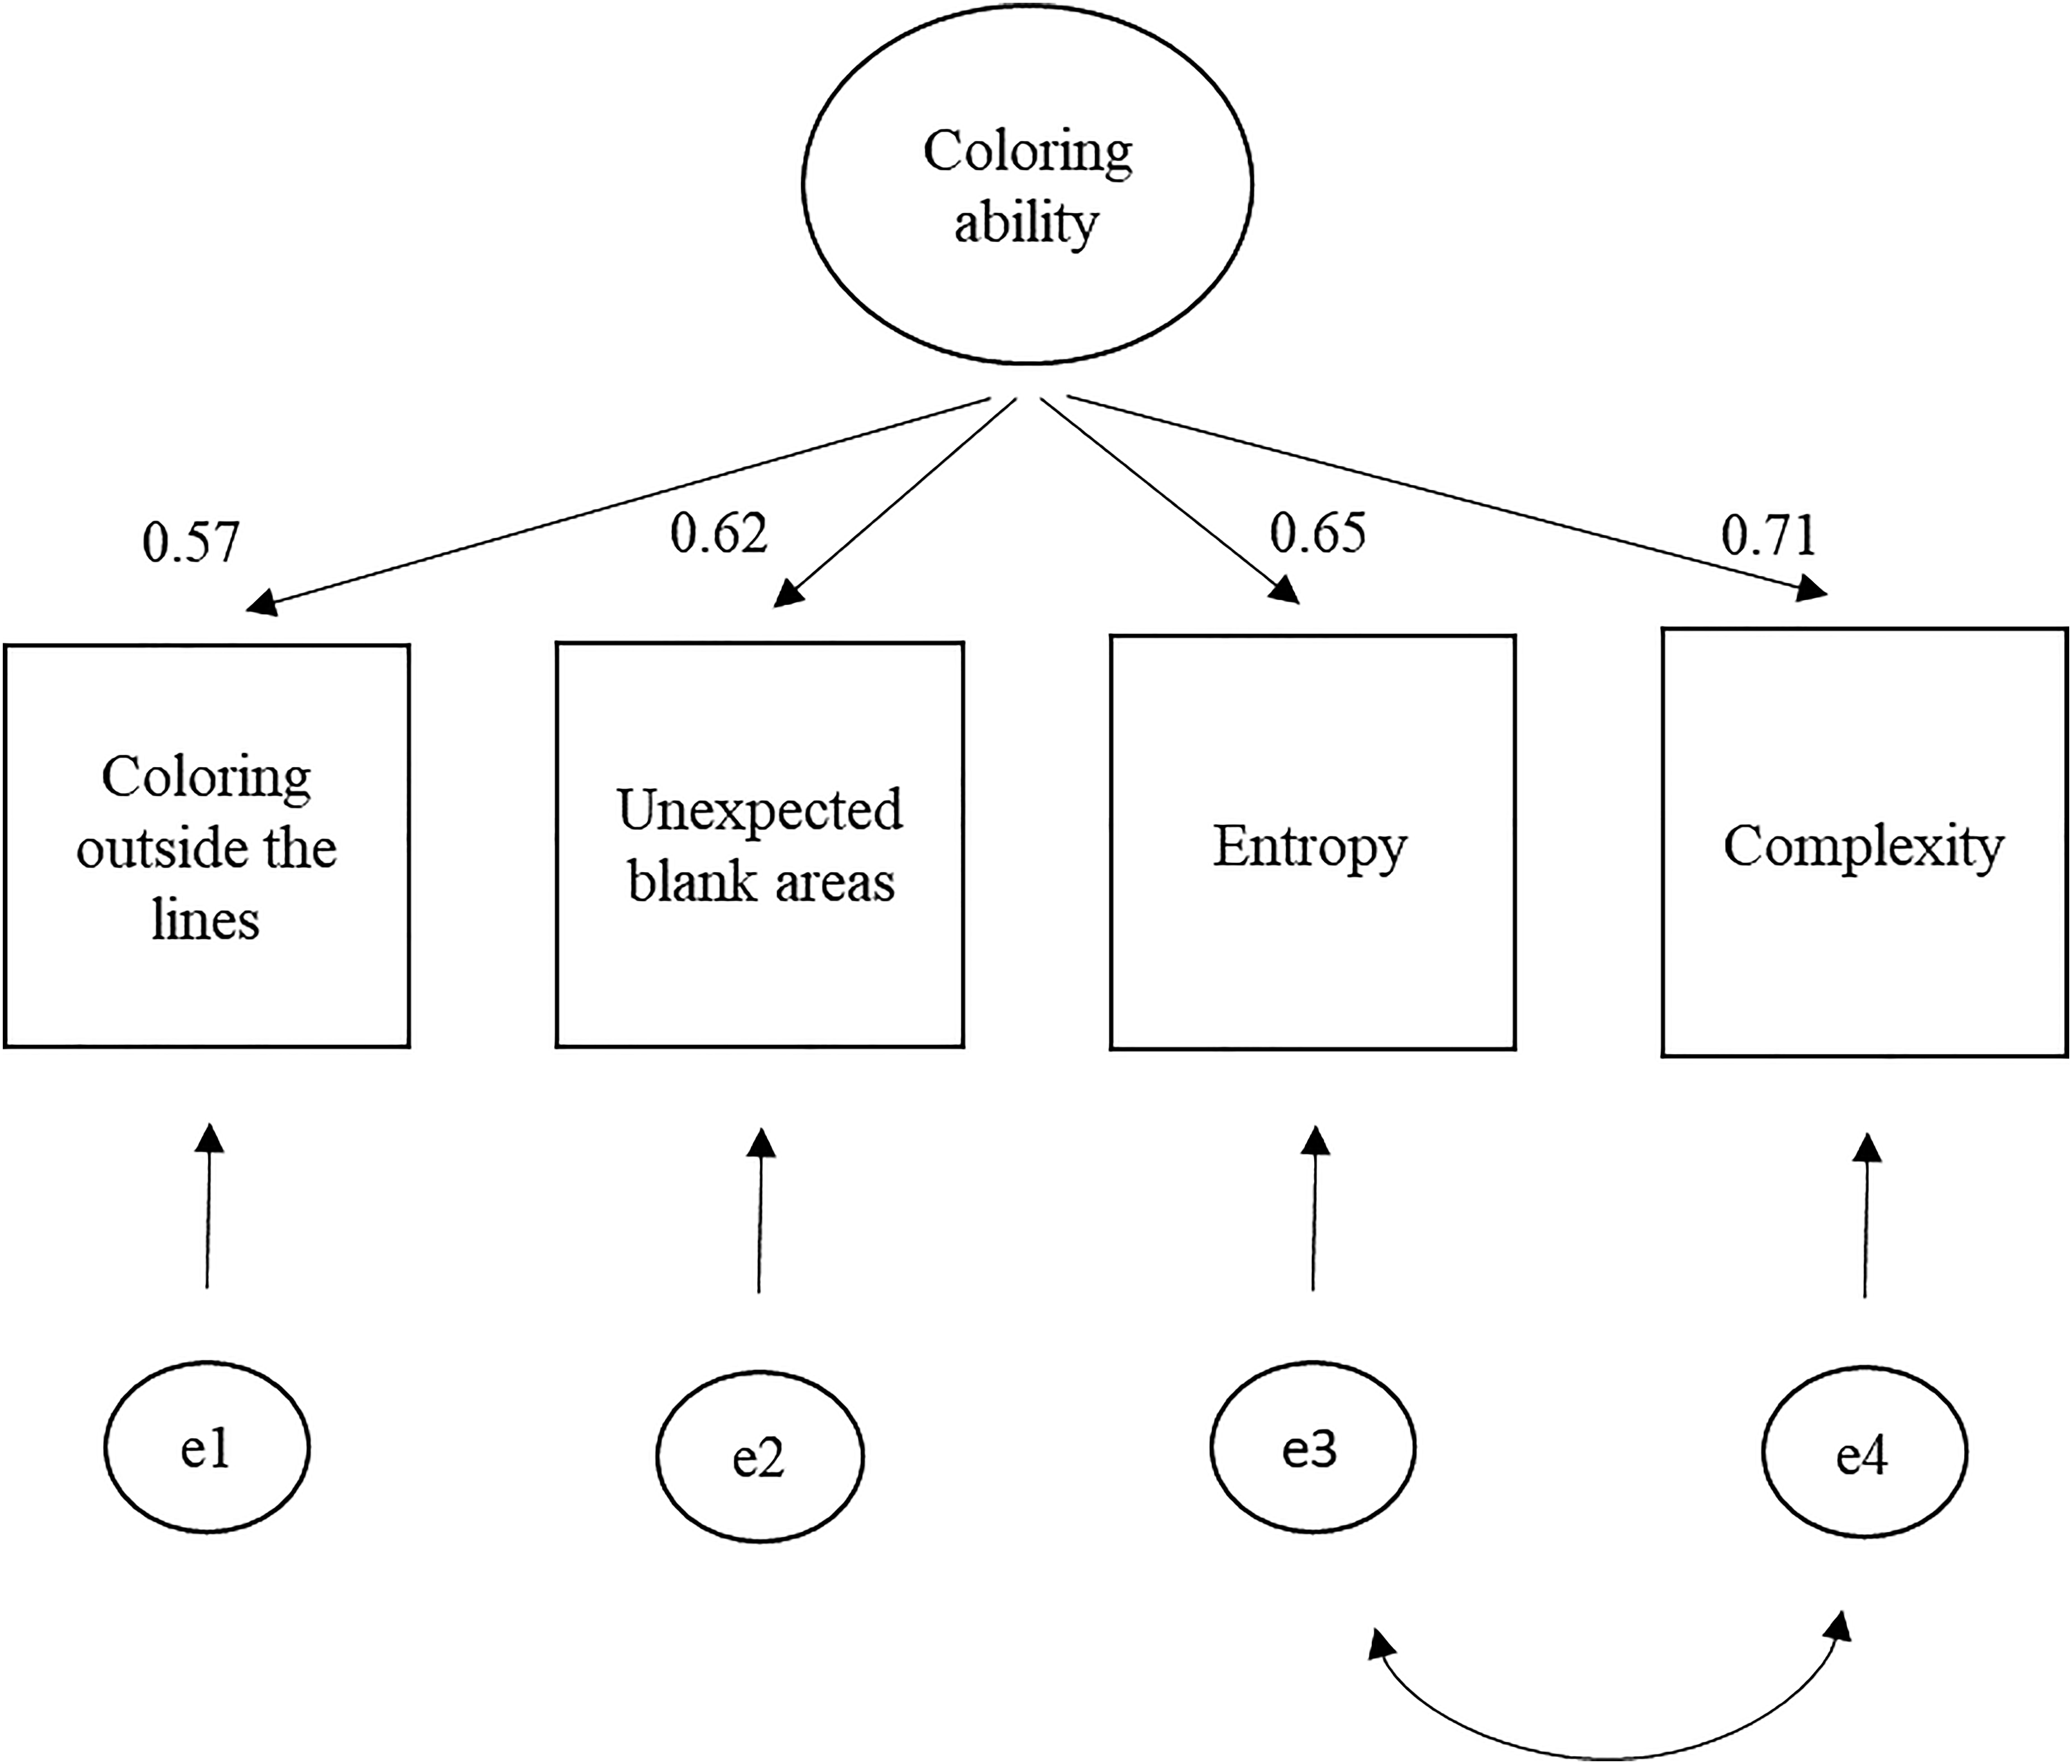
Factor structure and factor loadings of the coloring skill.
Coloring Patterns Classified From the Four Indicators
Three potential clusters were identified from the tree diagram of the hierarchical method (Figure A.3). Therefore, three clusters were applied to the K-means clustering analyses. The results showed three distinct clusters of children’s colored pictures. Significant differences in the four indicators, coloring skill, VMI scores, and ages were found among the three clusters (Table 2). Post hoc analyses showed that the four indicators, coloring skill index, VMI scores, and ages were best or highest in Cluster 1, followed by Cluster 2 and then Cluster 3. We further inspected a cross-table of children’s ages and the clusters (Table A.4). In Cluster 1, most of the children were between 6.0 and 6.4 yr old (n = 28 of 106; 26.4%); in Cluster 2, most were between 4 and 5 yr old (n = 52 of 122; 42.6%); and in Cluster 3, most were 3 yr old (n = 9 of 11; 81.8%). According to the characteristics of the pictures in the three clusters, they could be termed mature coloring (Figure 2A), transitional coloring (Figure 2B), and immature coloring (Figure 2C).
Coloring Patterns Identified From the Four Indicators
Note. Beery VMI–C = Beery–Buktenica Developmental Test of Visual–Motor Integration, Chinese version.
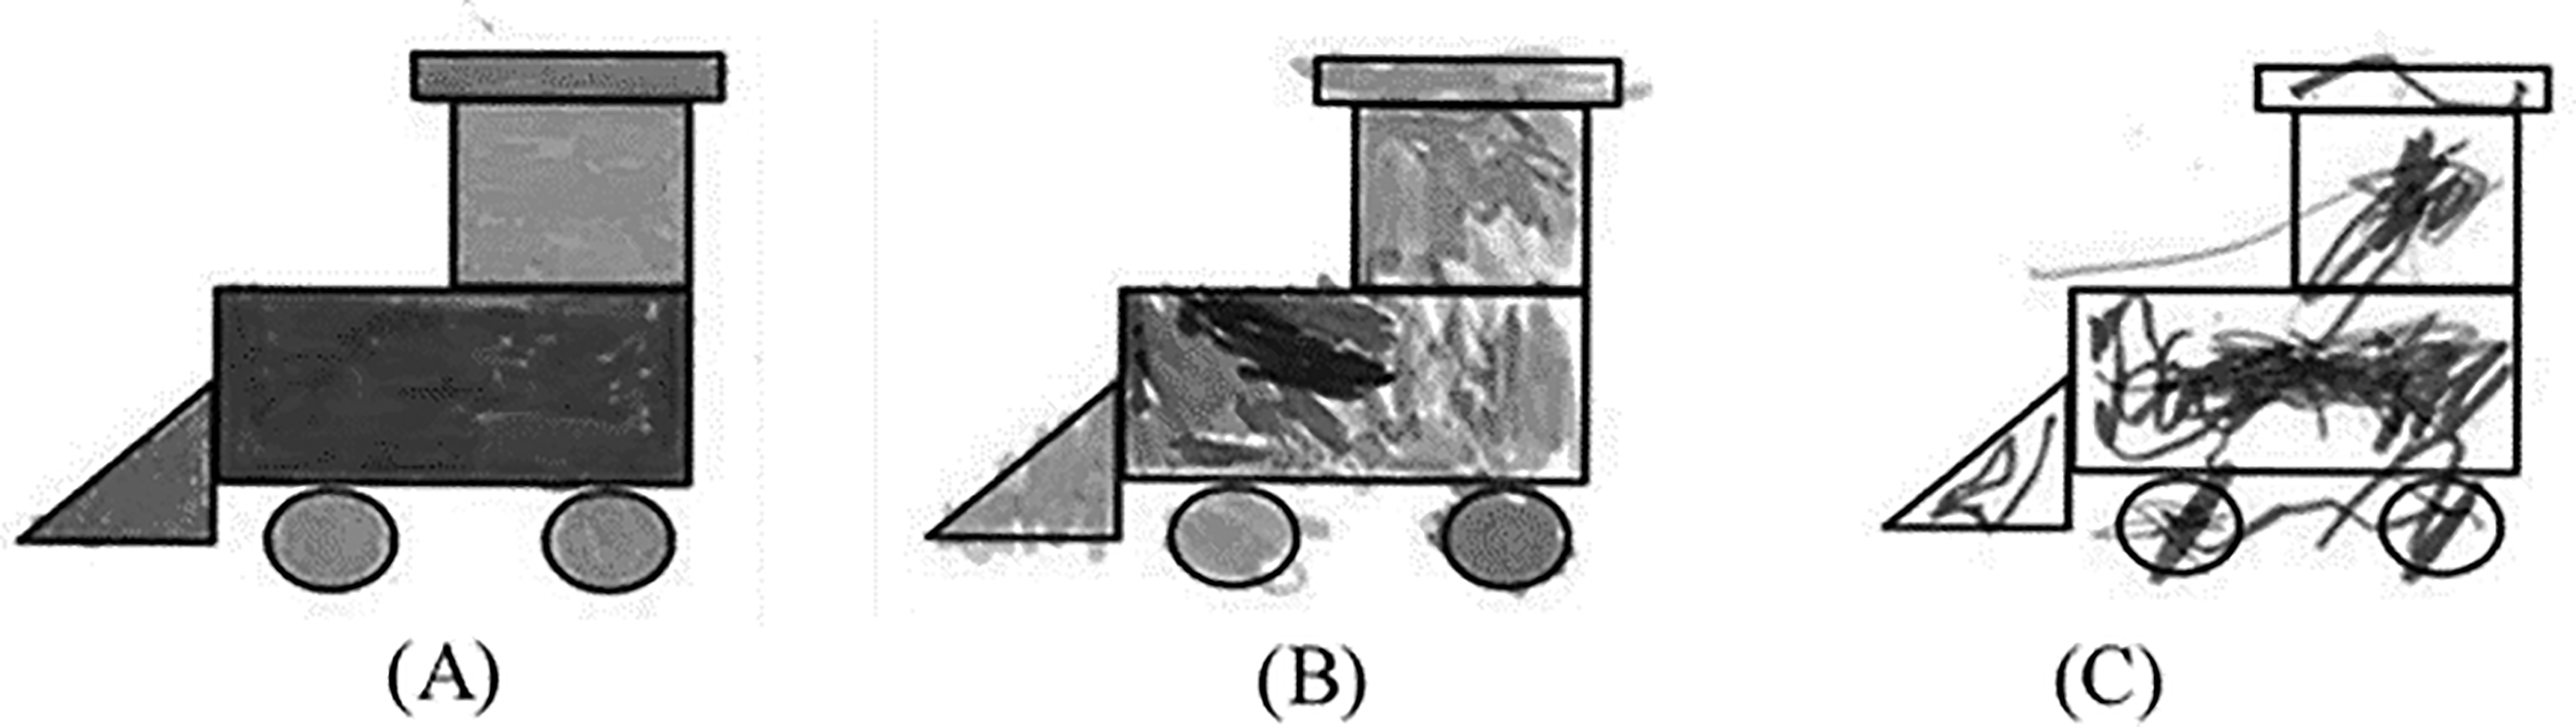
Examples of the pictures in the three clusters.
Discussion
The coloring skill index showed adequate correlations with the children’s ages and VMI scores, and it was discriminative between children with and without developmental delay. Furthermore, data–model fits were adequate to good, which suggested that the four indicators assess the same latent trait and supported its good factorial validity (Byrne, 1998). Accordingly, the scoring method is a valid indicator for assessing coloring skills in preschoolers.
The internal consistency of the four indicators (.8) exceeded the criterion for group-level comparisons (.7; Huang et al., 2016). This finding suggests that the overall coloring scores can reliably assess children’s coloring performance. Although the Cronbach’s α of the coloring skill index was lower than a criterion for individual-level comparisons of .9, it is still a promising result, because the Cronbach’s α tends to increase with more items (Tavakol & Dennick, 2011). Considering that the scores were calculated on the basis of only four indicators, the present reliability is satisfactory.
The four indicators match the graphic development theory (Lowenfeld & Brittain, 1987), which categorizes preschool- and school-age children’s drawings into four stages: scribbling (2–4 yr), preschematic (4–6 yr), schematic (7–9 yr), and drawing realism (9–11 yr). During the scribbling stage, children focus more on drawing lines, orientations, and forms than on the use of colors, which results in the use of simple colors with rough scribbles. As children progress to the preschematic and schematic stages, children become more focused on the meanings of the colors, and their fine motor skills develop to allow them to color within the lines. Consequently, their coloring tends to be more complex and organized. Thus, the meaning of the four indicators is supported.
Children’s coloring skill can be classified into three distinct levels: mature, transitional, and immature coloring. In general, mature coloring typically emerges after the age of 5, transitional coloring tends to manifest between the ages of 4 and 5, and immature coloring is commonly observed at the age of 3. These findings can serve as valuable references for parents, clinicians, and teachers, and they highlight the importance of encouraging coloring activities for children in the middle preschool stage. For example, if a child demonstrates immature coloring, filling blanks with various shapes may be promising practice for them. Such coloring activities can provide the “just-right” challenge and can conceptually optimize their improvement in coloring.
On the basis of our research findings, our team envisions the creation of a user-friendly application or cloud-based platform for evaluating coloring skills. This digital platform will provide a train template that is seamlessly integrated with our developed scoring mechanism. Future users will be able to capture images of their colored train drawings and then upload them to the digital platform. The platform will perform automated analysis of the images and provide the developmental stages of coloring skills. Furthermore, the platform will facilitate the comparison of a child’s coloring skills with those of their peers. This innovative tool has the potential to revolutionize the assessment of children’s development and, thus, benefit parents and practitioners. It will guide the formulation of targeted intervention strategies and provide a more precise understanding of a child’s development. Additionally, educators can use this application as an initial developmental screening tool, particularly during a child’s transition to kindergarten. The diverse applications of this coloring skill assessment methodology extend the implications of our study beyond academic research, actively contributing to real-world educational and therapeutic settings. It is important to note that the coloring skill quantified in our study was a specific skill unrelated to the sense of use of colors (or aesthetic feeling). The entropy and complexity indicators measure children’s understanding of coloring concepts, whereas coloring outside the lines and unexpected blank areas measure their motor skills. Our method of assessment does not evaluate whether a child uses appropriate colors or whether the colored image is aesthetically pleasing. Instead, our focus is on evaluating how well a child can execute a coloring activity. Prospective users may access the authors to access the algorithm.
Coloring performance may be influenced by societal and cultural contexts. The sample in our study can be largely considered representative of the typical urban Taiwanese child population, because the majority of these children came from families within the middle-class bracket in an urban city. It is important to note that coloring performance among children from other regions, such as suburban or rural areas, might include variations. Future studies for cross- validation are advised to take children’s geographical and cultural contexts into consideration and recruit participants from more diverse regions.
Study Limitations
Two limitations should be acknowledged. First, the participants were recruited from one kindergarten. Thus, the generalizability of our findings is limited. Second, color pens running out of ink because of repeated use might have affected the accuracy of the calculated complexity and unexpected blank areas. However, only a few pictures (less than 15) were affected, so the findings may not be significantly influenced.
Implications for Occupational Therapy Practice
The findings of this study have the following implications for occupational therapy practice: The new method can provide objective, reliable, and valid scores representing children’s coloring skills. Therefore, children’s coloring performances can be compared with those of their peers, contributing valuable insights into their developmental stages. The coloring patterns can be reorganized by the method. Thus, the targets of interventions may be optimized depending on their current patterns and those of the next level.
Conclusion
The new scoring method had good reliability and validity among preschoolers. Therefore, the method can be used to identify children’s coloring skills, compare their performances with peers, and gain valuable insights into children’s engagement with coloring tasks.
Supplemental Material
Supplementary material for Quantifying Coloring Skills Among Preschoolers
Supplementary material, sj-pdf-1-aot-10.5014_ajot.2024.050519.pdf for Quantifying Coloring Skills Among Preschoolers by Chien-Yu Huang, Gong-Hong Lin, Szu-Ching Lu and Shih-Chieh Lee in The American Journal of Occupational Therapy
Footnotes
Acknowledgments
We appreciate all the caregivers, children, and teachers in kindergartens who referred children. This study was supported by National Science and Technology Council (NSC113-2636-B-002 -008, NSC 112-2636-B-002 -014, NSC 111-2636-B-002 -023, NSC 110-2628-B-006 -031, NSC 110-2636- B-002 -023, and NSC 109-2628-B-006-023). We have no conflicts of interest to disclose, and we agree with the stated authorship and contributions of this article. We report how we determined the sample size, all data exclusions, all manipulations, and all measures in the study.
References
Supplementary Material
Please find the following supplemental material available below.
For Open Access articles published under a Creative Commons License, all supplemental material carries the same license as the article it is associated with.
For non-Open Access articles published, all supplemental material carries a non-exclusive license, and permission requests for re-use of supplemental material or any part of supplemental material shall be sent directly to the copyright owner as specified in the copyright notice associated with the article.
