





Abstract
When choosing interventions that support the overall well-being of their clients with mental illness, occupational therapists can use the Text–Picture Integration Scale to predict the public’s perspectives on mental illness.
The stigma surrounding mental illness poses challenges for individuals in recovery, originating from a lack of public understanding and the tendency to label others. Sanism, a form of ableist bias distinguishing between normal and abnormal minds, leads to discrimination against people with mental illness (Harrison et al., 2021; Wolframe, 2012). Historical beliefs and negative media coverage reinforce stereotypes (Rössler, 2016 ; Stuart, 2006), and people associate mental illness with risk factors, leading to further stigmatization (Zissi, 2022).
Mental illness stigma carries particularly negative social implications, including discriminatory practices, heightened stress levels, social isolation, and internalization of negative beliefs by stigmatized individuals. These challenges are fundamental to health inequality and substantially affect population health (Hatzenbuehler et al., 2013). The adverse consequences for individuals with mental illness include housing discrimination, unemployment, and social isolation (Jacobs & Quinn, 2022). Moreover, stigma obscures the social determinants of poor health outcomes and undermines the effectiveness of public health interventions (Hatzenbuehler et al., 2013). Occupational therapy practitioners are vital in advocating for broad social change that combats the impediments faced by those affected by mental illness stigma, upholding their right to participate in society fully and addressing health disparities and occupational injustices (Harrison et al., 2021).
In the Environment, Health, Occupation, and Well-Being model, occupational therapy is pivotal in promoting health, well-being, and quality of life (Pizzi & Richards, 2017). However, mental illness stigma has a negative effect on people’s overall well-being and presents significant barriers to accessing services (Burwash & Norell, 2017). Stigma is deeply ingrained in social relationships and influenced by culture and societal structures; addressing stigma requires targeted interventions focused on these social relationships and underlying structural factors (Goffman, 1963; Pescosolido, 2013). Regarding psychosocial occupational therapy and transdisciplinary models in clinical practice, the Recovery Model is currently the guiding vision for mental health service delivery internationally and the most widely applied approach in mental health systems and service delivery in today’s mental health policy and practice context (Pitts & McIntyre, 2016). Destigmatization plays a crucial role at every stage of the model’s five recovery processes—Connectedness, Hope and Optimism about the Future, Identity, Meaning in Life, and Empowerment (Leamy et al., 2011). Eliminating the public stigma surrounding mental illness is essential to establish social support (Connectedness), assist patients in fostering self-acceptance (Identity), and cultivate a positive mindset (Hope and Optimism About the Future) in order to lead a meaningful life within society (Meaning in Life) and take responsibility for one’s well-being (Empowerment).
The relationship between the Person–Environment–Occupation (PEO) model and occupational engagement influences an individual’s recovery (Bejerholm & Eklund, 2007; Lexén et al., 2013; Merryman & Riegel, 2007; Strong, 1998). According to the PEO model, the dynamic interconnections among people, their occupations and roles, and the living environment result in occupational performance (Law et al., 1996). Environments, which include physical, social, and political domains, determine PEO interactions and influence occupational performance and well-being. In the social environment, individuals living with mental illness often encounter high levels of stigma and discrimination. They are frequently denied opportunities in areas such as employment, housing, education, and even social relationships (Rigby & Kirsh, 2016). A wealth of evidence highlights the prevalence of stigma, and people living with mental illness frequently face elevated unemployment rates in comparison with the general population (Brouwers, 2020), and they frequently express encountering unsupportive interactions with colleagues and superiors in their workplace (Stuart, 2004; Wahl, 1999). In conclusion, the stigma associated with mental illness is one of the main obstacles to achieving complete social integration and participation, both in the environment and in the recovery process (Pitts & McIntyre, 2016). Identification of the factors contributing to stigmatization will inform the implementation of strategies for stigma reduction and increase resilience for people with mental illness.
Models and Frameworks Related to the Stigma of Mental Illness
The Stereotype Content Model (SCM) is a theoretical framework in social psychology predicting systematic variations in stereotypes, emotional prejudices, and discriminatory behavior toward social out-groups (Fiske et al., 2002; Sadler et al., 2012). According to this framework, social judgments are fundamentally based on the dimensions of warmth and competence. Warmth refers to the perception of an out-group as having either benevolent or malevolent inclinations toward oneself or one’s in-group, and competence indicates a group’s ability to successfully execute its goals (Fiske et al., 2007). When the public attributes individual behaviors to mental illness, negative stereotypes, such as the perception of danger, foster social rejection and changes in self-identity (Corrigan et al., 2003). Although mental illness is mainly genetic and biological in origin, as opposed to being personality-based, there is a persistent correlation between the perception of individuals with mental illness as dangerous and the tendency to distance oneself from affected individuals (Pescosolido et al., 2010). In the SCM, the perception that mental illness poses a danger to the public reflects a lack of warmth (Sadler et al., 2012), whereas perceiving people with mental illness as dependent, incapable of appropriate decision making, and lacking competence (Pescosolido et al., 2010). Thus, research has suggested that the SCM may help to clarify the content of stereotypical beliefs linked to mental illness (Sadler et al., 2012).
Understanding the origins of social stigmatization is crucial; attribution theory explains the relationship between stigmatizing attitudes and behaviors (Weiner, 1995). Corrigan et al. (2003) developed the attribution model, examining causal attributions, familiarity, perception of danger, emotional responses, and behaviors by studying mental health–related discrimination. Study findings were congruent with the principles of attribution theory, indicating that familiarity with mental illness moderates stigmatizing behavior. Enhanced understanding of mental illness is linked to greater compassion and reduced feelings of anger toward and fear of individuals affected by it. Additionally, discriminatory behaviors increase when the media characterize individuals with mental illness as dangerous (Rössler, 2016).
Interventions targeting public attitudes and behavior can reduce stigma and discrimination toward individuals with mental illness (Brandt et al., 2022; Corrigan et al., 2012; Oexle et al., 2018). To address this, it is essential to comprehend the factors related to stigma with respect to mental illness in the public. Therefore, we used the SCM (Fiske et al., 2002; Sadler et al., 2012) and the Attribution Model (Corrigan et al., 2003) to create a scale aimed at exploring the public’s perceptions of mental illness.
Exploring Previously Developed Scales: Insights and Limitations
Corrigan et al. (2003) developed the Attribution Questionnaire–Short Form (AQ–27) on the basis of Attribution Theory. The AQ–27 is a 27-item, self-administered measure of stigmatizing attitudes toward and beliefs about people with mental illness. It is divided into nine subscales—Blame, Anger, Pity, Help, Dangerousness, Fear, Avoidance, Segregation, and Coercion—each of which consists of three questions. However, the factors responsible for eliciting these attitudes and beliefs require explicit clarification. Although the AQ–27 is a valuable tool for assessing stigmatizing attitudes and beliefs related to mental illness, it does not provide an in-depth explanation of the underlying causes or reasons for the specific reactions observed.
The Mental Illness Attitudes and Perceptions Scale (Chen et al., 1991) is a comprehensive assessment tool consisting of 71 items designed to measure attitudes and perceptions related to mental illness. However, the scale has certain limitations, such as its extensive number of items, which affects their readability and can overwhelm participants. Additionally, some concepts or similar ideas may be repeated across the domains, leading to redundancy, such as the items “mental illness caused by strict parenting,” “mental illness caused by lack of parental affection,” and “mental illness is a result of inadequate childhood care.” These items all explore the impact of the childhood environment on mental health. Despite these drawbacks, the scale covers five important domains: Attitudes Toward Individuals With Mental Illness, Folk Beliefs About Mental Illness, External Environmental Causal Factors, Community Inclusiveness Toward Individuals With Mental Illness, and Life-Event Causal Factors. This broad coverage allows for a multifaceted understanding of attitudes and perceptions related to mental illness, considering various factors related to individuals, societal beliefs, and environmental influences.
The Perceived Psychiatric Stigma Scale (Han & Chen, 2008) consists of 25 items divided into three domains: Social Rejection and Devaluation by Others, Barriers to Marriage and Partnership, and Self-Imposed Negative Labels. However, it is essential to note that this scale often uses self-stigmatizing language in item content descriptions (e.g., “If I had a mental illness . . . ”) that primarily emphasize self-stigma.
In contrast to the approaches of these scales, we aimed to create a measurement tool that offers a different perspective on assessing mental illness stigma. The questionnaire structure uses the format “You believe that . . .” to explore public stigma, as opposed to emphasizing self-stigma. This change in approach enables researchers to more effectively assess people’s attitudes toward mental illness in real-world situations and tackle contemporary societal challenges related to mental health.
Rationale for the Text–Picture Integration Scale for Perspectives on Mental Illness
Existing stigma attitude scales for mental illness mostly rely on textual descriptions, and a single measurement item often contains multiple questions (Chen et al., 1991; Han & Chen, 2008). According to Cognitive Load Theory, prolonged reading inhibits responsivity because of the limited capacity of working memory (Sweller, 1988). The researchers involved in the current study observed that when participants completed the Theory of Mind scale, the picture-based questions elicited higher levels of empathy than the word-based questions. Visual understanding, according to multimedia learning theory, is more accessible than text interpretation and facilitates mental representation (Eitel & Scheiter, 2015; Schnotz, 2014). Pictures are not only more effortless to recognize and process than words but also more straightforward to recall (Dewan, 2015). The cognitive ability to comprehend, remember, reason, solve problems, and make decisions depends on a rich combination of words and images (Reed, 2021).
The current study used the Integrated Model of Text and Picture Comprehension in developing a scale to assess people’s perspectives on mental illness. The items are presented with an accompanying image, which can convey multiple ideas simultaneously, thus requiring fewer items in one scale to convey multiple concepts. Moreover, including illustrations in textual content has been noted to enhance comprehension and foster effective learning (Dewan, 2015). Therefore, we felt that adopting a design that integrated both text and pictures would enhance respondents’ visual processing and comprehension, ultimately leading to more precise and efficient test outcomes.
On the basis of a literature review, the Text-Picture Integration Scale integrated eight significant issues of mental illness stigma—attitudes toward individuals with mental illness, folk beliefs about mental illness, external environmental causal factors, community inclusiveness toward individuals with mental illness, life-event causal factors, social rejection and devaluation by others, barriers to marriage and partnership, and self-imposed negative labels (Chen et al., 1991; Han & Chen, 2008). On the basis of recent discussions among the authors, however, the study was expanded to effectively evaluate individuals’ attitudes toward mental illness in real-world scenarios and address prevalent contemporary societal concerns related to mental illness. As a result, two additional domains, Aggressive Misconceptions and Employment Obstacles, were incorporated, resulting in a 10-domain scale for assessing perceptions of mental illness.
To effectively predict the emotional responses of the public to mental illness, we incorporated textual descriptions of scale items drawn from the AQ–27 (Corrigan et al., 2003). These items encompass emotional reactions, perceived dangers, beliefs regarding personal responsibility, and discriminatory reactions, as proposed in the literature. Thus, we aimed to more comprehensively examine the relationship between stigma and public perspectives on mental illness to obtain greater and more complex insight. Consequently, the primary objective of this study was to establish the Text–Picture Integration Scale for Perspectives on Mental Illness and rigorously assess its reliability and validity. The scale is explicitly designed to gauge the public’s viewpoint on mental illness, thereby contributing to the expanding body of research addressing the stigmatization of mental illness.
Method
Development of the Scale
The initial version of the scale consisted of 10 domains, each of which had 2 items, resulting in 20 text-based items. Subsequently, we developed a set of 20 items integrating textual descriptions and pictures based on them. Because existing research has demonstrated a correlation between colors and emotional and behavioral responses (Briki & Hue, 2016; Kawai et al., 2020), we mitigated the potential influence of color by presenting the images in black and white. This ensures that color-associated emotions and chromatic preferences do not affect participants’ interpretation. Labeling Theory (Link & Phelan, 2001) posits that labels suggesting abnormality may trigger negative perceptions and stereotypes. Consequently, the scale uses visual cues rather than labeling words to depict individuals with mental illness. In each item, figures are surrounded by a stylized raincloud representing their unique mental health challenges while maintaining aesthetic consistency with figures representing the general population (see Figure 1).
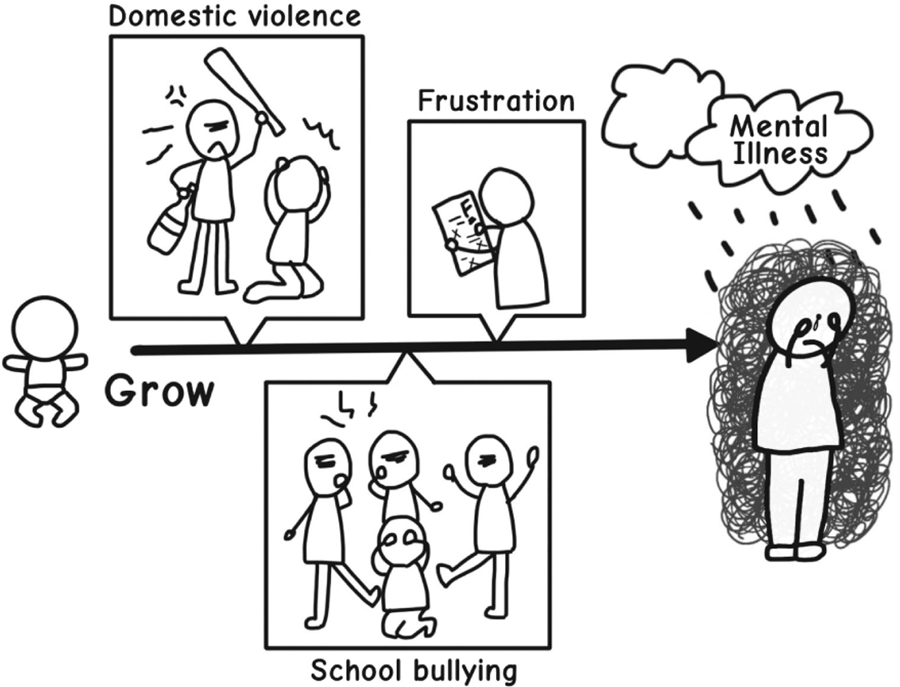
Example of a scale item.
Six experts, including three occupational therapists, two psychiatric social workers, and one clinical psychologist, evaluated the scale to establish expert validity at the expert evaluation stage. They assessed the relevance of each item to the scale’s domains (1 = not relevant, 2 = slightly relevant, 3 = relatively relevant, 4 = very relevant) and indicated their satisfaction level (1 = dissatisfied, 2 = somewhat satisfied, 3 = satisfied, 4 = very satisfied). Satisfaction ratings allowed for comparison between specific items, with a ranking of 1 indicating higher quality. After incorporating the experts’ suggested revisions and conducting a comprehensive evaluation of relevance and satisfaction, the scale underwent modifications in the wording of textual components and the design of the corresponding illustrations. Items with relevance and satisfaction ratings of 3 or higher were retained. Within each of the 10 domains, the item with the highest score based on expert evaluations was selected. The result is a 10-item scale presented in a text–picture format, scored on a Likert scale, with negative statements reverse scored.
Mental Health Literacy Scale
Mental health literacy encompasses the knowledge and beliefs that empower individuals to recognize, manage, or prevent mental illness, and research has shown that mental health education can enhance public awareness and reduce the stigma associated with mental illness (Jorm et al., 1997; Yin et al., 2020). In this study, we used the Mental Health Literacy Scale (MHLS; Shih & Hung, 2023) as an external criterion for analyzing the relationship between scores on the Text–Picture Integration Scale and mental health literacy. The MHLS measures individual mental health–related knowledge and attitudes across two 10-item subscales using an occupational therapy–based psychosocial framework, and it demonstrates good reliability (Cronbach’s α = .76) and validity (scale-level content validity index [CVI] = 0.97). The Knowledge subscale tests individual proficiency in mental health–related issues such as symptom recognition, recovery, functioning, disability, and prognosis; these items are objective knowledge-checks yielding a score of 5 for correct responses without partial credit. The Attitude subscale measures attitudes toward mental health–related concepts using a 5-point Likert scale. The latent factors of items include mental health promotion and maintenance, help-seeking attitudes, help-seeking efficacy, willingness to assist patients with mental illness, and destigmatization of mental illness.
A higher MHLS score indicates good mental health literacy, which means optimizing personal mental health while understanding mental disorders and treatment, reducing stigma, and promoting help-seeking efficacy (Kutcher et al., 2015). The connection between the MHLS and public perceptions of mental illness holds significant promise in promoting greater awareness of mental health issues and facilitating meaningful discussions. The ultimate objective is to disassemble the divisive us-versus-them mindset that contributes to stigma. Overcoming this divisive mentality can pave the way for conversations about mental health that emphasize a collective perspective, so that dialogue about mental health can reflect an attitude of “it’s about us— all of us” (Krupa, 2016).
Participants
The study participants were volunteers of varying ages recruited through advertisements on social internet platforms such as Facebook,
Procedure
The scale’s development process consisted of nine stages, commencing with the literature review phase and concluding with finalization of the scale. The research was conducted between August 2022 and June 2023. For a visual representation of this process, see Figure 2.
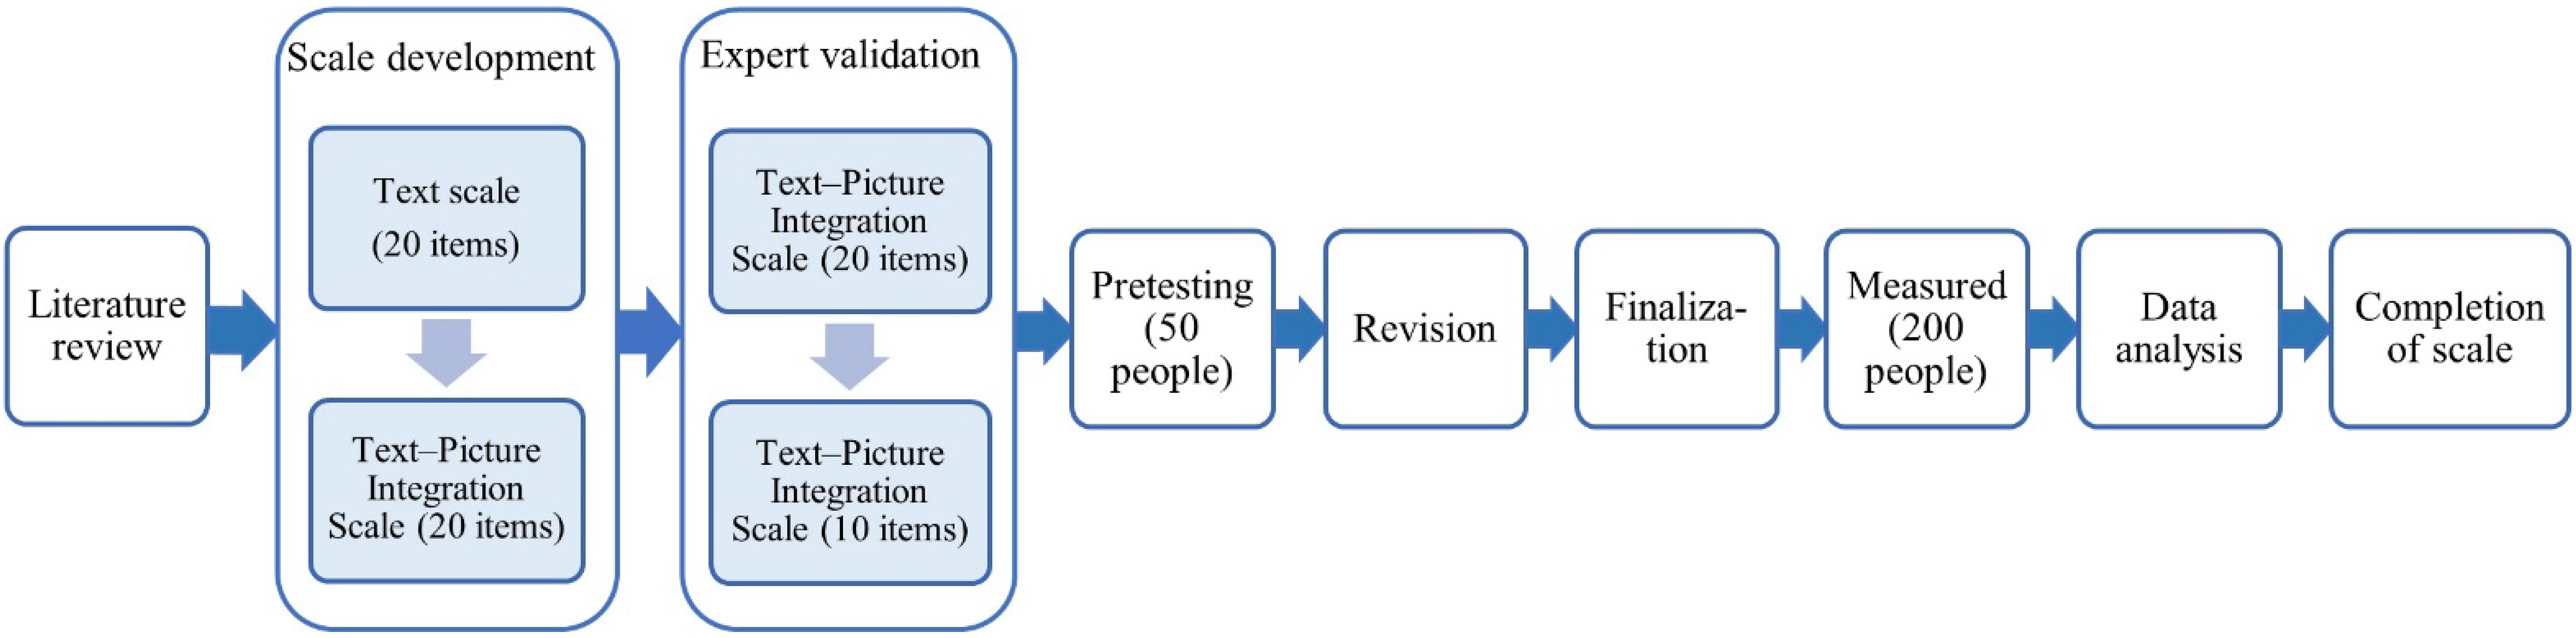
Research process.
Data Collection and Analysis
The online scale necessitated that participants begin by reading study instructions and granting consent by checking an agreement box. The process of data collection required approximately 10 minutes for each participant and encompassed three sections of the self-report scale. The initial section collected demographic data for analysis. The second section administered the Text–Picture Integration Scale. The participants then finished by completing the MHLS, assessing their practical knowledge of mental health and related issues. To prevent potential bias in respondents’ perceptions of mental health, the MHLS was positioned at the end of the survey.
For data analysis, we used IBM SPSS Statistics (Version 29.0) and IBM SPSS Amos (Version 26.0). After excluding invalid data, such as incomplete basic information, participant variables were determined from demographic data through analysis. The distribution of demographic variables was organized as percentages using descriptive statistical analyses. The internal consistency of the Text–Picture Integration Scale was evaluated by applying Cronbach’s α coefficient. To establish criterion-related validity, the correlation between results on the MHLS and the Text–Picture Integration Scale was examined using Pearson’s product–moment correlation coefficient. Finally, exploratory factor analysis (EFA) and confirmatory factor analysis (CFA) were conducted to assess item interrelationships and establish the factor structure for construct validity. In the EFA, the Kaiser–Meyer–Olkin (KMO) measure was used to test the sample’s adequacy. A KMO value of >.8 is considered meritorious (Kaiser, 1974), and factor loadings of ≥.50 are considered practically significant (Hair et al., 2013). In the CFA, goodness-of-fit indexes, χ2, the root-mean-square error of approximation (RMSEA), and the comparative fit index (CFI) were used. A χ2 > 0.05 is desirable, although when a large sample is used the χ2 test is often significant, and researchers therefore recommend using RMSEA (values of <.08 have been reported as acceptable and values <.06 as good; Hooper et al., 2007).
Results
Demographic Analysis
Data collection resulted in 196 valid responses, with 4 incomplete responses excluded from the initial total. The participants were female (68.4%) and male (31.6%), ages 16 to 60 yr, with an average age of 23.95 yr. Education levels were high school (5.1%), undergraduate or bachelor’s degree (66.3%), master’s degree (27.6%), and doctoral degree (1.0%). The participants represented 14 professional fields spanning four distinct categories: sciences (20.4%), social sciences (22.4%), business and professional services (25.5%), and health care and social services (31.6%). Incorporating health care and social services can be beneficial in refining certain aspects of the questionnaire to ensure its suitability for the general population. Some items may have higher relevance to health care professionals, and adjustments may be necessary to capture a broader perspective. For detailed information on the distribution of these demographic variables, refer to Table 1.
Distribution of Demographic Variables (N = 196)
Note. Percentages may not total 100 because of rounding.
Sciences include natural sciences, mathematics and statistics, engineering, manufacturing and construction, information and communication technology, agriculture, forestry, fishery, and veterinary fields.
Social sciences include social sciences, journalism and literature, arts and humanities, education, tourism and recreational management, and sports fields.
Business and professional services include commercial, management and law, and service fields.
Health care and social services include medicine, health, and social welfare fields.
Validity and Reliability
We conducted a content validity assessment for each item in the preliminary scale, resulting in item-level CVIs ranging from 0.83 to 1.00. The overall scale-level CVI was 0.97, indicating strong content validity. The scale’s reliability was evaluated by calculating Cronbach’s α coefficient, which yielded a value of .80, surpassing the threshold for an internal consistency coefficient of .70 and signifying good reliability. No evidence suggested that removing any specific item would significantly enhance the scale’s overall internal consistency; thus, all 10 items were retained in the final version.
Criterion-related validity was established through correlation analysis between the total scores on the Text–Picture Integration Scale and the MHLS. The Pearson correlation coefficient (r = .73, p < .001) between the two scales, which exceeded 0.70, demonstrates a significant and positive relationship. Furthermore, the coefficient of determination (R 2 = .53) emphasizes a statistically significant explanatory power, suggesting that the independent variable has a moderate influence on the observed variation in the dependent variable.
Exploratory Factor Analysis
The KMO test for sampling adequacy generated a value of .84, indicating sufficient sample size for factor analysis. Bartlett’s test of sphericity further supported the suitability of the data for factor analysis, yielding a significant result (p < .001). According to the scree plot, there are two principal components with eigenvalues greater than 1. However, when using only these two principal components to explain the variables, the factor loadings for Items 4, 6, and 8 do not reach 0.50. This indicates that these two principal components do not adequately explain these items, and it suggests the potential need for additional principal components or factors to better capture these variables. To achieve more accurate results, factor loading of items must be at least 0.50 for a newly developed scale (Afthanorhan, 2013). The statistical findings reveal that Item 4 exhibits factor loadings of 0.48 and 0.47 on two distinct latent constructs. This pattern implies that the item can represent elements of both constructs, thereby reflecting a relatively low degree of discriminant precision in the classification.
In the study, exploratory factor analyses were conducted using principal-components analysis with varimax rotation. Three factors explaining 60% of the variance were identified. The rotated component matrix revealed that the factor loads were greater than 0.60, which meets the acceptable criterion (≥0.50; Afthanorhan, 2013). The factors extracted from this analysis demonstrated a robust correlation, ranging from .60 to .82. Each factor was examined for content within the items. After that, the three factors based on correlation and item loadings were named. The first factor, Empathetic Acceptance, includes Items 1, 2, 5, and 9 and assesses willingness to connect and interact with individuals with mental illness. The second factor, Disease Awareness, consists of Items 7, 8, and 10, measuring understanding mental illness and its contributing factors. The third factor, Equality and Kindness, assessed by Items 3, 4, and 6, included reverse-scoring on Items 3 and 4 to indicate a lack of prejudice, and Item 6 measured willingness to assist individuals with mental illness. Table 2 provides the full results of the factor analysis.
Factor Structure and Factor Loading of the Text–Picture Integration Scale for Perspectives on Mental Illness
Note. Factor loadings >0.6 are in boldface and are retained on the corresponding factor.
Confirmatory Factor Analysis
The CFA results showed that that the three-factor measurement model’s compliance with the Text–Picture Integration Scale for Perspectives on Mental Illness is appropriate. For the three factors, χ2(32) = 22.841, p < .000. The RMSEA was 0.000 (95% confidence interval [0.000, 0.026]), goodness-of-fit index = 0.976, adjusted goodness-of-fit index = 0.959, normed fit index = 0.955, and, a more encouraging result, CFI = 1.000, indicating a good fit while reaching the recommended value of >0.90 (Hooper et al., 2007). On the basis of standardized values, the correlations between the items and their latent variable ranged from .47 to .85. The three latent variables were correlated from .41 to .83 (Figure 3).

The three-factor model for the scale gained from the confirmatory factor analysis (N = 196).
Discussion
The Text–Picture Integration Scale for Perspectives on Mental Illness contains three significant factors. Factor 1, Empathetic Acceptance, assesses the general public’s willingness to interact with individuals with mental illness across contexts including friendship, cohabitation, workplace, and marriage. For instance, Item 2, “If your child or relative wanted to marry a person with a mental illness, you would disagree with that decision,” is subject to reverse scoring. This item prompted notably more negative responses than other items in the same factor, signifying a lower level of acceptance of the idea of marriage to individuals who have mental illnesses. This finding aligns with the reporting of higher scores on the Marriage Obstacles subscale of the Mental Illness Attitudes and Perceptions Scale (Han & Chen, 2008), highlighting the need to address marriage-related barriers to better social integration of affected individuals.
Factor 2, Disease Awareness, gauged the understanding of mental health etiology by assessing supernatural attributions, knowledge of environmental contributors, and personal familiarity or experiences. Item 7, “You believe that it is preferable to choose medical treatment over spiritual intervention for managing mental health symptoms,” yielded a slightly lower overall score. This result suggests the presence of misconceptions regarding the origins of mental illness, often leaning toward attributions to supernatural influences or a preference for folk remedies. It underscores the essential need for mental health education to rectify misconceptions and encourage appropriate utilization of health care services (Wei et al., 2015).
Factor 3, Equality and Kindness, explored public attitudes toward negative issues of mental illness, such as feelings of shame for seeking psychiatric help and news reports attributing murder and violent crime to people with mental illness. Results demonstrated a significant correlation between lack of prejudice on these items and helpful attitudes toward individuals with mental illness, as indicated by Item 6 concerning attendance at a charity art exhibition displaying artwork by individuals with mental illness. These findings confirm the interconnected cognitive, emotional, and behavioral components of mental illness stigma and strongly suggest that improving the public’s willingness to assist individuals with mental illness can contribute to reducing negative perceptions and attitudes (Goffman, 1963).
We compared the Text–Picture Integration Scale for Perspectives on Mental Illness with established scales, such as the Mental Illness Attitudes and Perception Scale (Chen et al., 1991) and the Perceived Psychiatric Stigma Scale (Han & Chen, 2008). Its construct validity affirms that it effectively measures perspectives on mental illness. Factor analysis revealed strong correlations among variables. The 10 items assessing perspectives on mental illness made up three factors: Empathetic Acceptance, Disease Awareness, and Equality and Kindness. These factors reflect the three main components outlined in the stigma framework (Thornicroft et al., 2007), namely Ignorance (knowledge), Prejudice (attitudes), and Discrimination (behaviors). This alignment indicates that the scale possesses strong predictive and evaluative attributes. The study results contribute to a deeper comprehension of the public’s perspective on mental illness, providing valuable insights for the development of interventions designed to diminish stigma and enhance societal attitudes. Addressing knowledge gaps, challenging prejudice, and promoting inclusive behaviors are essential in cultivating a more supportive and accepting environment for individuals affected by mental illness.
Limitations of the Study and Suggestions for Future Research
The current study has three limitations. First, the small sample size may restrict generalizability; more extensive and diverse samples are necessary to enhance external validity. Second, cultural factors may influence results, reflecting specific values, beliefs, and behavioral patterns among the Chinese population. For more comprehensive and representative results, we recommend the inclusion of participants from different cultures and ethnic groups. Last, women made up more than two-thirds of the sample, potentially biasing results toward women’s perspectives while minimizing men’s viewpoints and necessitating a more significant proportion of male participants in future studies.
Implications for Occupational Therapy Practice
Understanding public perspectives on mental illness is crucial for occupational therapy practice, enabling practitioners to provide adequate education and advocacy for reducing stigma and discrimination. Public demonstration of understanding, support, and acceptance engenders a more benevolent environment and strengthens social support networks, enhancing patient engagement and occupational therapy outcomes. Additionally, greater public acceptance of mental illness and mental health–related issues promotes early intervention, preventive measures, and mental health maintenance that foster resilience, improve treatment outcomes, and increase quality of life. Occupational therapists can leverage this understanding to optimize interventions that advance the overall well-being of this patient population.
Conclusions
These preliminary analyses indicate that the Text– Picture Integration Scale for Perspectives on Mental Illness demonstrates stability, reliability, and a well-structured format with solid validity. The scale is sufficiently comprehensive to assess perspectives on mental illness while allowing for efficient completion and evaluation. The results demonstrate the scale’s effectiveness in measuring levels of public awareness of stigma, including prejudice and discriminatory behavior toward individuals with mental illness. It is appropriate for use as an objective assessment tool and may help guide destigmatization strategies. Future research should compare perspectives on mental illness across diverse groups, cultures, and regions to develop targeted mental health educational strategies based on cultural needs.
Footnotes
Acknowledgments
This study was supported by grant funding from Chung Shan Medical University under the Higher Education Sprout Project by the Ministry of Education, Taiwan, and the Teaching Practice Research Program of the Ministry of Education, Taiwan, Republic of China (PSK1110076). We sincerely thank the experts and volunteers who participated in our investigation.