





Abstract
This study found that the Assessment of Motor and Process Skills (AMPS) can be used to differentiate between medically at-risk drivers who are likely to pass a comprehensive driving evaluation and those who are likely to fail or need restrictions.
Older adults (those ages 65 yr and older) represented 17% of the U.S. population in 2020, or one in every six Americans, and this age group is expected to grow to be 22% by 2040 (Administration on Aging [AOA], 2022). Moreover, life expectancy has increased significantly so that the population ages 85 and older is projected to double between 2020 to 2040, a 117% increase (AOA, 2022). With the increased aging population, it is not surprising that, in 2021, older adults made up 17% of all traffic fatalities and 11% of serious injuries. For fatalities, this is a 14% increase in 1 year (from 2020) and a 34% increase from 2012 (National Highway Traffic Administration [NHTSA], 2023). However, it is important to appreciate that older adults are at greater risk of fatalities in crashes, largely because of increased frailty and fragility, which reduces their odds for recovering from injuries (NHTSA, 2013), not necessarily from decreased capacities to drive safely.
Current older adults differ from earlier generations not only in size but also in mobility, using motor vehicles to a much greater extent than previous generations (D’Ambrosio et al., 2012). Additionally, they live in suburban or rural areas, which requires them to use personal transportation to engage in essential occupations (Dellinger, 2012; Rosenbloom, 2012). Unfortunately, 86% of older adults have at least one chronic health condition with subjective cognitive decline (Centers for Disease Control and Prevention [CDC], 2023), which suggests that most older adults will be at risk for driving cessation at some point in their lifetime. However, most older adults resist the idea of driving cessation, because driving remains the most important instrumental activity of daily living (IADL) and provides a sense of independence, the ability to be spontaneous, and a sense of identity (Dickerson et al., 2013, 2019). Nevertheless, with the increased longevity of people living with chronic conditions (e.g., dementia, Parkinson’s disease, stroke) that impair their functional abilities, a person’s fitness to drive (i.e., the medical and functional requirements to drive) has become a critical issue for both health care professionals and driver licensing agencies (Azawi et al., 2020; Pomidor, 2019).
Occupational therapy practitioners are experts in understanding how impairments affect important occupations, especially as people age. Although all people age differently, most performance skills (e.g., visual, physical, cognitive) show a slowing or changes over time that may affect driving and community mobility. Moreover, medical conditions can significantly affect driving, especially with advanced aging (Dickerson et al., 2018). Although most occupational therapy practitioners may not make licensing recommendations, data from evidence-based assessment tools, especially performance-based assessments, can advance intervention planning, whether for remedial intervention or referral for a fitness-to-drive evaluation (Dickerson & Bédard, 2014; Pomidor, 2019; Schold Davis & Dickerson, 2017). In fact, with the signing of the Improving Medicare Post-Acute Care Transformation Act, there is an increased demand for occupational therapy practitioners to use standardized assessment tools (Centers for Medicare and Medicaid Services, 2015). To improve the distinct value of occupational therapy, there is also a call for practitioners to use functional performance tools rather than rely on pencil-and-paper assessments (Doucet, 2014; Doucet & Gutman, 2013; Gillen, 2013).
One such performance-based assessment tool is the Assessment of Motor and Process Skills (AMPS; Fisher & Bray Jones, 2014), a standardized and client- centered observational assessment designed to evaluate the quality of a person’s activities of daily living in their natural environment. On the basis of extensive research, the AMPS has been useful among various adult populations, such as people who have experienced a stroke (Doucet & Mettler, 2018), people with psychiatric conditions (McNulty & Fisher, 2001), dementia (Bouwens et al., 2008; Cooke et al., 2000), frail elderly adults (Fisher et al., 2007), people with developmental disorders (Kottorp et al., 2003), and community-living adults (Dickerson & Fisher, 1993). In terms of the daily task of driving, studies have demonstrated the usefulness of AMPS to determine fitness to drive (i.e., the medical and functional requirements for driving; Dickerson et al., 2010, 2011, 2014). However, to date, none have demonstrated that the AMPS has sufficient sensitivity and specificity to be used to determine the fitness to drive of drivers who are medically at risk (i.e., drivers with medical conditions) or drivers of an advanced age with slowed processing speeds or responses. Therefore, the purpose of this study was to determine the specificity and sensitivity of the AMPS as a tool for determining a person’s fitness to drive.
Method
Design
We used data from the Research for Older Driver Initiative’s data pool from 2019 (with a pause from 2020–2021) to October 2023 (N = 388). As a cross-sectional part of a multisite prospective study to examine the referral process of driving rehabilitation programs started in 2019, we collected data from the university-affiliated medical center in Greenville, NC (n = 150), and two driving rehabilitation private practice sites, in Orwigsburg, PA (n = 17), and Colorado Springs, CO (n = 29). Although collected from different sites, the data had the same protocols for completing the AMPS and the on-road component. In addition, community-living older adults (n = 192) in two separate institutional review board (IRB)-approved studies also completed the AMPS and an on-road assessment, using the same route as the driving program in Greenville, NC. The University and Medical Center IRB approved all three studies, and each participant provided informed consent before participating in the studies.
Participants
In total, 388 community-dwelling adults (M age = 68.74, SD = 11.53) participated in the study. About half of the participants (n = 196) were recruited before beginning a comprehensive driving evaluation by occupational therapists who were also driving rehabilitation specialists (OT-DRSs). In this group, the mean age was 67.18 (SD = 14.99, range = 20–100 yr); 58% were male (n = 113), and 42% were female (n = 81). In addition, 192 participants were recruited in two separate driving studies of community-living older adults who were active drivers in which the AMPS and an on-road assessment were part of the data collection. The mean age of this group was 70.33 (SD = 5.92, range = 60–87 yr); 34% were male (n = 68), and 65% were female (n = 124). Although all participants were evaluated on the same or similar standardized driving evaluation route, regardless of any negative driving outcome results, the participants from the community were not reported to their physician or the licensing agency as per their IRB consent form.
Instrumentation
Assessment of Motor and Process Skills
The AMPS (Fisher & Bray Jones, 2014) was administered by occupational therapists who were calibrated as AMPS raters (i.e., they demonstrated valid and reliable administration and scoring). Each participant completed at least two AMPS IADL tasks while being observed by an occupational therapist who used the manual criteria to score the 16 Motor and 20 Process items generating a motor and process logit outcome score. Multiple previous studies have supported the AMPS across age groups (Hayase et al., 2004), between men and women (Merritt & Fisher, 2003), and between people with and without dementia (Cook et al., 2000). The AMPS has also been shown to be a sensitive outcome measure (Chard et al., 2009; Dickerson & Fisher, 1997; Goverover et al., 2007). In addition, Fisher and Bray Jones (2014) have shown that the item and task challenge calibrations do not vary across samples, including White and Black Americans (Stauffer et al., 2000); thus, the IADL ability measures can be validly compared across settings and raters.
On-Road Assessment
Although there is little consistency in what defines an on-road assessment with few standardized assessments (Classen et al., 2012; Korner-Bitensky et al., 2006), the on-road assessment is often considered the gold standard for driving evaluation in identifying who passes or fails a driving evaluation (Langford et al., 2008). However, with the redefined levels of Michon’s hierarchy of driving behaviors (Transportation Research Board, 2024), many on-road assessments have incorporated the component of wayfinding and navigation more consistently, evaluating all levels of driving behavior instead of just operational and tactical and, thus, improving the quality and efficacy of the on-road assessment (Dickerson et al., 2018). Although the on-road assessments were collected from three locations; the OT-DRSs in this study evaluated participants in terms of operational (e.g., steer appropriately, apply appropriate pressure on pedals), tactical (e.g., follow the rules of the road, slow when prompted by the environment, execute appropriate turns), and strategic (e.g., wayfinding, navigation) levels. At the three locations, the OT-DRSs used both off-road assessments and the on-road assessment to make the recommendation of pass, fail, or driving restrictions, if allowed in their state.
Performance Analysis of Driving Ability
For the on-road assessment of the community-living older adults, we used the Performance Analysis of Driving Ability (P-Drive; Patomella, 2014), a structured, observational tool of driving performance based on 25 skill items. The P-Drive consists of four categories of skills: maneuvers (operational skills; e.g., steering, using pedals, controlling speed), orientate (e.g., following directions, position on road, planning), following regulations (e.g., yielding, obeying stop signs, following speed limits), and heeding (attending and responding to other road users, using mirrors, reacting, problem solving). Designed for on-road performance, the P-Drive has high reliability and validity across the literature (Patomella & Bundy, 2015; Patomella et al., 2010; Vaucher et al., 2015). Because there is evidence that the P-Drive can separate drivers into categories of driving ability with a specificity of .92 and a sensitivity of .93 (Patomella & Bundy, 2015), it has been used to determine a person’s fitness to drive. Patomella and Bundy (2015) also report a strong correlation between raw scores and internal measures, with a recommended raw score cutoff at 81 for adequate driving performance. The same or similar standardized route was used for all drivers, with the OT-DRS taking notes and completing the P-Drive scoresheet–evaluation form immediately after the on-road assessment. Scores below 81 indicated a failure, and drivers with borderline scores of 81 or 82 would have been given driving restrictions on the basis of their performance.
Data Analysis
Participants who failed the final driving assessment or must drive with restrictions were compared with those who passed the assessment for differences in age, gender, AMPS Motor score, and AMPS Process score using either the t test or χ2 test of independence. We then analyzed the data using logistic regression models, with the final driving assessment outcome (pass vs. fail, or driving restrictions) as the dependent variable and age, gender, AMPS Motor score, and AMPS Process score as the predictors, starting with a full model with all four predictors and then comparing models if any of the variables were not predictive. A receiver operating characteristic (ROC) curve was used to assess the overall prediction power of the predictors. Multicollinearity among the predictors was checked using variance inflation factors (VIFs). Model lack of fit was assessed using the Hosmer and Lemeshow goodness-of-fit test (Portney, 2020). Finally, we repeated the ROC analysis, using-cross validations for a better assessment of prediction error. The data were analyzed using SAS Version 9.4. A significance level of .05 was used throughout the paper.
Results
Table 1 shows the characteristics of the participants by outcome of driving evaluation. Overall, 258 (66.5%) participants passed the final driving assessment and were considered fit to drive. Among the other 130 (33.5%) participants, 86 (22.2%) failed the final driving assessment and must cease driving, and the other 44 (11.3%) must drive with restrictions. The mean age of the participants was 68.7 yr (SD = 11.5), and 47.4% were male. Their mean AMPS Motor score was 2.05 (SD = 0.79), and their mean AMPS Process score was 1.29 (SD = 0.60). Participants who failed the final driving assessment or must drive with restrictions were, on average, older than those who passed the assessment (M = 72.5 yr, SD = 10.9 vs. M = 66.8 yr, SD = 11.4), t(269) = 4.78, p < .001; were male (57.7% vs 42.3%), χ2(1) = 8.27, p = .004; had lower AMPS Motor ability scores (M = 1.51, SD = 0.80 vs. M = 2.33, SD = 0.63), t(211) = −10.2, p < .001; and had lower AMPS Process scores (M = 0.75, SD = 0.61 vs. M = 1.57, SD = 0.36), t(175) = −14.1, p < .001. Figures 1 and 2 illustrate the distribution of drivers’ Motor or Process logit scores differentiated between those who passed and those who failed or needed restrictions. In a comparison of the two figures, the difference between those who passed and those who failed or needed restrictions clearly overlaps for motor ability. In contrast, for Process, the distribution for those who pass is clearly differentiated from the distribution for those who fail or need restrictions, with very few below a logit score of 1.0.
Age, Motor Ability Scores, and Process Ability Scores by Outcome of Driving Evaluation
Note. CI = confidence interval (upper and lower bounds are shown).
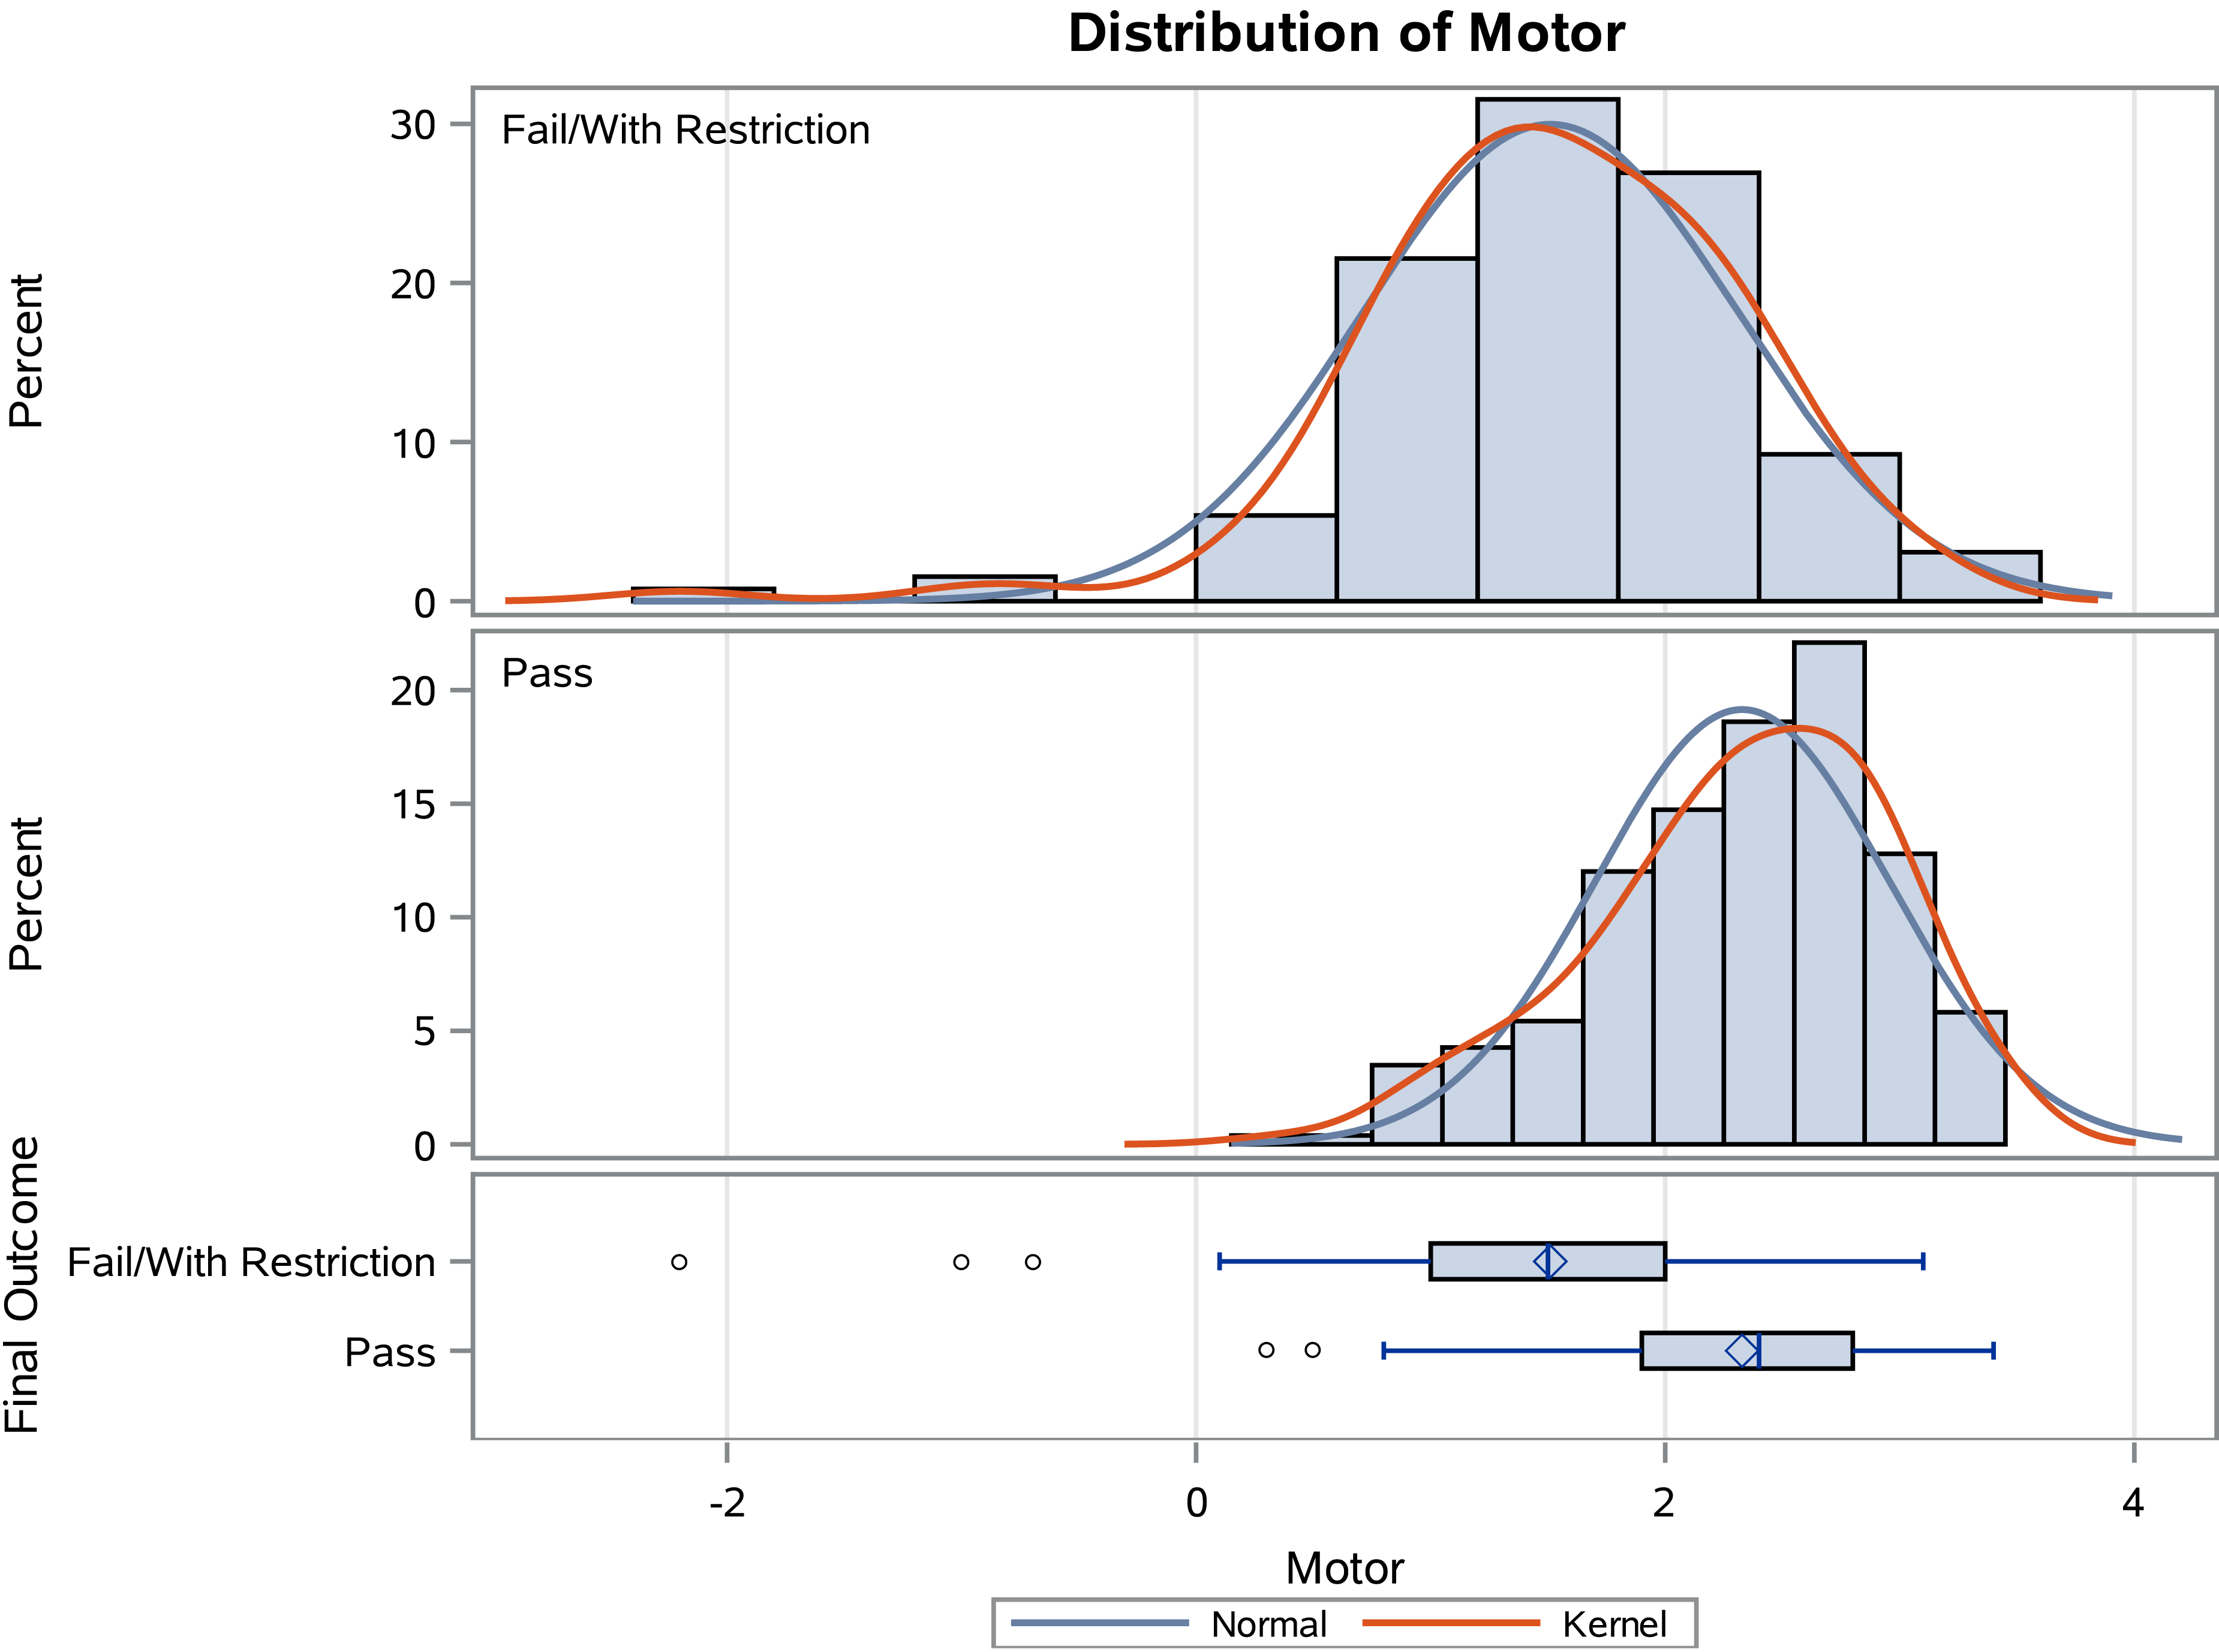
Distribution of drivers’ motor ability logit scores on the Assessment of Motor and Process Skills differentiated between those who passed and those who failed or needed restrictions.
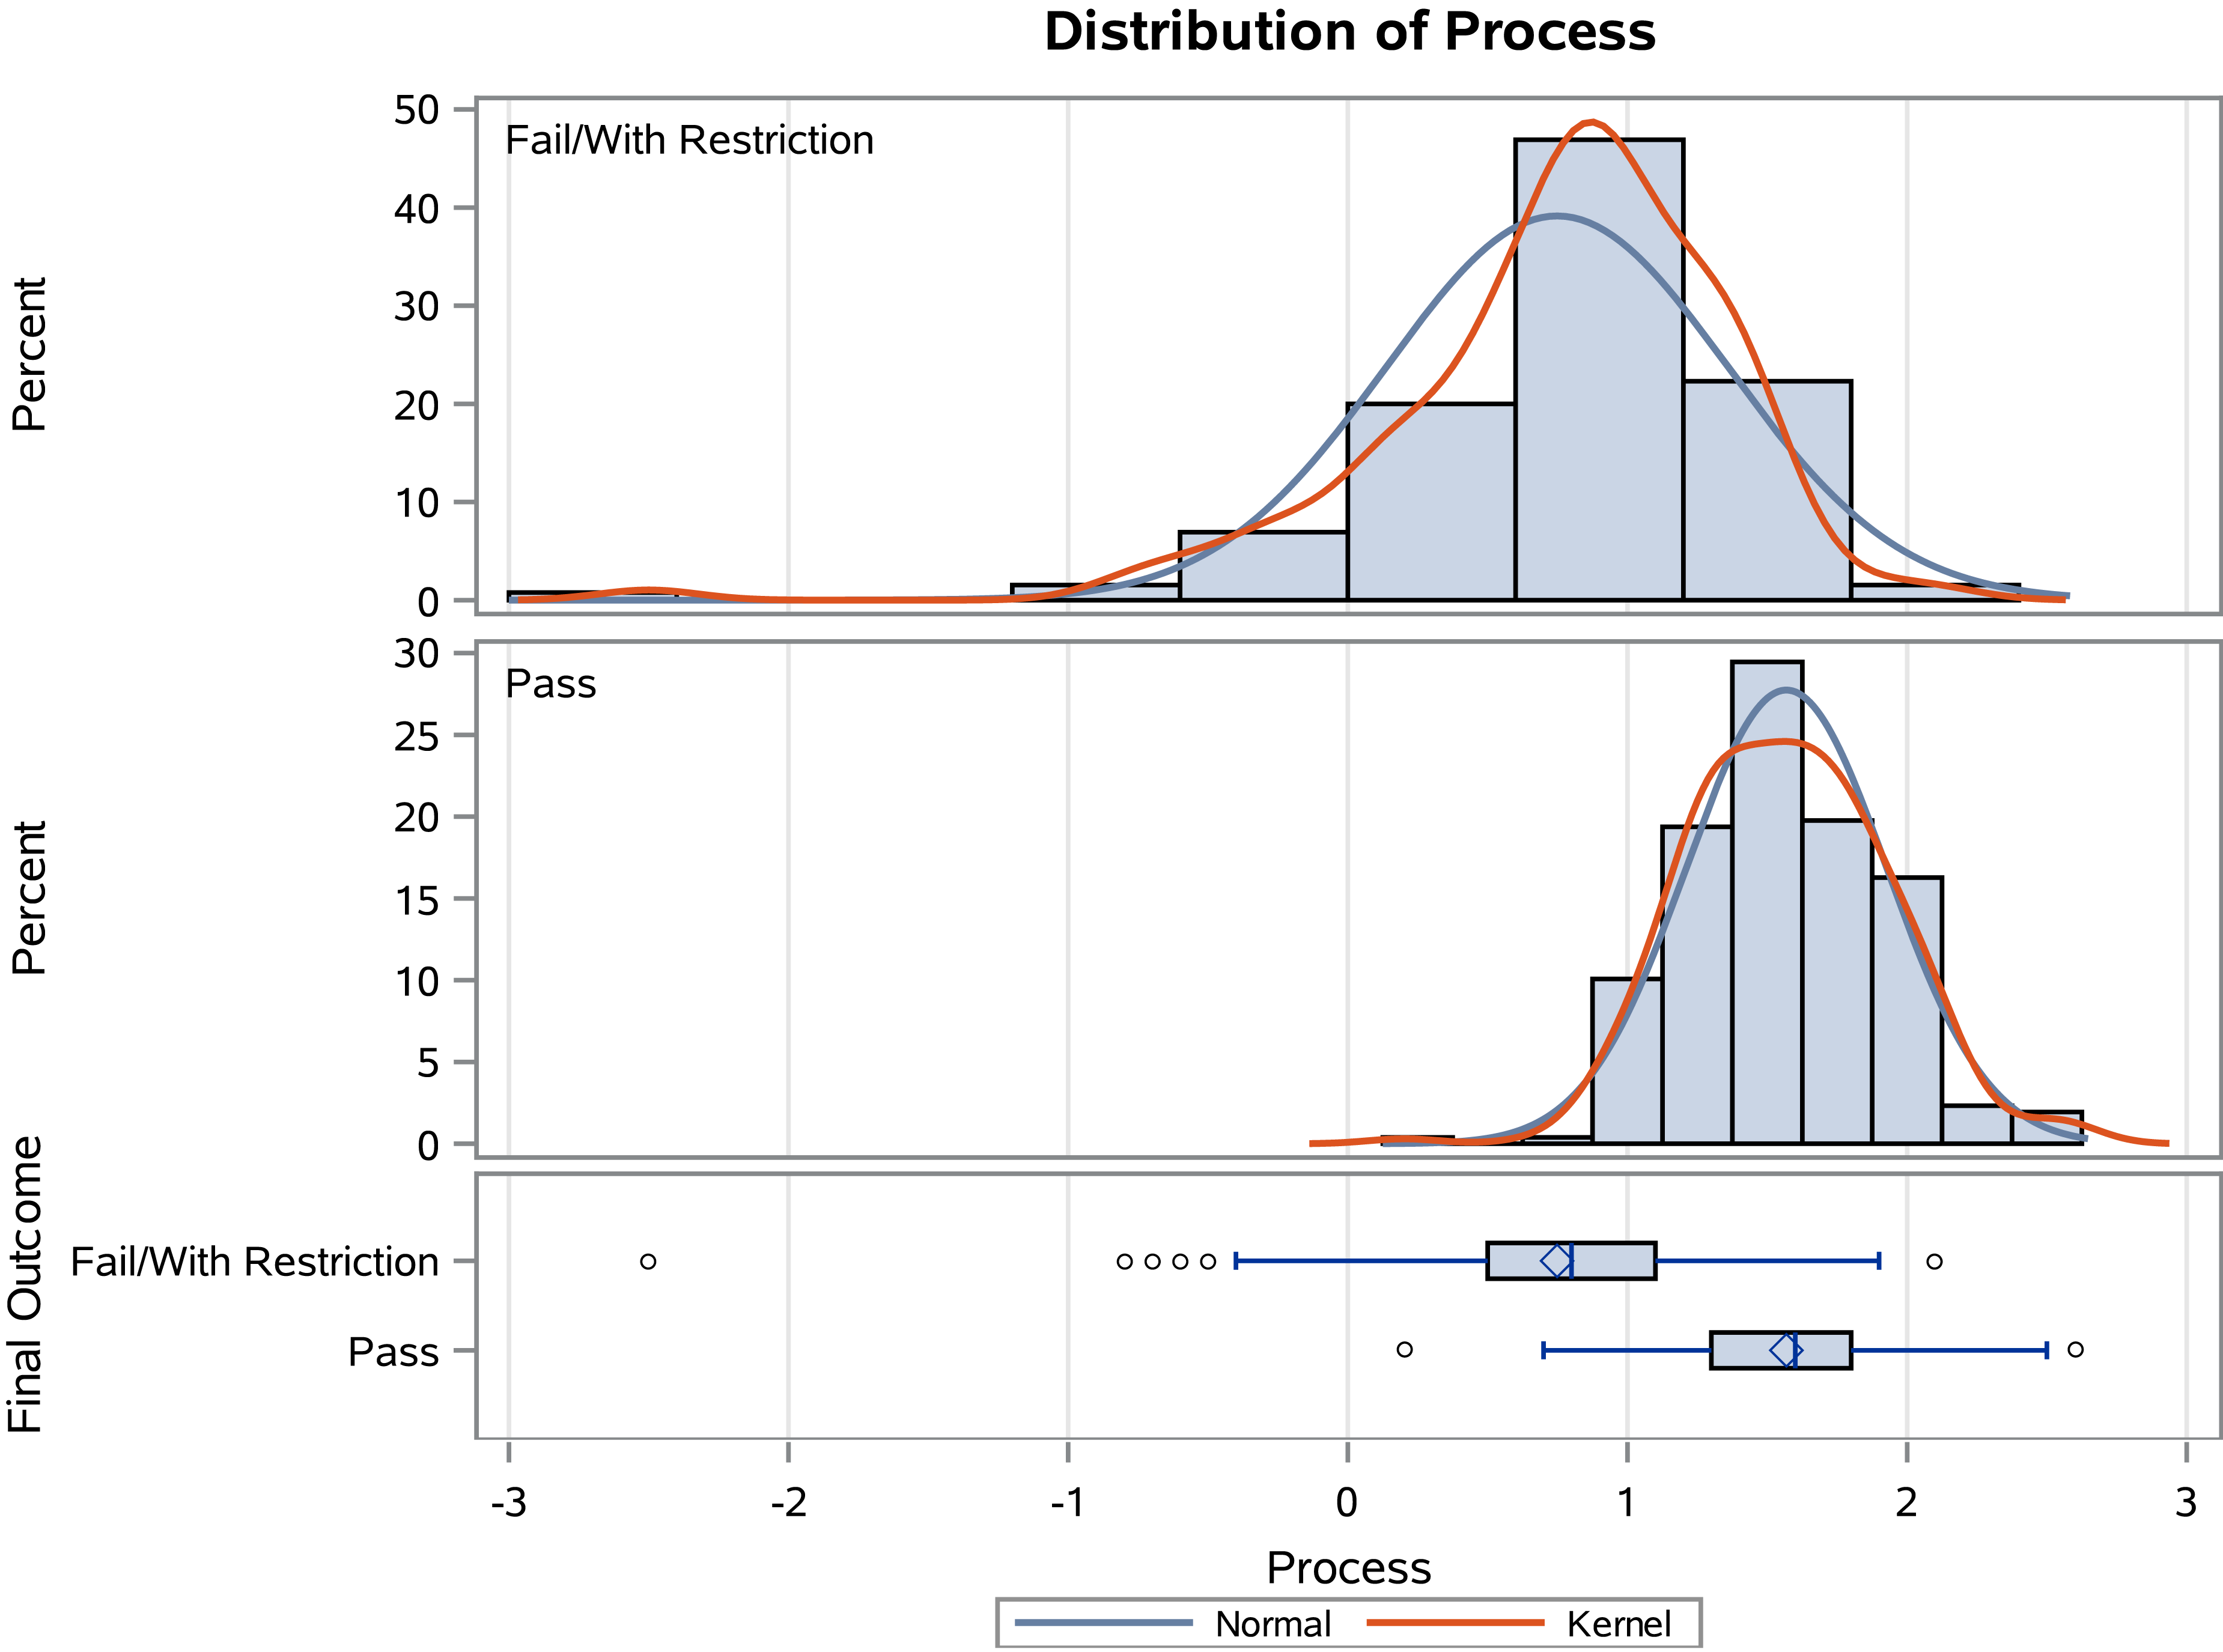
Distribution of drivers’ process ability logit scores on the Assessment of Motor and Process Skills differentiated between those who passed and those who failed or needed restrictions.
In the full logistic regression model with all four predictors, age (odds ratio [OR] = 1.022, 95% confidence interval [CI] [0.993, 1.052]) and gender (OR = 0.746, 95% CI [0.392, 1.420]) were highly nonsignificant, p > .14; whereas the AMPS Motor (OR = 0.351; 95% CI [0.212, 0.579]) and Process scores (OR = 0.013, 95% CI [0.005, 0.038]) were highly significant, p < .001. When compared with the full model, the reduced model with the AMPS Motor and Process scores as the only predictors had a very similar AUC (0.922 vs. 0.924), χ2(1) = 0.56, p = .45 (Figure 3). This means that age and gender contributed almost no information to prediction in addition to AMPS Motor and Process scores. The reduced model also suggested the prediction that a person would fail or receive driving restrictions when the predicted probability of that person was above .345. In other words, the logistic regression model predicts the probability that a person will fail or receive driving restrictions on the basis of their AMPS Motor and Process scores—the basis of the ROC curve. This yielded a sensitivity of 84.6% and a specificity of 88.8%. In the reduced model, the OR of the AMPS Motor score was .347 (95% CI [0.210, 0.572]), and the OR of the AMPS Process score was .014 (95% CI [0.005, 0.039]). That means, when a person’s AMPS Motor score increases by 1 unit, their odds of failing or receiving driving restrictions decreases by 75.3%, whereas if a person’s AMPS Process score increases by 1 unit, their odds of a fail or driving restrictions decreases by 99.6%. Although the Motor score contribution is smaller, it still makes a significant contribution. Specifically, if the Process scores are used alone, the AUC would decrease to .904, which is significantly lower than .922, χ2(1) = 6.76, p = .009. The VIFs of all predictors were less than 1.4, which indicated no issue of multicollinearity. The models were fitted using maximum likelihood estimation. Pseudo-R 2 was .466 for the full model and .461 for the reduced model. The reduced model was a very good fit to the data; Hosmer and Lemeshow test, χ2(8) = 3.88, p = .87. Cross-validations were used as a statistical method to evaluate prediction accuracy when the model-building Process excluded the cases to be evaluated, providing an unbiased estimate of prediction accuracy. When assessed using cross-validations, the reduced model produced a cross-validation AUC of .918, with sensitivity and specificity equal to 84.6% and 88.4%, respectively, when a probability > .334 was used for predicting a fail or driving restrictions. Regardless, AUC values over .9 are widely considered to be excellent (Nahm, 2022).
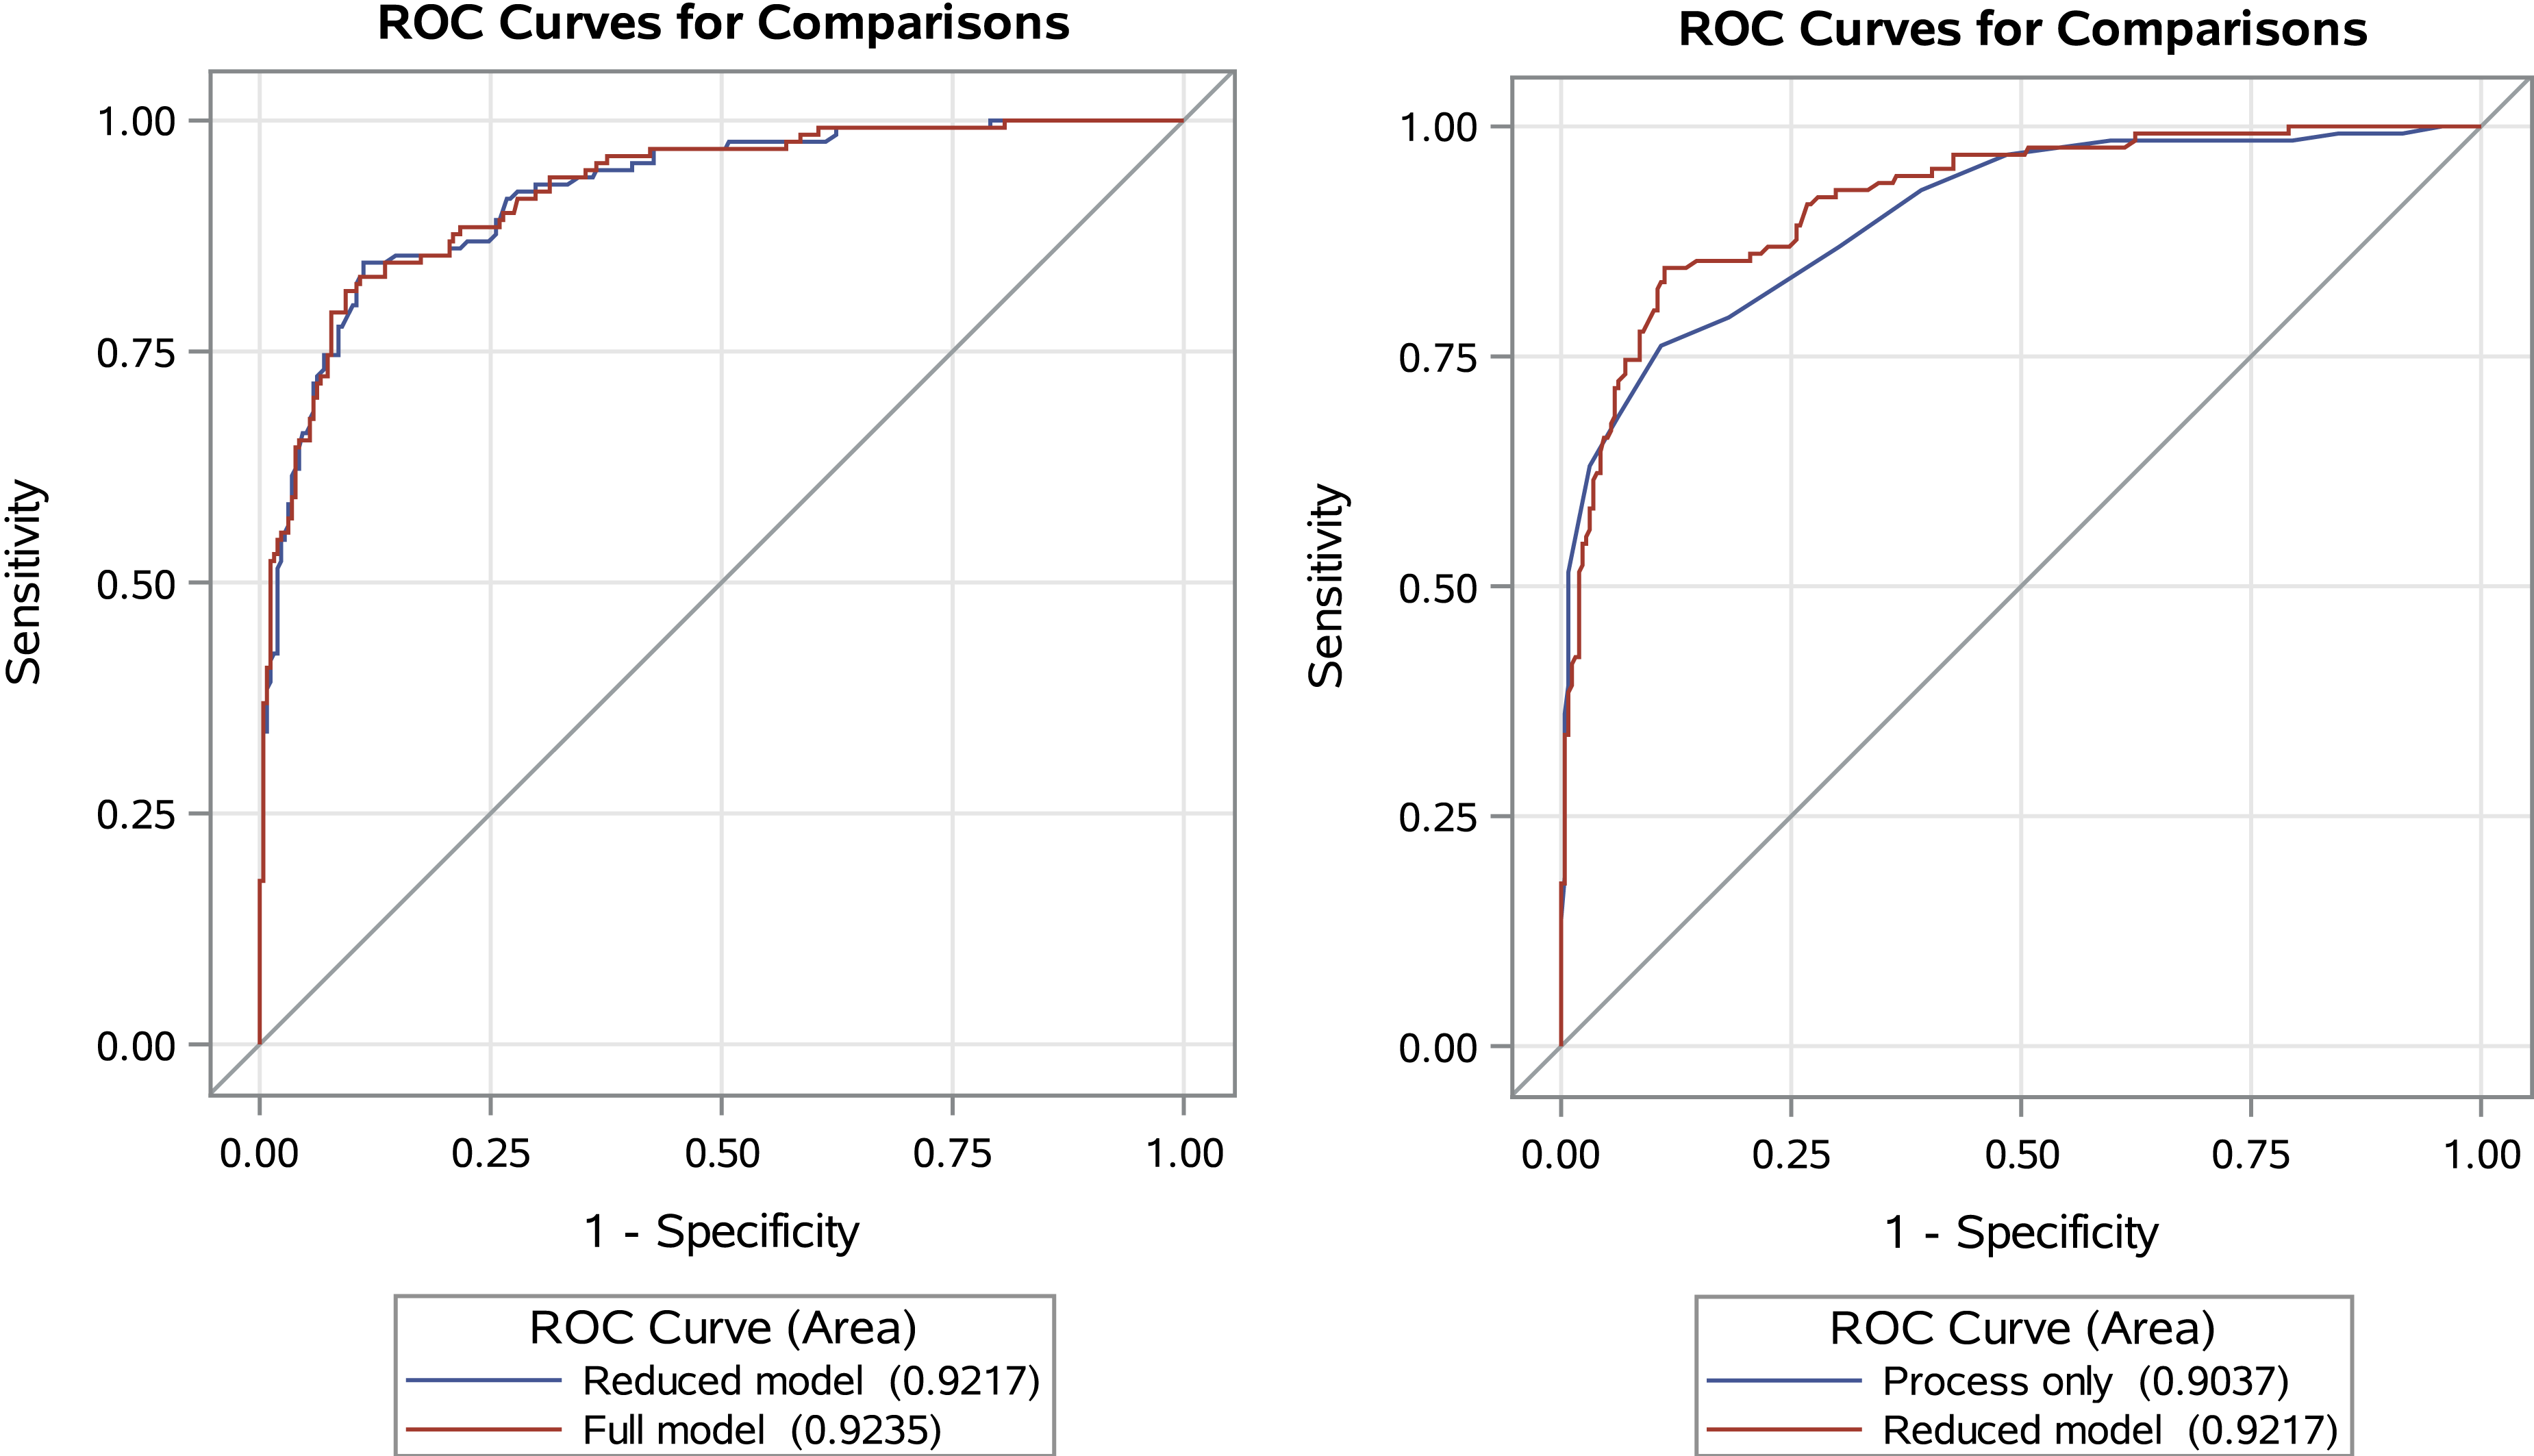
Comparison of receiver operating characteristic (ROC) curves with and without gender and age and separation of motor and process ability scores on the Assessment of Motor and Process Skills.
Discussion
The aim of this study was to determine the specificity and sensitivity of the AMPS as a tool for determining fitness to drive. On the basis of a large sample who completed two AMPS tasks and an on-road assessment, both the AMPS Motor and Process scores showed significant differences between those who failed or had restrictions compared with those who passed the driving evaluation. Specifically, the ROC curve using both the AMPS Motor and Process scores, as indicated by the AUC, statistically significantly predicted passing or failing the on-road assessment with excellent accuracy, using a probability >.334 for predicting a fail or driving restrictions. Specifically, after using cross-validations to avoid selection bias, the sensitivity of AMPS (i.e., ability to predict failing or driving restrictions on the on-road test when the driver is truly unfit to drive) is good at 84.6%, and AMPS specificity (i.e., ability to predict passing the on-road test when the driver is fit to drive) is also good at 88.4%. Table 2 shows that changing the cutpoint to 0.351 (i.e., logit = −0.615) will decrease the sensitivity to 81.5%, but specificity then increases to 88.8%, decreasing the chance of identifying a fit driver as unfit (false positive) and increasing the chance of identifying an unfit driver as fit (false negative). Thus, in the case of using the AMPS as a screening tool, it may be more conservative to use a larger (i.e., higher logit) cutoff, but when using AMPS as a driving assessment tool, it may be more important to use a smaller (i.e., lower logit) cutoff to avoid false positives.
Three ROC Curves With Cutpoints Illustrating Sensitivity, Specificity, Predictive Values, Error, and False Positives and Negatives
Note. ROC = receiver operating characteristic.
Converted from a probability to a logit (i.e., log odds).
It is interesting that, although those who failed or had restrictions tended to be older, with a larger percentage being male, when modeled with the AMPS Motor and Process scores, gender and age did not contribute to the significant difference between those who successfully passed and those who needed restrictions or failed the on-road assessment. Although there are clear gender differences in dementia risk factors as well as the disease (Anstey et al., 2021; Mielke, 2018; Okamoto et al., 2021), because the AMPS does not show significant differences across gender (Duran & Fisher, 1996), it may be that these differences are not evident when using the AMPS. Conversely, although the AMPS does demonstrate age differences (Dickerson & Fisher, 1993), the AMPS scores are based on performance within the person’s age group; thus, their age may be already considered in the scores.
Driving is one of the most complex IADLs, because it requires visual, motor, perceptual, and cognitive skills. However, although driving requires motor abilities, it has become less physically demanding than in the past, with improvements in motor vehicle technology (e.g., power steering, advanced mirror settings, backup cameras). In terms of visual skills, for example, assistive technology (e.g., bioptics) has allowed people with low vision to continue driving. In fact, cognition is the most critical skill for determining fitness to drive (Babulal & Dickerson, in press). Research has clearly shown that cognitive assessments are necessary in determining fitness to drive (Aksan et al., 2015), including the three key domains of processing speed, visuospatial abilities, and memory (Anderson et al., 2012) or processing speed, executive function, and higher level cognition (Anstey et al., 2012). Therefore, if the Motor score is low (compared with their age group) because of significant impairment (e.g., tremor, hemiparesis, wheelchair), the Process score needs to be sufficiently high enough to compensate for lower functional performance in driving abilities (e.g., slower speed, alternative routes).
In this study, the AMPS Process scale more clearly differentiates between those who passed and those who failed compared with the AMPS Motor scale, as observed in the distribution figures, which supports previous research in dementia (Hartman et al., 1999). In fact, for every unit increase (and SD) of the Motor scale, the odds of passing an on-road assessment almost tripled (more than doubled), but for every unit increase (SD) of the Process scale, the odds of passing an on-road assessment increased almost 71 times (12 times). This is supported in earlier studies in which the AMPS was used for driving assessment in that the Motor scale did not show a difference whereas the Process scale clearly differentiated between those who passed and those who failed (Dickerson et al., 2011).
Limitations
As with all studies, this study has limitations. In most cases, the occupational therapist who administered the AMPS was also the OT-DRS who performed the on-road driving assessment. Although not blinded, the AMPS was one of many assessments used before the on-road assessment, and the outcome of the AMPS was not used as a sole determinant in the fitness-to-drive decision. Moreover, this study was conducted in the real-world environment and, thus, has strong ecological validity.
Another limitation could be considered that there were several OT-DRSs in the study with no interrater reliability with the AMPS or on-road assessment. However, the strength of the AMPS is that all raters are calibrated, and interrater reliability is already adjusted in the score. There was not an attempt to complete interrater reliability with the on-road assessment, because there is no standardization of on-road assessments using different routes. However, the on-road assessment remains the gold standard (Classen et al., 2012; Korner-Bitensky et al., 2006), regardless of this limitation. In terms of the P-Drive scores, they were used by one of the OT-DRSs, negating the need for interrater reliability.
Implications for Occupational Therapy Practice
The findings of this study have the following implications for occupational therapy practice.
The results demonstrate that the AMPS is an effective assessment tool for predicting fitness to drive. In addition, as a standardized, observational, and “top-down” assessment, it offers important information for intervention planning (Demers et al., 2016; Doucet & Mettler, 2018; Fisher et al., 2007; Gantschnig et al., 2013; Kottorp et al., 2003). Moreover, the AMPS can be easily incorporated into general practice and, with these results, it can be an excellent tool to assist practitioners in determining whether a referral to a comprehensive driving evaluation is warranted or to assist in the timing of a referral.
The AMPS has been hailed as the gold-standard performance-based assessment for its psychometric properties (Gillen, 2013), and it is considered an excellent tool that quantifies functional performance (Doucet, 2014; Doucet & Gutman, 2013). In fact, it is important to consider assessments that produce strong evidence to be used in differentiating between those who are fit to drive and those who are not, which is critical in determining licensure. Considering the inconsistency of on-road assessments, even on a planned path, the variables of weather, traffic, and other road hazards—or, perhaps more important, the absence of road hazards—may not provide enough of a challenge. Most on-road assessments are conducted on good weather days and low traffic times, eliminating many of the challenges for at-risk drivers. Thus, the AMPS could be used in lieu of on-road assessments, which truly supports the idea that when a person cannot “manage a stove,” they should not be driving.
In some state jurisdictions, the practitioners may be able to delay a person’s driving retirement by recommending driving restrictions instead of immediate cessation, offering time to accommodate and plan for the transition. In this case, it is important to compare the process and motor logit means (and confidence intervals) to differentiate whether implementing restrictions will reduce the driver’s risk sufficiently or the driver needs to stop driving immediately.
Unfortunately, the training for AMPS is no longer available—a significant loss for the occupational therapy profession. However, the Motor and Process skill items language has been incorporated into important professional documents (e.g., Occupational Therapy Practice Framework: Domain and Process (4th ed.; American Occupational Therapy Association, 2020), and occupational therapy practitioners can use the tenets of the AMPS to document fitness to drive through the evaluation of IADLs using their skills in activity analysis and grading activity and the many papers or chapters describing the hierarchy of AMPS skill items, including the Occupational Therapy Intervention Process Model (Fisher & Marterella, 2019).
Conclusion
This study demonstrated that that AMPS has excellent sensitivity and specificity to be able to predict fitness-to-drive outcomes (i.e., pass or fail, restrictions required). Thus, our study provides strong evidence that observation of complex IADL tasks, specifically using the AMPS, predicts the likelihood of an person passing or failing an on-road assessment. This provides occupational therapy practitioners with a performance-based tool, specific to occupational therapy, that can provide guidance for driving recommendations. Occupational therapists can use this information to counsel at-risk drivers, family members, and primary care providers (who are asked to provide licensing recommendations), as well as state driver licensing agencies.