





Abstract
This study used an approach based on a series of five cognitive tests to determine whether a client should continue driving, undergo further evaluation, or stop driving.
Making determinations about fitness to drive is challenging. Furthermore, most clinicians may lack the time (Vander Veen et al., 2023), have limited training in how to assess fitness to drive (Jang et al., 2007), or lack access to comprehensive driving evaluation protocols that involve clinicians with specialized certification and road tests. For many patients, the source of concern is related to cognitive function. Several tools can help with cognitive assessments, but any one tool alone may lack accuracy (Bédard & Dickerson, 2014; Bédard et al., 2008). One possible solution is to use a battery of tests to increase accuracy, but that approach requires a significant amount of time for test administration, scoring, and integration into some decision-making algorithm (Bennett et al., 2016). Hence, although batteries of tests have been proposed, most preclude a rapid determination.
To reduce the number of tests used while still providing an accurate determination of fitness to drive, Molnar et al. (2009) suggested using serial trichotomization. Specifically, with serial trichotomization, a series of tests are used to classify drivers as safe, indeterminate, or unsafe. After the results on the first test are applied, the driver undergoes the second test only if the results of the first test returned an indeterminate result, and so on. By applying a number of tests in sequence, few drivers should remain classified as indeterminate at the end, potentially streamlining the determination process by classifying the more extreme cases.
Members of our team proposed an approach based on serial trichotomization using five cognitive tests (Gibbons et al., 2017). The tools included both Parts A and B of the Trail Making Test (TMT–A and TMT–B, respectively; Reitan, 1958), the Clock Drawing Test (CDT; Shulman, 2000), the Montreal Cognitive Assessment (MoCA; Nasreddine et al., 2005), and the Motor-Free Visual Perception Test, Third Edition (MVPT–3; Colarusso & Hammill, 2003). These tools are often administered as routine practice in clinical settings, and most clinicians are familiar with them.
To develop their serial trichotomization approach, Gibbons et al. (2017) used the results of a comprehensive driving evaluation as their primary outcome. The evaluation included vision, physical, and cognitive testing, and a road test; the evaluation took approximately 3 hr to complete. A trained occupational therapist and an experienced driving instructor or evaluator worked by consensus, resulting in a definitive safe or unsafe determination for licensing purposes. Using this determination, their approach was based on developing cut points representing 100% sensitivity and 100% specificity for the sample they had. Specifically, for each test used, drivers were deemed safe if they had test results better than the 100% sensitivity cut point, deemed unsafe if test scores were worse than the 100% specificity cut points, and indeterminate if the test scores were between the cut points.
As an example, for the TMT–B, the cut point for 100% sensitivity was 80 s. This means that all drivers who were deemed unsafe required at least 80 s to complete the test; anyone who required less than 80 s was thus necessarily deemed safe. The cut point for 100% specificity was 178 s. This means that all drivers who were deemed safe required 178 s or less to complete the test. Thus, all drivers who took more than 178 s were necessarily deemed unsafe. Using these two cut points, drivers would be deemed safe (<80 s), unsafe (>178 s), or indeterminate (80–178 s).
In their study, Gibbons et al. (2017) reported the TMT–B had the smallest proportion of drivers in the indeterminate area (33.7%); therefore, it was administered first in the serial trichotomization process. Starting with the TMT–B, drivers who took less than 80 s would be deemed safe, and those who took longer than 178 s would be deemed unsafe. Drivers in the indeterminate category (80–178 s) would then proceed to the second test, and so on. Thus, the serial trichotomization approach may require as little as one test and allowed Gibbons et al. (2017) to determine the outcome of a comprehensive evaluation for approximately 78% of participants; the remaining would have been deemed indeterminate. In a clinical setting, that would suggest that only 22% of drivers would require a road test.
Although serial trichotomization appears useful, one issue is that the cut points identified differ from one study to the next, depending on the sensitivity and specificity thresholds used to calculate the cut points. For example, Classen et al. (2013) reported that a cut point of 83 s for the TMT–B resulted in 82% sensitivity. Papandonatos et al. (2015) reported that a cut point of 108 resulted in 88% sensitivity. In addition, cut points are sample dependent and will differ from one study to the next. Nonetheless, given similar clinical profiles, one should expect similar cut points. Two recent studies using retrospective samples and slightly different sets of tools—one study using a physician as the standard (Yamin et al., 2024) and the other using a comprehensive driving evaluation as the standard (Krasniuk & Crizzle, 2024)— returned different, albeit similar, cut points.
Ultimately, testing the value of serial trichotomization should be done with a different sample from the one from which the cut points were derived, and it should be tested as it is meant to be used rather than after the fact. Specifically, serial trichotomization should be implemented prospectively, within a clinical setting for clients for whom a cognitive screen—to be conducted by occupational therapists—is required and where conducting a road test is not always possible. Furthermore, we must formally document the agreement between the outcome resulting from the application of the tests through serial trichotomization and the clinicians’ impressions; this agreement was not quantified in the studies reported earlier. Some agreement between serial trichotomization and clinicians’ impressions is crucial to ensure that occupational therapists, particularly generalists, could use the process with confidence.
Thus, the main objective of the present study was to document the implementation of serial trichotomization within a clinical setting and to quantify its agreement with clinicians’ impressions. Consecutive clients presenting at an outpatient neurology program, and for whom a cognitive driver screen was requested, completed all five cognitive tests. We then applied the serial trichotomization approach outlined by Gibbons et al. (2017) and determined the agreement between its result and the determination of fitness to drive by occupational therapists.
Method
Setting and Participants
The study participants were drawn from consecutive clients who attended an outpatient neurology program between March 1, 2014, and March 1, 2022; clients needed a neurological diagnosis to be referred. Typical clients attended the program after a stroke; other common diagnoses included traumatic brain injury, spinal cord injury, multiple sclerosis, and Parkinson’s disease. The majority came from a regional stroke unit, the neurosurgery program at an acute care hospital, an inpatient rehabilitation unit at a rehabilitation hospital, or a secondary stroke prevention outpatient clinic. The program consists of occupational, physical, recreation, and speech–language therapies, as well as social work support. Clients attend therapy from one to three times per week for 8 to 12 wk after discharge from inpatient care.
The inclusion criteria for the study reported here were the presence of a request for a cognitive driver screen, driving before the onset of neurological symptoms, and wanting to return to driving. Because the serial trichotomization process we used is based solely on cognitive tests, and thus could not accurately identify drivers who should not drive because of a physical issue, referrals were excluded if a physical condition required further investigation before allowing the person to return to driving. For example, people with multiple sclerosis or Parkinson’s disease or people who required adaptive equipment were excluded from the analyses. Fourteen referrals were excluded for this reason.
Assessments
Driver screens were conducted by three generalist occupational therapists who were employed in the program. They administered all five neurocognitive tests that were used by Gibbons et al. (2017), regardless of how well clients performed on the tests. The five neurocognitive tests included the TMT–A and TMT–B (Reitan, 1958), the CDT (Shulman, 2000), the MoCA (Nasreddine et al., 2005), and the MVPT (Colarusso & Hammill, 2003).
TMT–A and TMT–B
The TMT–A and TMT–B measure visual–motor tracking, divided attention, and executive function (Reitan, 1958). The tests have been used in many driving studies. In a review of measures used to assess driving after stroke, the outcome of a road test was statistically associated with both TMT–A and TMT–B scores (Marshall et al., 2007). Values for Parts A and B were capped at 180 and 300 s, respectively, for the statistical analyses.
CDT
The CDT is used as a screening tool to detect cognitive impairment in older adults (Shulman, 2000). A review of published studies on the CDT found high mean sensitivity (85%) and specificity (85%) in identifying cognitive impairment (Shulman, 2000). The scoring system used in our study ranges from 0 to 7, with higher scores representing better cognition. The CDT is associated with driving-simulator (Freund et al., 2005) and on-road (Manning et al., 2014) outcomes.
MoCA
The MoCA is a paper-based cognitive screening tool that takes approximately 10 min to complete (Nasreddine et al., 2005). The MoCA scores range from 0 to 30, where a score of 25 or lower indicates cognitive impairment. The MoCA has demonstrated excellent sensitivity and specificity in detecting mild cognitive impairment (Nasreddine et al., 2005; Smith et al., 2007). Furthermore, it is associated with on-road driving outcomes (Hollis et al., 2015).
MVTP–3
The MVPT–3 was developed to measure various aspects of visual–perceptual skills (Colarusso & Hammill, 2003). Results that were based on 232 older drivers who were referred for evaluation and licensing recommendations indicate that MVPT scores are associated with those recommendations (Oswanski et al., 2007). There are different versions of the MVPT in use. Potential raw scores range from 0 to 65 for the MVPT–3 and from 0 to 45 for the fourth edition of the MVPT (MVPT–4), with higher scores indicating greater visual–perceptual functioning. Alternatively, the MVPT–3 can be scored on a scale ranging from 0 to 52 when the first 13 items are included. Because of the different scoring approaches used, as well as the introduction of the MVPT–4 during the study period, we used the percentage of items that were scored correctly for the version used as our outcome measure. For consistency, we also transformed the cut points from Gibbons et al.’s (2017) study into percentages, resulting in the following cut points: >87.69 = safe, 63.08–87.69 (inclusive) = indeterminate, and <63.08 = unsafe.
Driving Determinations
The three occupational therapists made determinations regarding fitness to drive on the basis of the results of the neurocognitive tests, other clinical information available in the client’s file, and their own clinical judgment. They used observations of the client taking part in other activities, usually as part of their therapy, or in the context of arranging and going to therapy (e.g., way-finding ability within the hospital, ability to follow multistep instructions from other therapists on the team, and ability to follow a schedule), along with input from the interprofessional team. Consistent with a screening approach, road tests had not been conducted at the time of the occupational therapists’ determinations. The possible determinations were safe, indeterminate (requires further assessment), and unsafe.
Data Collection Procedure
We obtained research ethics approval for the study before data collection. Trained research assistants reviewed the charts of all eligible clients and recorded the relevant information using Research Electronic Data Capture (REDCap) tools (Harris et al., 2009, 2019). REDCap is a secure, web-based software platform designed to support data capture for research studies, providing an intuitive interface for validated data capture; audit trails for tracking data manipulation and export procedures; automated export procedures for seamless data downloads to common statistical packages; and procedures for data integration and interoperability with external sources. The data were exported to SPSS, Version 28, for analysis.
Analyses
We provide descriptive statistics using means, standard deviations, and proportions for demographic and clinical characteristics, as well as test results. We compared demographic characteristics and the mean test scores across groups (which were based on the occupational therapists’ determinations) using chi-square tests for categorical data and between-groups, one-way analyses of variance for continuous data. For the latter, and because we have large differences between sample sizes, we used a method robust to variance heterogeneity and reported the Welch F test followed by the Games-Howell method for pairwise comparisons (Sauder & DeMars, 2019), as well as effect sizes (omega-squared, fixed effect).
To document agreement between the test results and the occupational therapists’ determination, we used the cut points reported by Gibbons et al. (2017), and presented in Table 1, as the starting point to classify drivers. Agreement between these classifications and the occupational therapists’ determinations was then quantified using a weighted κ with quadratic weights (Landis & Koch, 1977). The agreement descriptors corresponding to κ values are as follows: <0 = poor; 0–.20 = slight; .21–.40 = fair; .41–.60 = moderate; .61–.80 = substantial; .81–1.00 = almost perfect (Landis & Koch, 1977).
Note. MoCA = Montreal Cognitive Assessment; MVPT = Motor-Free Visual Perception Test.
With the 7-point scoring method, a score greater than 7 is not possible.
MVPT values are based on the percentage of items answered correctly.
Results
A total of 279 eligible referrals for a cognitive driver screen were received. The most common documented referral sources (available for 209 referrals) were physicians (48.3%), nurse practitioners (25.8%), and the stroke management clinic of the local acute care hospital (25.8%). The mean age of the clients was 66.35 yr (SD = 13.25; range = 21–94; data were missing for 4 clients), and two-thirds were male (186; 66.7%). A total of 163 clients were married or common-law partners (58.4%). The majority of clients had a suspended or revoked license (244; 87.5%), and for most of these clients, driving cessation was involuntary (229; 93.9%). The average number of medications used was 7.32 (SD = 5.31; range = 0–28).
Using the cut points presented in Table 1, we calculated the number of tests passed (i.e., client was deemed safe) and failed (i.e., client was deemed unsafe). These results are presented in Table 2. None of the clients passed or failed all tests, and only a few clients passed or failed a majority of tests. In other words, test scores frequently fell between the pass–fail cut points (i.e., within the indeterminate area), suggesting that there was some valid uncertainty about these drivers.
Cross-Tabulation of the Number of Tests Passed Versus the Number of Tests Failed
We compared demographic characteristics and test results across the three groups resulting from the occupational therapists’ determinations (safe, indeterminate, unsafe). The age difference across groups was statistically significant, F(2, 91.55) = 26.38, p < .001. Specifically, each mean age differed from the other two: safe, M = 61.00 (SD = 12.81); indeterminate, M = 68.92 (SD = 12.22); and unsafe, M = 76.03 (SD = 10.19). There were no differences between groups regarding the referral source, χ2(6) = 10.24, p = .115. Marital status was dichotomized as married or common law versus other to deal with cells with low frequencies; we did not find a difference across groups, χ2(2) = 5.21, p = .074. Finally, we also found a difference across groups for the number of medications taken, F(2, 80.79) = 12.74, p < .001. Specifically, drivers in the safe group (M = 5.57, SD = 4.68) took a lower number of medications than those in the indeterminate (M = 8.43, SD = 5.25) and unsafe (M = 9.42, SD = 5.98) groups. Given that the vast majority of drivers had a suspended or revoked license, and that driving cessation was involuntary, we did not compare groups for these two variables.
The mean scores on the five tests were statistically different across the three groups and had large effect sizes (Table 3). Furthermore, for all five tests, there was a clear gradient from the safe group to the unsafe group; all pairwise comparisons were statistically significant (p < .05) except the CDT comparison between the indeterminate and unsafe groups (p = .222). For example, for the TMT–A, the means were respectively 33.96, 46.09, and 65.47 s. The minimum and maximum values were somewhat similar for the safe and indeterminate groups but more saliently different for the unsafe group.
Means (and Standard Deviations) for Each Group Separately, According to the Occupational Therapists’ Determination
Note. CDT = Clock Drawing Test; CI = confidence interval; max = maximum; Min = minimum; MoCA = Montreal Cognitive Assessment; MVPT = Motor-Free Visual Perception Test; TMT–A = Trail Making Test, Part A; TMT–B = Trail Making Test, Part B.
Means with different subscripts are statistically significantly different from each other according to the Games-Howell test, p < .05. For example, the means for the TMT–A have different subscripts, meaning that they are statistically significantly different from each other.
The F value reported was obtained using the Welsh method; accordingly, degrees of freedom for the denominator differ for each analysis.
Effect sizes presented are ω2 (fixed effect).
Values for the MVPT are the percentage of the maximum value possible for the version used.
The agreement between the tests’ scores (using the cut points) and the occupational therapists’ determinations is presented in Table 4. Weighted κs ranged from a low of .03 (95% confidence interval [CI] [−.01, .08]) for the CDT, to a high of 0.54 (95% CI [.46, .62]) for the TMT–B. The agreement between the serial trichotomization results and the occupational therapists’ determinations was moderate (κ = .59; 95% CI [.50, .67]). However, it is worth noting that the κ value of .59 is at the top of the range for the moderate category, making it markedly close to the substantial agreement category. There are two cells where there could be an important divergence between serial trichotomization and the occupational therapists’ determinations, specifically, where one would deem the client safe to drive and the other would deem the client unsafe. No clients were deemed safe according to serial trichotomization but unsafe by the occupational therapists. However, 10 clients were deemed unsafe according to serial trichotomization but safe according to the occupational therapists. Through serial trichotomization, 45.9% of clients would have been deemed safe, 26.2% would have been deemed indeterminate, and 28.0% would have been deemed unsafe (Figure 1).
Agreement of Determination Between Tests and Serial Trichotomization and Occupational Therapists’ Determination
Note. CDT = Clock Drawing Test; CI = confidence interval; MoCA = Montreal Cognitive Assessment; MVPT = Motor-Free Visual Perception Test; TMT–A = Trail Making Test, Part A; TMT–B = Trail Making Test, Part B.
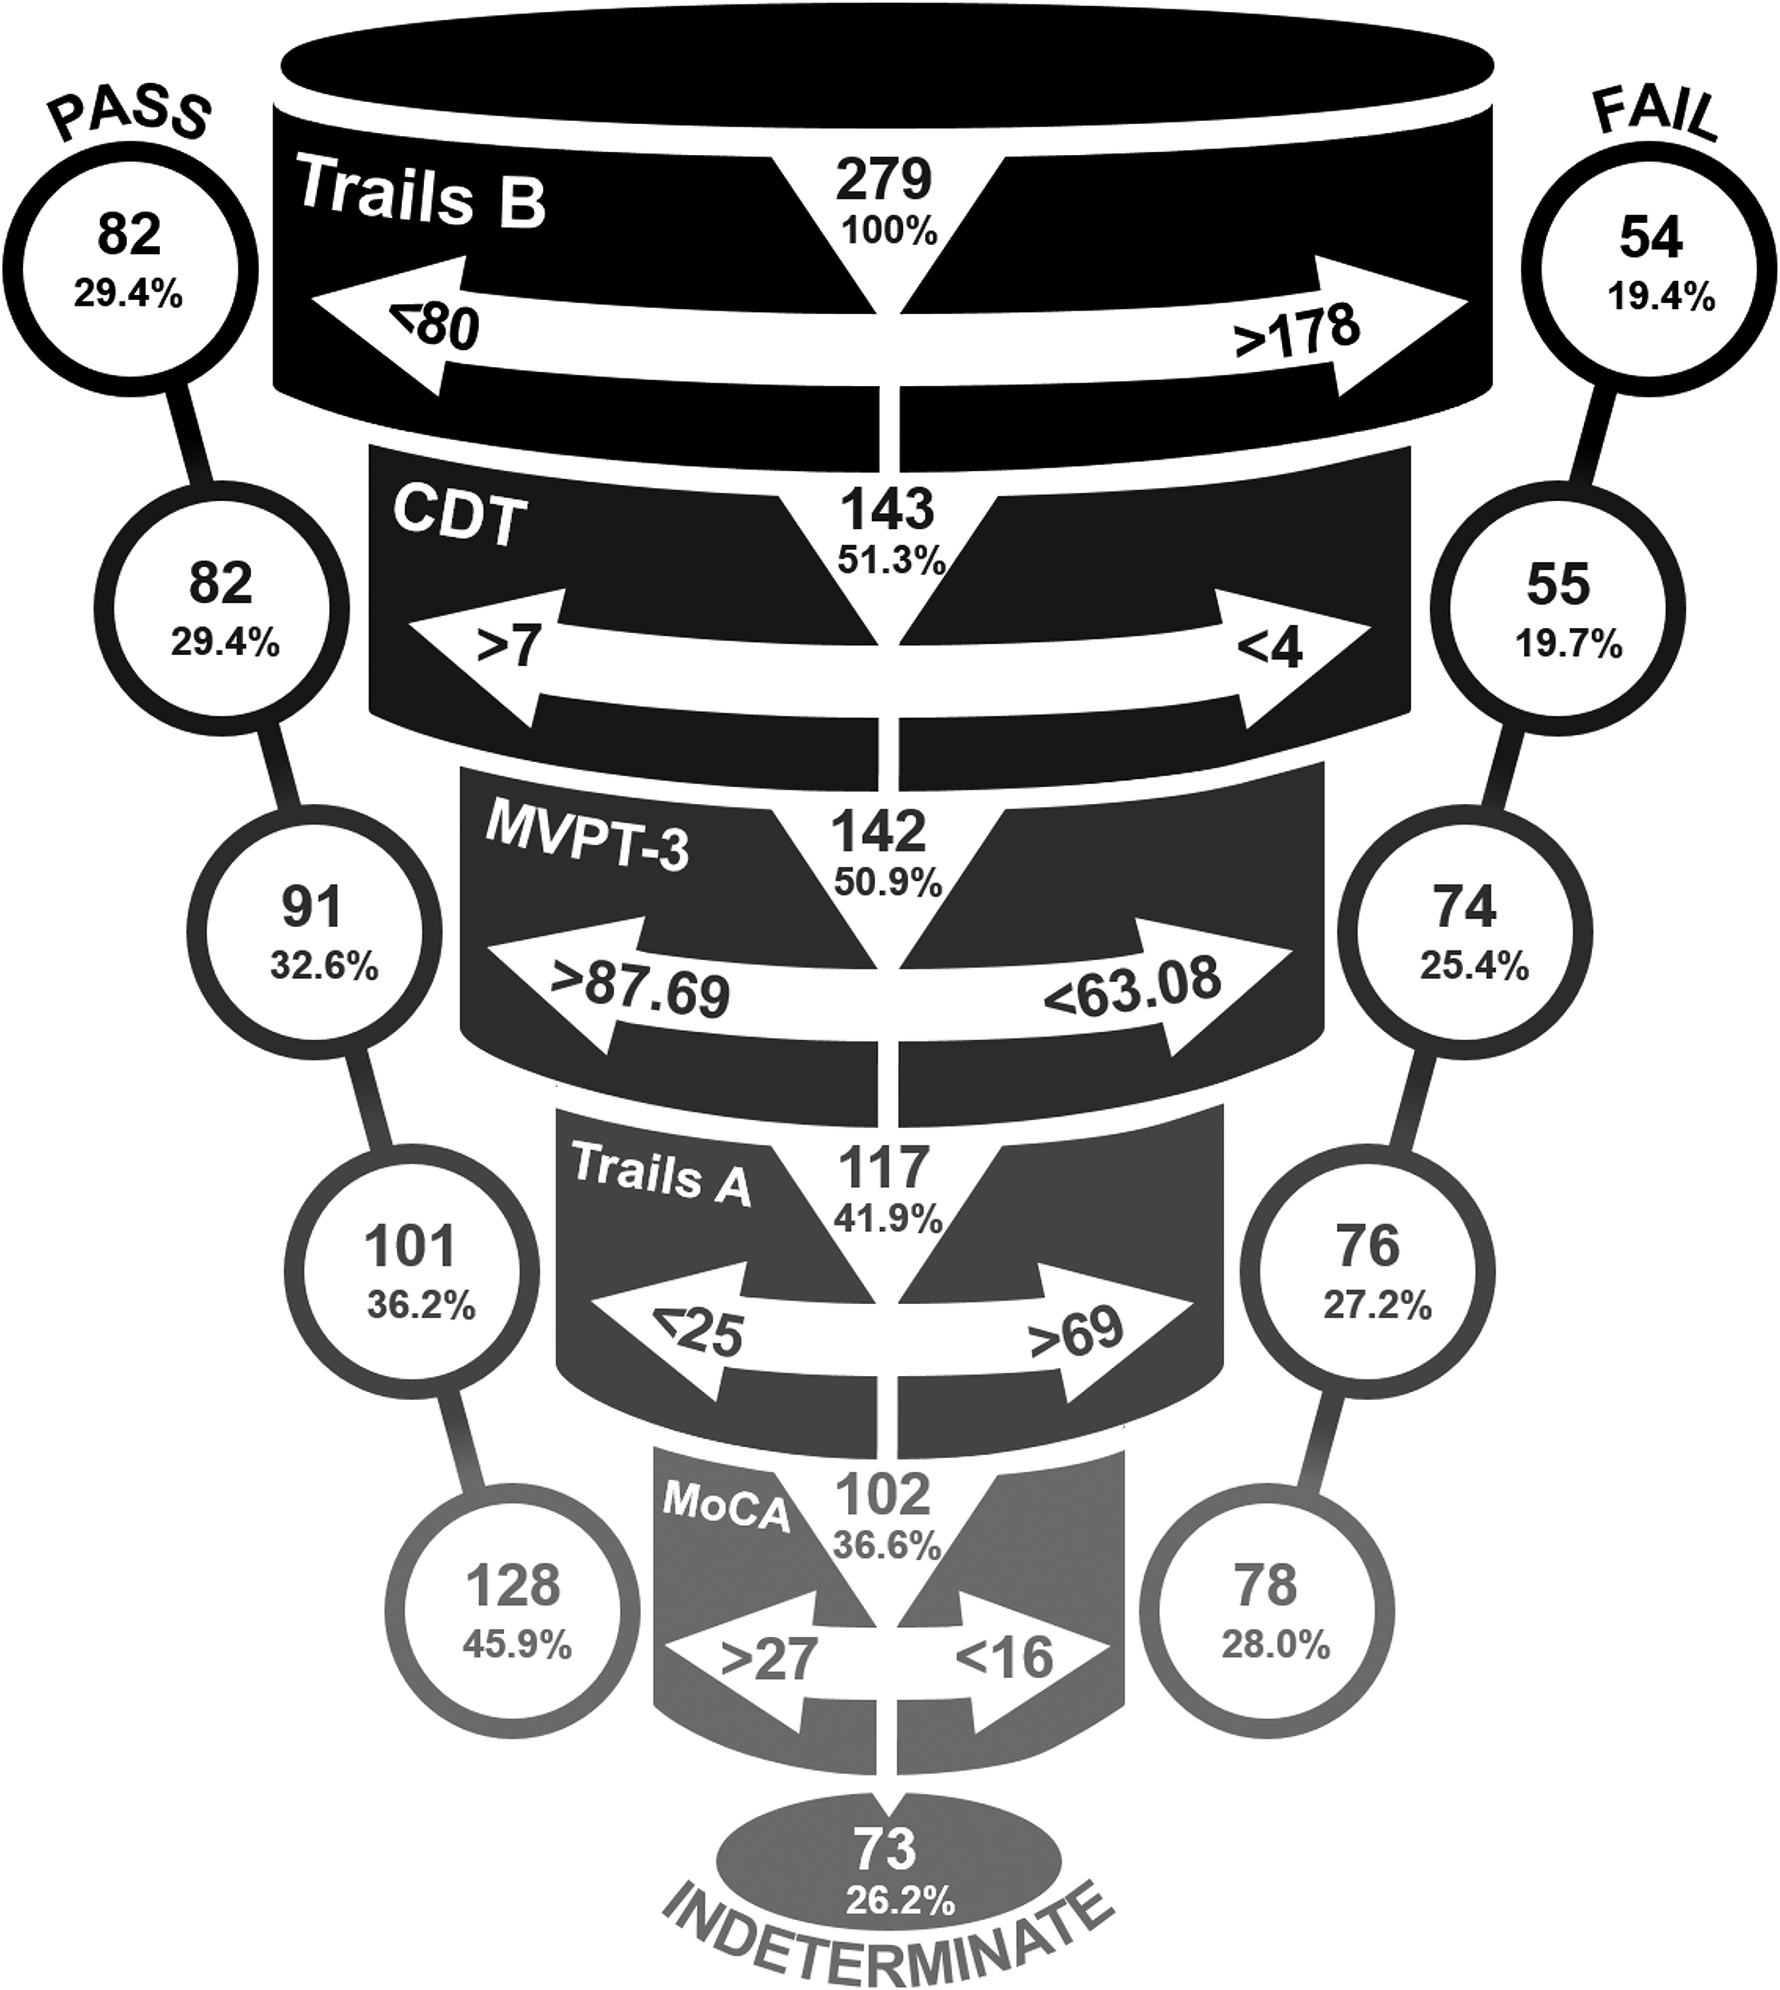
Results of the serial trichotomization process using all five tests.
Discussion
We set out to quantify the agreement between a serial trichotomization process to determine fitness to drive (Gibbons et al., 2017) and a clinical determination made by occupational therapists. We found moderate agreement between the approaches, but indications that serial trichotomization may be particularly useful in identifying unsafe drivers. In addition to the tests used in this study, the occupational therapists had access to other information and clearly used that information in making their determinations, confirming that clinical judgment remains an important aspect when evaluating fitness to drive (Marson, 2022).
The agreement between the tests and the occupational therapists’ determinations ranged from moderate (TMT–B) to fair (TMT–A, MVPT, and MoCA) to slight (CDT). Although both parts of the TMT are sensitive to progressive cognitive decline as seen in dementia, the TMT–A is primarily characterized as a measure of processing speed (Tombaugh, 2004), whereas the TMT–B assesses divided attention, attention switching, and set shifting, which are all tasks particularly important for driving (Classen et al., 2013). In addition, our findings may reflect that the 100% sensitivity cut point identified by Gibbons et al. (2017), 178 s, is nearly identical to the cut point recommended by others. The authors of a systematic review concluded that 180 s is the best evidence-informed cut point to identify unsafe drivers (Roy & Molnar, 2013). Using a sample of clients who had a stroke, Barco et al. (2014) found that none who failed a road test took less than 95 s to complete the test, and none who passed the road test took more than 217 s. These values approach the cut points of 80 and 178 used here. That said, the cut points identified by Krasniuk and Crizzle (2024) created a larger indeterminate area than ours. In the study by Barco et al. (2014), the mean times for the clients who passed and failed the road test were 108 and 205 s, respectively. For their sample of cognitively impaired clients, Krasniuk and Crizzle (2024) reported means of 121 and 333 s, respectively. In yet another study, mean times for clients with a neurological diagnosis who passed and failed a road test were 91 and 125 s, respectively (Holowaychuk et al., 2020). These mean times approach those found in the present study for the safe group (M = 87) but are more divergent for the unsafe group (M = 249).
Another approach for examining TMT results is to contrast them with existing normative data (Tombaugh, 2004). Using the age category of 65 to 69 yr as a comparator (the mean age for our clients was 66), we found that the mean values for the TMT–A were less than the 60th percentile for the safe group, less than the 20th percentile for the indeterminate group, and less than the 10th percentile for the unsafe group. For the TMT–B, the percentiles were 40, 10, and 10, respectively. Realistically, the mean for the unsafe group is likely below the fifth percentile.
Results from the CDT also deserve discussion. In the present study, there is little difference in mean CDT scores between groups. However, the range is quite different: None of the clients who were deemed safe scored below 5, whereas some clients who were deemed unsafe scored as low as 2. The upper cut point of greater than 7 that we used for serial trichotomization does not seem logical, but it does reflect that the CDT may not be discriminative for fitness to drive at the upper end. In Gibbons et al.’s (2017) study, some drivers who failed the comprehensive evaluation, and for whom revocation of the driving privilege was recommended, nonetheless scored seven on the CDT. Manning et al. (2014), as well as Barco et al. (2014), also found that clients who failed a road test may score 7 on the CDT. Freund et al. (2005) found that none of the drivers who failed their simulated driving test had CDT scores greater than 6. However, this slightly divergent result may be explained by the use of different outcome measures. Nonetheless, evidence from our work and that of others indicates that if clients do extremely poorly on the CDT, there is genuine reason for concern about their fitness to drive, whereas doing well does not equate to the absence of concerns.
A somewhat similar pattern appeared with the MoCA. Although the group means were roughly similar for the safe and indeterminate groups but somewhat lower for the unsafe group, the real story appears when examining the range of scores. None of the clients who were deemed safe scored less than 19, and this value was 15 for the indeterminate group. In contrast, clients in the unsafe group scored as high as 28 but as low as 8. In a finding consistent with ours, Hollis et al. (2015) determined that scores less than 19 on the MoCA should raise concerns about fitness to drive. Their cut points for 100% sensitivity and specificity (26 and 16) were also similar to those in the study by Gibbons et al. (2017; 27 and 16). Therefore, it would appear that low scores on the MoCA are meaningful, but high scores are not necessarily so.
Finally, the results of the MVPT indicate important differences between group means and ranges. Specifically, scores for clients in the safe group ranged from 57.78 to 98.46, whereas for clients in the unsafe group, scores ranged from 37.78 to 75.56. Nonetheless, the agreement between the MVPT classification and the occupational therapists’ determinations was only fair. Holowaychuk et al. (2020) expressed concerns about the MVPT, and their results appear to indicate that the MVPT provides limited additional information to the TMT–B in determining fitness to drive.
There are two important limitations to our study. The first is that the original study by Gibbons et al. (2017) used a definitive safe–unsafe outcome that was based on a comprehensive evaluation that included a road test, the current gold standard. On the other hand, the present study was based on a cognitive screen and other clinical information, but without a road test. We cannot confirm that the occupational therapists’ determinations would have been identical to the outcome of a comprehensive evaluation or that of a road test. The second limitation is the introduction of incorporation bias (Worster & Carpenter, 2008). Specifically, the occupational therapists used (incorporated) the results of the tests they administered in their determinations. Hence, one may guess that the agreement that we observed between serial trichotomization and the occupational therapists’ determinations is greater than it would have been if the test results had not been available to the occupational therapists.
Nonetheless, our work provides evidence for the usefulness of serial trichotomization, particularly if clients do poorly on the tests. Although the approach is not perfect, it may help streamline the assessment of cognitive fitness to drive for some clients. The approach and the tests that we used are appropriate where occupational therapists are available. The tests are familiar and do not require special equipment (e.g., computers). Furthermore, the simplicity of some tests (e.g., the CDT and TMT) and the short amount of time required for their administration are important benefits. Moreover, we conducted our study within a clinical setting where questions about fitness to drive are frequent, and we included all consecutive clients regardless of age, referral source, and diagnosis (except clients also requiring a physical assessment); it is possible that serial trichotomization may operate optimally within subgroups of clients.
As shown in other studies (Krasniuk & Crizzle, 2024; Yamin et al., 2024), serial trichotomization also provides clinicians with flexibility about the tools they want to use. Other related approaches—for example, using combinations of two tests (Barco et al., 2014)—also provide clinicians with options that may best fit their clinical settings. In primary care settings where occupational therapists are not available, approaches that rely on risk stratification as a first step in the decision-making process may be desirable (Marshall et al., 2023).
Implications for Occupational Therapy Practice
Determining someone’s fitness to drive in the presence of a cognitive impairment remains a challenging task. This study has the following implications for occupational therapy practice. ▪ Serial trichotomization can support decision making by streamlining the assessment process, particularly for identifying unsafe drivers, and can be adapted to the specific cognitive tests used in one’s practice. ▪ Our study illustrates that relying solely on cognitive tests is imperfect and attests to the importance of clinical judgment and road tests in the decision-making process.
Conclusion
The serial trichotomization process achieved a moderate level of agreement with the occupational therapists’ determinations. Our results also attest to the complex, multifactorial nature of the driving task and to the finding that any single test is unlikely to capture all cognitive domains that support safe driving. That said, some tests may be more closely related to the essential components underlying fitness to drive, as evidenced by the better performance of some tests than others. This also points to the possibility to further streamline the serial trichotomization process. For example, although the TMT–B contributed greatly to the serial trichotomization process, the CDT only enhanced the determination for one driver. In Gibbons et al.’s (2017) study, the CDT helped classify only two drivers once they accounted for the TMT–B results. Given that most drivers in our sample fell within the indeterminate area of the CDT, the test may provide limited added value to the other tests.
The overlap in the range of scores between safe and unsafe drivers exemplifies the inherent difficulty in selecting cut points, and the risk in using only one test to make determinations about fitness to drive, unless performance on the test is extremely poor. Furthermore, every sample will return different cut points. Over time, the best cut points could possibly be identified by consensus or meta-analytical techniques, but this work remains to be done. Identifying these cut points may help address concerns that making a determination on the basis of a single test is suboptimal (Dickerson et al., 2019). Until then, serial trichotomization and related approaches should be used as supporting evidence in the decision-making process rather than as sole arbitrator, reminding us of the importance of road tests in making fitness-to-drive determinations. Moreover, because the negative consequences of driving cessation are well documented (Mullen & Bédard, 2009), we suggest that clinicians err on the side of patient autonomy and independence unless the test results (and other information) provide clear-cut evidence of sufficient impairment to warrant revocation of the driving privilege.
Footnotes
Acknowledgments
This work was made possible through funding from the Canadian Institutes of Health Research (Grant 130389) and support from St. Joseph’s Care Group.