





Abstract
The study authors used Medicare data to characterize the variation in hospital use of acute occupational therapy and to identify how Medicare’s Comprehensive Care for Joint Replacement affected acute OT use by hospitals.
Alternative payment models, including bundled payment, have been widely implemented by policymakers to reign in high health care costs in the United States (Pritchard et al., 2019). Medicare’s Comprehensive Care for Joint Replacement (CJR) program incentivizes hospitals to identify the most cost-efficient care for patients undergoing joint replacement from hospitalization to 90 days postdischarge by rewarding those that achieve low total Medicare spending while maintaining quality (Centers for Medicare & Medicaid Services [CMS], 2015). Current studies indicate that hospitals have incorporated interventions such as decreasing postacute care use, internal data sharing among surgeons, streamlining surgical pathways, using a centralized coordinator, and presurgical education classes in response to CJR (Barnett et al., 2019; Finkelstein et al., 2018; Lewin Group, 2020; Sood et al., 2019; Wilcock et al., 2020). Only one study has documented a handful of hospitals in CJR that expanded acute occupational therapy (OT) to all patients with joint replacement after achieving promising results (Lewin Group, 2020). Thus, although understudied, these case studies are consistent with prior literature, demonstrating that greater use of acute OT is inversely correlated with hospital readmission rates for patients with heart failure, acute myocardial infarction, or pneumonia (Rogers et al., 2017).
Although prior studies suggest that interdisciplinary approaches focusing on the person as a whole may improve care coordination, patient outcomes, and health care spending, how acute OT, which emphasizes whole-person care, is leveraged in alternative payment models broadly and in CJR explicitly is unknown (Benbassat & Taragin, 2000; Edgman-Levitan & Schoenbaum, 2021). In theory, acute OT can benefit patients and reduce episode spending (Pritchard et al., 2019). OT entails education, compensatory techniques, and remedial interventions to maximize patient function and ensure safe and appropriate discharge care (Roberts et al., 2020). OT practices such as preoperative instruction, early mobility, and fall and infection prevention may reduce postacute care and readmissions (Pritchard et al., 2019; Roberts et al., 2020), decreasing Medicare spending and improving hospital performance in CJR. Nonetheless, for hospitals to increase acute OT services, total costs from service provision must be worthwhile relative to financial returns. To our knowledge, no large-scale studies exist to date that informs the extent to which acute OT is used among patients with joint replacement under CJR or how the use of acute OT services correlates with hospital financial performance under CJR.
Our objective was, therefore, threefold. First, we sought to describe the variation across hospitals in the United States in providing acute OT to patients with joint replacement who were enrolled in Traditional Medicare insurance from 2016 to 2018. Second, leveraging the experimental design of CJR, we estimated the causal effect of CJR on acute OT costs per hospitalization. We used national data from 2014 to 2018 in a difference-in-differences design to compare acute OT provision (measured as OT dollars per hospitalization, the share of hospitalizations receiving any OT, and OT share of total hospitalization costs) before and after the adoption of CJR. Third, focusing on CJR hospitals using multivariable regression, we examined the association between acute OT provision and CJR rewards (CJR reward dollars per hospitalization) in the program’s first 3 yr. Our findings provide foundational knowledge to policymakers and providers on the potential value of acute OT in bundled payment arrangements.
Method
Design for Medicare’s Comprehensive Care for Joint Replacement Program
The CMS randomly selected 75 of the 196 metropolitan statistical areas (MSAs) and all eligible hospitals within them to participate in CJR for the program’s first 2 yr, from April 2016 through December 2017 (CMS, 2015). The program became voluntary starting in its third year in 2018. Thus, beginning in 2018, hospitals in the randomly selected treatment MSAs were no longer mandated to participate. CJR hospitals are held financially accountable for care quality and Medicare spending for each episode of care for hip or knee joint replacement (Diagnosis-Related Group [DRG] 469, major joint replacement or reattachment of the lower extremity with major complications or comorbidities, or DRG 470, major joint replacement or reattachment of the lower extremity without major complications or comorbidities), lasting from hospitalization through 90 days postdischarge. At the end of each performance year, hospitals that achieve per- episode spending below a predetermined target threshold set by CMS and meet minimum quality standards receive financial rewards. Each reward is the difference between the target threshold and actual spending, up to a cap. Hospitals that exceed the target threshold must pay CMS the difference.
Study Sample
To first describe national variation in acute OT costs, our sample included 1,319,343 discharges with hip or knee joint replacement (DRG 469 or DRG 470) from 3,493 hospitals in 306 hospital referral regions (HRRs) from 2016 to 2018. We included patients with continuous coverage through Medicare Parts A and B in the month of hospitalization through 90 days postdischarge, patients who were ages 65 yr or older, and those who were not eligible for Medicare because of endstage renal disease.
To estimate the effects of CJR on acute OT costs per hospitalization, we retained 1,006,938 discharges with joint replacement from 1,646 hospitals from within one of 195 MSAs (75 treatment and 120 control MSAs) eligible for CJR after excluding 239 hospitals in Bundled Payment for Care Improvement Models 1, 2, and 4, which were exempt from CJR. Discharges were included if they occurred between July 2014 and June 2015 (pre-CJR) or between April 2016 and December 2018 (post-CJR). We excluded data from the period between CJR announcement and implementation (July 2015 and March 2016) to ensure that any pre-CJR data were not contaminated by anticipation bias. One MSA was removed because of lack of data after our exclusion criteria, resulting in a total of 195 instead of 196.
To assess the association between acute OT provision and CJR rewards, we limited the sample to CJR hospitals (n = 606) and created a hospital-year level dataset (n = 1,448) focusing on CJR’s first three performance years (2016–2018). Each hospital-year observation was created from each hospital’s total number of discharges with joint replacement from April 2016 through December 2016 (Performance Year 1), January through December 2017 (Performance Year 2), and January through December 2018 (Performance Year 3).
Study Data
We used several data sources. We used 100% Medicare Provider Analysis and Review (MedPAR) to capture OT services provided to each hospitalization, total hospitalization costs, and primary and secondary diagnoses. We obtained patient demographic and insurance enrollment information from the Master Beneficiary Summary File base segment. We gathered hospital characteristics from cost reports, provider of service files, bundled payment operational files, the American Community Survey, and the Dartmouth Atlas of Health Care.
Study Variables and Statistical Analysis
To examine the national distribution of acute OT costs from 2016 to 2018, we calculated average acute OT costs per hospitalization by HRR. HRRs are geographic units developed by the Dartmouth Atlas of Health Care commonly used in the health services literature to examine geographic variation in health care spending and utilization (Kilaru et al., 2015; Wennberg et al., 1998). Charges for each hospitalization were multiplied by hospital-specific cost-to-charge ratios to arrive at per-hospitalization costs (Rogers et al., 2017). We used this approach for all measures of costs in the study.
To discern whether CJR had affected acute OT provision, the main dependent variables focus on acute OT costs per hospitalization, which included average OT costs per hospitalization, the likelihood of receiving any OT services, and acute OT costs as a share of total hospitalization costs. The main independent variable was CJR treatment status. For these variables, we then used linear regression with a difference-in-differences design to estimate the average change in acute OT outcomes, comparing hospitalizations occurring in treatment and control MSAs before and after CJR. The difference-in-differences design controls for time-invariant hospital characteristics and secular changes before and after CJR, which has the added benefit of reducing residual confounding within an experimental design. For instance, the difference-in-differences design controls for secular trends, such as the rise in same-day joint replacement surgeries at outpatient and ambulatory surgery centers in lieu of inpatient care in recent years (Carey & Morgan, 2020). We also controlled for patient-level covariates, which included age, sex, race and ethnicity, Medicare and Medicaid dual eligibility status, surgical complications (DRG 469 vs. 470), day and quarter of admission, individual Elixhauser comorbidities, and number of Elixhauser comorbidities. We clustered standard errors at the MSA level because treatment was assigned to MSAs.
In our assessment of the association between acute OT provision and CJR rewards, the dependent variable was CJR reward dollars publicly reported per episode. The main independent variable was average per-hospitalization acute OT costs among discharges receiving acute OT. We also examined additional independent variables, including average per-hospitalization acute OT costs and percentage of each hospital’s discharged patients receiving acute OT.
We used multivariable linear regression to estimate the association between acute OT provision and CJR rewards. In these hospital-level regressions, we controlled for hospital-level covariates, which included average patient age, percentage of female patients, percentage of patients by race and ethnicity, percentage of patients with Medicare and Medicaid dual eligibility, average number of Elixhauser comorbidities, percentage with complications, total number of joint replacement procedures, ownership model, safety-net status, teaching status, number of beds, urbanicity, the poverty rate in the hospital’s county, and year. We clustered standard errors at the hospital level to account for repeated observations within the hospital.
All analyses were conducted using Stata (Version 18) software. Linear regressions were implemented using the Stata command REGHDFE (Correia, 2014).
Results
Nationally between 2016 and 2018, the median per-hospitalization acute OT cost across all HRRs was modest at $101.86 (interquartile range $71.58). There was substantial variation across geography. The highest costs per hospitalization were in San Mateo, CA ($335.73), and the lowest was in Lakeland, FL ($1.50). Costs were generally higher among midwestern and northeastern states and lower among regions of the southwest and southeast (Figure 1).
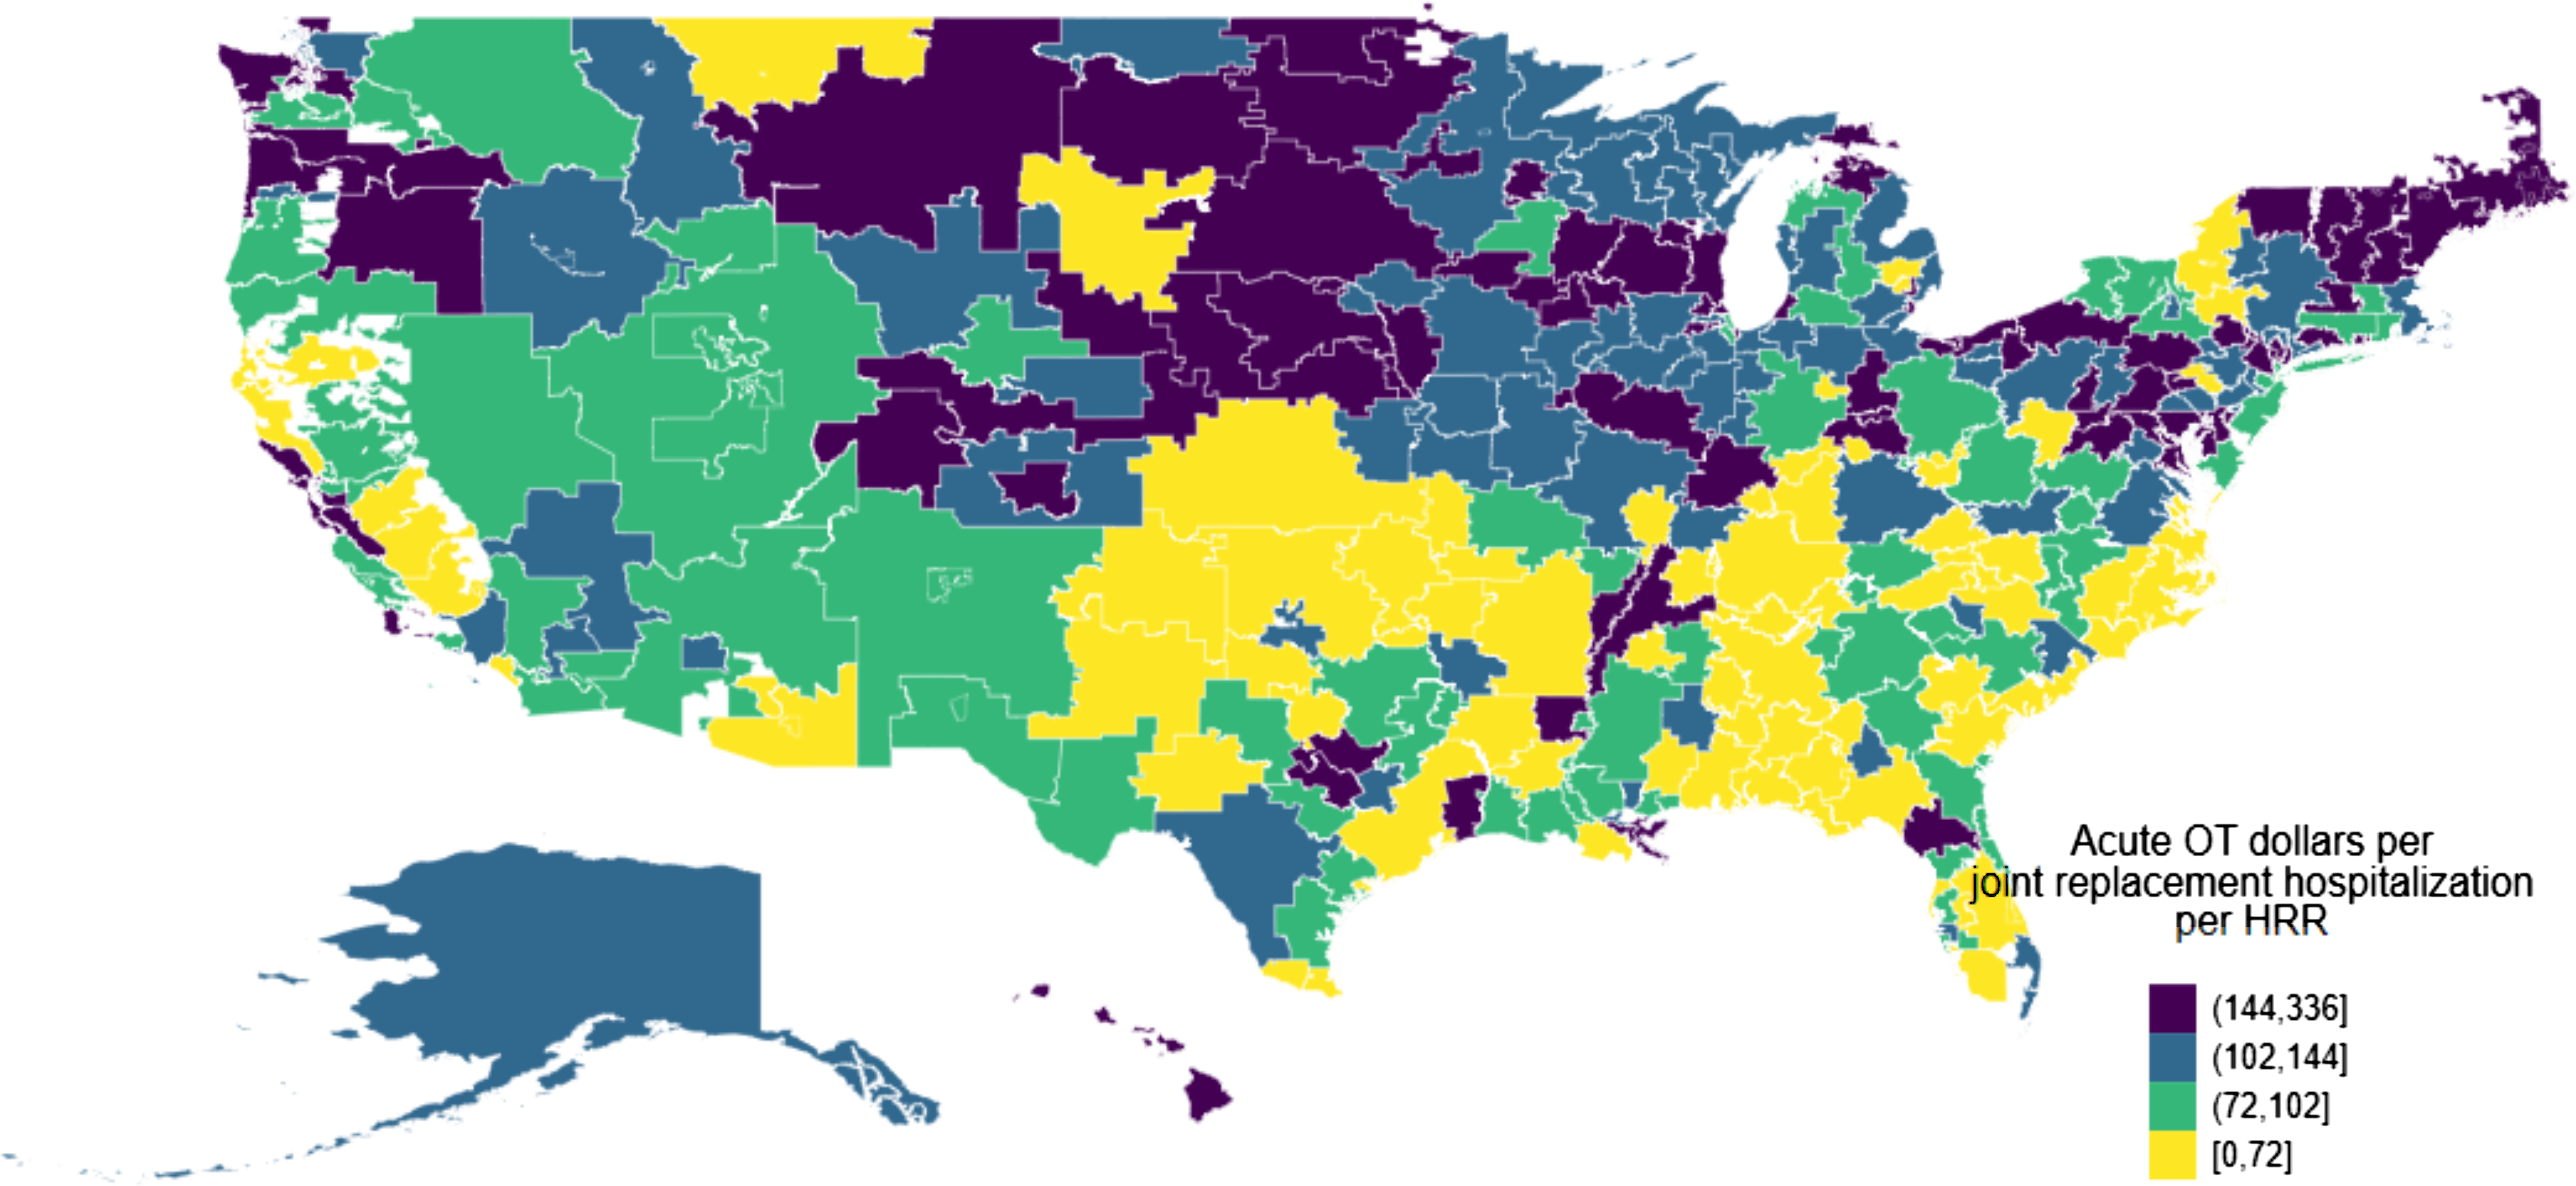
Average acute occupational therapy dollars per joint replacement hospitalization across hospital referral regions in the United States, 2016–2018
Table 1 shows unadjusted, descriptive statistics of the CJR analytic sample, comparing treatment and control groups before and after CJR. Treatment and control groups were similar before CJR, which suggests that CMS’s randomization was successful. Patients in both treatment and control groups were similarly likely to receive acute OT services during their hospitalization (67.67% vs. 58.93%) and at similar amounts of acute OT on average ($111.26 vs. $91.55 overall; and $164.41 vs. $155.35 among those receiving acute OT services). For both groups, acute OT constituted a small share of their total hospitalization costs (<1%).
Descriptive Statistics of the Analytic Sample, Comparing Treatment and Control Groups, Before and After CJR Implementation
Note. Means and 95% CIs are displayed for pre-CJR (7/2014–6/2015) and post-CJR (4/2016–12/2018) periods for the treatment and control groups. CI = confidence interval; CJR = Medicare’s Comprehensive Care for Joint Replacement program; MSA = metropolitan statistical area; OT = occupational therapy.
Other characteristics indicate that the average Medicare patient hospitalized for joint replacement was approximately age 75 yr, was more likely female and White, and had slightly over two comorbidities. The hospitals used by patients were approximately 50% teaching, of which approximately a quarter to a third were safety-net institutions, primarily large urban organizations with about 300 beds, and approximately 15% were located in counties below poverty rates. Over time, volume of hospitalization for joint replacement decreased for treatment and control hospitals, and fewer patients received care from for-profit hospitals.
Table 2 displays means, mean differences, and difference-in-differences estimates obtained from regression for three acute OT measures (see Tables A.2–A.4 for all coefficients and Figures A.1–A.3 for means over time [in the Supplemental Material, available online with this article at https://research.aota.org/ajot]). Overall, there was no evidence that CJR changed hospitals’ provision of acute OT services for patients with joint replacement. Comparing means, the acute OT costs per hospitalization increased by $1.34 for the treatment group and $2.29 for the control group. The differential effect, or causal estimate, of CJR on average acute OT costs per hospitalization was a statistically nonsignificant decrease of −$2.85; 95% confidence interval (CI) [−8.73, 3.02], p =. 34. Likewise, the likelihood for a person hospitalized to receive acute OT services also increased in both the treatment and control groups, yielding a nonstatistically significant differential effect of −0.67 percentage points; 95% CI: [−3.73, 2.40], p =. 67. Finally, the share of acute OT hospitalization costs remained low for both groups over time, yielding a statistically nonsignificant effect of −0.01 percentage points; 95% CI [−0.06, 0.04], p =. 79. These results were robust to excluding 2018 data when hospital participation in randomly selected MSAs became mandatory (see Table A.1 in the Supplemental Material).
Association Between CJR and Acute OT Service Provision Measures
Note. Estimates are based on 1,006,938 discharges from 195 metropolitan statistical areas. Outcomes are acute OT costs per hospitalization, acute OT recipient share, and acute OT as share of total costs. Each column represents a separate regression, all of which include covariates: age, sex, race and ethnicity, Medicare–Medicaid dual-eligibility status, surgical complications (DRG 469 vs. DRG 470), day and quarter of admission, individual Elixhauser comorbidities, and number of Elixhauser comorbidities. CI = confidence interval; CJR = Medicare’s Comprehensive Care for Joint Replacement program; DRG = Diagnosis-Related Group; OT = occupational therapy.
Table 3 shows the associations between acute OT provision and CJR reward dollars, focusing on the first 3 years of the CJR (see Tables A.5–A.7 for all coefficients) . The results suggest that acute OT was positively associated with CJR rewards. On average, hospitals in CJR received rewards of $395.8 per hospitalization per year. Each additional dollar spent on acute OT on OT service recipients correlated with a $1.99 increase in CJR rewards; 95% CI [0.82, 3.16], p =. 001. Secondary independent variables showed similar but statistically imprecise associations with CJR rewards. Each additional dollar of acute OT spent on a hospitalized patient was associated with a nonstatistically significant increase of $0.90 (95% CI [−0.01, 1.82], p =. 05) in rewards when including all patients (recipients and nonrecipients of OT services) and a higher percentage of hospitalizations receiving acute OT services was directionally positive but not statistically significantly associated with more rewards ($0.56); 95% CI [−1.69, 2.80], p =. 63.
Association Between CJR Reward Dollars and Acute OT Service Provision
Note. Each independent variable (acute OT costs per hospitalization, acute OT costs per hospitalization among OT recipients with any costs, and acute OT recipient share) is examined against the outcome CJR reward dollars. Sample was limited to hospitals participating in the CJR. Each column represents a separate regression, with and without covariate adjustment. Covariates in the adjusted regressions include hospital-level average patient age, percentage of patients who are female, percentage of patients by race and ethnicity, percentage of patients with Medicare–Medicaid dual eligibility, average number of Elixhauser comorbidities, percentage of patients with complications, total number of joint replacement procedures, ownership model, safety-net status, teaching status, number of beds, urbanicity, the poverty rate in the hospital’s county, and year. CI = confidence interval; CJR = Medicare’s Comprehensive Care for Joint Replacement program; OT = occupational therapy.
Discussion
Current research has not explored the association between the use of acute OT services and hospital financial performance under Medicare’s CJR bundled payment model. We specifically explored the variations in the use of acute OT services, acute OT costs per joint replacement hospitalization, and the association between acute OT spending and CJR rewards in the program's first 3 years. We used a difference- in-differences design within a randomized study to gain statistical efficiency and to be comparable with other studies of CJR. We found that, from 2016 through 2018, Medicare patients hospitalized for joint replacement received a median of $102 in acute OT services during their hospitalization. Despite the potential for OT to improve patient-centered care, the CJR had no detectable effect on acute OT provision, whether measured in terms of dollars of acute OT or likelihood for patients to receive any acute OT (Pritchard et al., 2019; Roberts et al., 2020; Rogers et al., 2017). However, among CJR hospitals, greater acute OT provision was associated with larger CJR rewards. Among patients receiving acute OT, each additional dollar of acute OT spent by the hospital was associated with a $2 increase in CJR rewards. These results suggest that increasing acute OT may be financially worthwhile for hospitals in the United States, particularly for those engaged in alternative payment models.
Our findings suggest that acute OT service spending was associated with positive returns on investment. These findings are unsurprising, given that OT services are associated with improved care quality measures that are also directly linked to the CJR reward algorithm (Pritchard et al., 2019). Acute OT can also be helpful in improving patient outcomes, decreasing the length of stay, decreasing the likelihood of the patient contracting hospital-acquired conditions, and lowering Medicare spending (CMS, 2015; Pritchard et al., 2019). Compared with other inpatient cost categories, OT may better identify and address discharge barriers and deficiencies in function and self-care that could result in readmissions (Roberts et al., 2020). A reduction in readmissions may be significantly aided by using OT in evaluating these deficiencies within 24 hr of admission, providing patient and caregiver education, educating on prevention and wellness strategies, and suggesting alternative discharge plans as needed (Fisher & Friesema, 2013; Rogers et al., 2017). Despite these potential benefits, the CJR had no detectable effect on the amount of acute OT that patients received, whether measured in dollars or the likelihood of a patient receiving any OT.
The provision of acute OT for joint replacement hospitalizations, regardless of the CJR, was low (<1% of total hospitalization costs), with substantial variations across the United States. One reason for this variation may be the unequal distribution of the OT workforce. According to the U.S. Bureau of Labor Statistics, only 22% of licensed occupational therapists worked in general medical and surgical hospitals in 2022 (U.S. Bureau of Labor Statistics, 2023). There is also significant disparities in the number of occupational therapists employed per state, with higher numbers of therapists concentrated in large metropolitan areas. Thus, access to occupational therapy services may be limited in hospitals that perform joint replacements in many geographical areas.
Another possible reason why hospitals did not increase acute OT services under CJR is that the decreased length of stay for patients with joint replacement after the initiation of the CJR may yield limited opportunities for hospitals to provide acute OT services, especially postsurgery (Lewin Group, 2020). Subsequently, incorporating OT into presurgical education classes may be especially important. Preoperative OT care coordination can prepare patients and caregivers for functional limitations after surgery and address environmental barriers. Preoperative OT may also help early identification of high-risk patients and to preemptively determine any needs for increased acute OT frequency postsurgery (Pritchard et al., 2019). Although our data did not allow us to examine when hospitals rendered OT services, another study found that, in response to the CJR payment model, hospitals reported increased use of preoperative education (Lewin Group, 2020). Three of the eight CJR hospitals interviewed reported incorporating OT into care coordination, discharge planning, and interdisciplinary rounds. The success of incorporating OT led two of the hospitals to extended OT services to all lower extremity joint replacements, including those not covered under CJR (Lewin Group, 2020).
In addition, the amount of acute OT services that patients should receive is unknown, and the lack of observable change in OT provision by hospitals under CJR may be because hospitals are already providing the right amount of OT services. Given that hospitals must allocate finite resources, it is possible that providing more acute OT services means fewer resources for other, potentially even more important, services. Our study focused on the association between dollars spent on acute OT services and CJR rewards. Although we did not examine the return on investment for other hospital services to enable such comparisons, future research should seek to understand the optimal amount of acute OT services for patients and compare the return on investment of acute OT services relative to other services.
This study has limitations. First, although, in our analysis, we leverage a randomized controlled trial to understand the causal effects of the CJR on acute OT service provision, the measures of hospital use of acute OT services are self-reported by hospital staff and may contain errors. These measurement errors may have contributed to our null results regarding CJR’s effects on acute OT service provision. Nonetheless, given that there are no existing better sources of hospital data on acute OT service provision, our study is still valuable, because, to our knowledge, it is the first systematic examination of how hospitals incorporated acute OT under the CJR payment model. Second, our analysis of the association between acute OT service provision and CJR rewards is correlational. Although we controlled for various potential confounders, including patient, hospital, and market characteristics, we cannot rule out the possibility of other unobserved factors. Future studies should develop evidence to better explain the value added by acute OT in the hospital setting for patients with joint replacement.
Implications for Occupational Therapy Practice
Given that acute OT spending accounted for less than 1% of hospital costs across the United States, and that there were no observable effects of CJR on hospital provision of acute OT despite potential positive returns on investment, our study results suggest the following implications for future clinical occupational therapy practice: ▪ Occupational therapy administrators and practitioners should quantify the financial benefits of acute OT provision to hospitals. Given the proliferation of value-based payments, helping hospitals understand the added value of acute OT, especially relative to other services, will be increasingly important. The availability of such evidence can assist practitioners in advocating for the appropriate level of hospital resources to be allocated toward the provision of OT services for older populations. ▪ More evidence is needed to understand why acute OT spending varies across hospitals in the United States and whether the variation in OT spending is justified. Supporting evidence can help rectify any geographical disparity in OT services for joint replacement.
Conclusion
Although, in this study, we found evidence indicative of a positive return on investment for hospitals that incorporate acute OT into patient care, the results do not indicate that hospitals have increased acute OT as part of their improvement strategy under CJR. In fact, acute OT service provision is low and varies substantially across the United States. The low use of acute OT may be due in part to the undervaluing of the benefits of acute OT for patients undergoing joint replacement surgery. More evidence is needed to understand why acute OT spending varies in hospitals across the United States to help rectify the geographical disparity in OT services for joint replacement. In addition, future studies should seek to better document and understand how acute OT can be more effectively incorporated into acute patient care.
Supplemental Material
Supplementary material for Hospitals Did Not Increase Acute Occupational Therapy Provision Despite Positive Associations With Hospital Performance Under Medicare’s Comprehensive Care for Joint Replacement Program
Supplementary material, sj-pdf-1-aot-10.5014_ajot.2025.050736.pdf for Hospitals Did Not Increase Acute Occupational Therapy Provision Despite Positive Associations With Hospital Performance Under Medicare’s Comprehensive Care for Joint Replacement Program by Jun Li, Yvonne Monti and Andrew Ryan in The American Journal of Occupational Therapy
Footnotes
Acknowledgments
This research was supported in part by an American Occupational Therapy Foundation Health Services Research grant to Jun Li. The funders had no role in the design and conduct of the study; the collection, management, analysis, and interpretation of data; the preparation, review, or approval of the manuscript; or the decision to submit the manuscript for publication.
References
Supplementary Material
Please find the following supplemental material available below.
For Open Access articles published under a Creative Commons License, all supplemental material carries the same license as the article it is associated with.
For non-Open Access articles published, all supplemental material carries a non-exclusive license, and permission requests for re-use of supplemental material or any part of supplemental material shall be sent directly to the copyright owner as specified in the copyright notice associated with the article.
