





Abstract
This study found that Vision CoachTMdemonstrates good sensitivity and specificity in assessing visual processing speed reaction time as well as determining who will likely pass or fail a comprehensive driving evaluation and who should be referred for further evaluation.
Driving is one of the most meaningful instrumental activities of daily living (IADLs) for older adults (Dickerson et al., 2013) and the most common form of transportation used to engage in social activities and complete daily routines (Luiu et al., 2017). Unfortunately, increased driving risk has been noted among older adults, especially after the age of 85 yr (Moon et al., 2018). Although age is not directly related with driving risk, as one ages, there is an associated rise of medical conditions that affect driving fitness (Dickerson et al., 2019).
Vision, cognition, and motor skills typically denote the requirements for safe driving (Desapriya et al., 2014). Studies (Carr et al., 2016; Lacherez et al., 2014; Mielenz et al., 2017) have shown that reduced peripheral sensation, lower extremity weakness, slow reaction time, and poor balance are associated with at-risk driving. However, assessing physical abilities is not the best indicator of fitness to drive (Carr et al., 2016; Dickerson et al., 2011), because many physical impairments can be addressed with compensatory techniques or adaptive equipment to enable continued driving (Moon et al., 2018). At the same time, older adults with low vision or field cuts have a higher risk of being involved in a vehicle crash than younger age groups (Cross et al., 2009; Huisingh et al., 2014), although visual field loss and diminished acuity can also be addressed using compensatory options (e.g., adaptive mirrors, specialized devices). In fact, a systematic review concluded there is a lack of quality studies assessing the effects of visual screening on subsequent vehicle crash reduction (Desapriya et al., 2014).
What is clear, however, is that cognitive processes such as working memory and cognitive speed show age-related decline regardless of educational level (Vonk et al., 2020), and considerable variability in age-related decreased processing speed needs to be considered in driving fitness (Svetina, 2016). Tam et al. (2015) found that processing speed was the predictive factor of general cognitive status among older adults, and other studies have identified processing speed as a key factor in driving (Aksan et al., 2015; Anderson et al., 2012; Anstey et al., 2012). Wadley et al. (2021) found that processing speed plays a key role in everyday activities, including driving, for people with mild cognitive impairment. Thus, as people’s processing speed declines, they take longer to make decisions, resulting in increased driving risk because of the highly dynamic driving environment.
With normal aging and the associated decrease in processing speed, older adults tend to self-regulate by not driving at night, on highways, or at rush hour (Aschenbrenner et al., 2022; St Louis et al., 2022). Hotta et al. (2018) found that although normal aging is correlated with increased driving risk, processing speed was more closely correlated with increased driving risk regardless of age. Thus, for assessment of driving risk, particularly for individuals with cognitive impairment, an assessment tool that can be used by occupational therapists to assess processing speed would be useful in identifying who needs further evaluation. Specifically, the comprehensive driving evaluation (CDE) is a useful tool for an occupational therapist driver rehabilitation specialist.
Current assessments to determine driving risk that measure processing speed include the Trail Making Tests A and B (Cullen et al., 2014; Egeto et al., 2019; Papandonatos et al., 2015; Tsiakiri et al., 2024; Vaucher et al., 2014) and the UFOV® assessment to measure useful field of view (Egeto et al., 2019; Eramudugolla et al., 2017). Although multiple studies have shown that these tests are predictive of fitness to drive, none have been precise enough to be used alone, and all have limitations (Aksan et al., 2015; Anderson et al., 2012; Papandonatos et al., 2015), including potential educational bias (Glymour et al., 2012).
Although the on-road assessment remains the gold standard for determining fitness to drive, because of the aging population with increasing numbers of individuals with cognitive impairment, occupational therapists need more predictive assessments tools that can be used in general settings. With evidence-based assessment tools that accurately predict fitness to drive, the need for CDE (including an on-road component) would be decreased. Thus, the aim of this study was to demonstrate the sensitivity and specificity of the Vision CoachTM as an assessment tool that assesses cognitive visuomotor processing speed reaction time for fitness to drive.
Method
Design
We used a predictive validity design to examine Vision Coach reaction times of a control group of healthy young (16–39 yr), middle-age (40–64 yr), and older (≥65 yr) participants versus a medically-at-risk group of participants of corresponding ages. We compared reaction times between the age groups to confirm the established norms of Vision Coach reaction times among the age groups. A logistic regression analysis was used to predict the outcome of a CDE (dependent variable) by using the Vision Coach visual processing speed reaction times (VPSRT; independent variable). East Carolina University’s University and Medical Center Institutional Review Board approved all studies related to collection of data from this assessment tool.
For complete sensitivity and specificity analysis, there can be only two groups: those who “failed” and those who “passed” the comprehensive driving assessment. Although the actual outcomes of a CDE include a pass, fail, or a pass-with-restrictions, for the purpose of this analysis, a pass-with-restrictions was categorized as a failing determination because “drive with restrictions” is not an option in all licensing jurisdictions. Moreover, driving decisions should not only be based on the driver’s ability (i.e., performance skills) but also include their specific driving environments and activity demands (American Occupational Therapy Association, 2020). In our study’s rural setting, restrictions almost always include multiple restrictions (e.g., speed, distance, weather, time frame) and therefore include the message that the driving life span of the driver is ending and a reevaluation will be required within 6 to 12 mo. Hence, for statistical analysis, the pass-with-restrictions determination was included with the failing group.
Participants
The study consisted of two target populations: healthy controls and medically-at-risk drivers. A medically-at-risk driver is defined as “a person, regardless of age, who has a medical condition(s) that may affect driving performance” (Transportation Research Board, 2024, p. 13).
Healthy Controls
The target population for healthy controls were adult drivers in Greenville, North Carolina, with the inclusive criteria of being older than age 18 yr and free of any vision or physical deficits that could impair driving ability. We did convenience recruitment by contacting eligible participants and contacts from previous studies, with snowballing used for additional participants. Consent was obtained by all participants prior to data collection. We offered an incentive of $20 gift card. In addition, we included data from previous studies collected under the same protocols (Penna et al., 2024).
Medically-at-Risk Group
Vision Coach was already an assessment used to determine fitness to drive as part of a larger ongoing study. The medically-at-risk group (N = 147) consisted of previously collected data (Penna et al., 2024) for CDEs of medically-at-risk adults (n = 34) and data collected for this study (n = 113). Although the medically-at-risk drivers included various diagnoses, the driving evaluation program does not use an adapted vehicle (except for a right-side brake), thus eliminating drivers with physical deficits who need hand controls, a left-foot accelerator, wheelchair-accessible vans, or other vehicular adaptations. Consequently, most of the drivers had primary cognitive or physical impairments in which a simple spinning knob could be attached, and all drivers had to be able to use their right leg. By excluding drivers with significant extremity impairments, the motor component of operating the Vision Coach did not influence results.
Instrumentation
The Vision Coach is a large, black, nonglare membrane that is wall-mounted, measuring 50 × 34 inches, that can be adjusted for height. This tool has multiple settings, and most parameters can be adjusted. There are 120 small light dots concealed in the dark overlay that spontaneously appear during the simulation. The Full Field 60 task setting was used, in which 60 dots of light appear in 60 spontaneous locations. The lighted dot only disappears after being touched, so performance time is measured in number of seconds that a participant scans, recognizes, and touches 60 dots of light.
Vision Coach has been tested and found to be a reliable tool for measuring psychomotor function (Xi et al., 2014). Previous studies have established normative data for healthy individuals across adulthood and found no significant differences in performance based on gender, height, or wingspan (i.e., measurement from the tip of hand to tip of the other hand with arms in extension) in the Vision Coach. Specifically, Miller (2017) determined that the participant’s position, such as sitting or standing, did not produce any significant differences, and Xi et al. (2014) established that the learning effect is stabilized after three trials. Register (2016) reported significant changes across age, indicating that the normal aging process affects performance on psychomotor functions. Dickerson et al. (2024) demonstrated that visual processing speed, as assessed by the Vision Coach, can differentiate between healthy community-living adults and medically-at-risk adults independent of the medical condition. Their study also found that Vision Coach was able to differentiate between those medically-at-risk adults who “passed” or “failed” a CDE using the VPSRT. Although there was only a small number (N = 34) of medically-at-risk participants in Dickerson et al.’s study, it provided the critical pilot data to implement the current study.
Procedure
In this study, the CDE was done in two sessions. The first session was a comprehensive IADL evaluation, which typically consists of an interview (e.g., driving history, medical review, medications, IADL review) and evaluation of the vision (e.g., acuity, depth perception, contrast sensitivity, color perception), physical–motor (e.g., functional range of motion and strength, ocular control, gait, sensation, proprioception), and cognitive (e.g., Montreal Cognitive Assessment, Trail Making Tests, Snellgrove Maze, clock drawing) assessments. On the basis of the outcome of this IADL evaluation, participants were scheduled for the second session. The 2nd day includes the Assessment of Motor and Process Skills (Fisher & Bray Jones, 2014), Vision Coach, a driving simulator task specifically for multitasking, and the 45-min on-road assessment. All the medically-at-risk participants in this study completed both days, including the on-road assessment.
Healthy Controls
After instructions, each participant in the healthy control group performed the Vision Coach Full Field 30 task as a practice trial, with an explanation that the goal of the task was to tap each dot as quickly as possible. Participants could ask questions for clarification prior to the research trials. Each participant then performed the Full Field 60 task three times with 30 s of rest between each trial. The three trial times were averaged for each participant.
Medically-at-Risk Drivers
The same instructions and procedures were used with the medically-at-risk drivers as part of a CDE, which included assessments of motor, vision, perception, and cognition, and always included an on-road assessment. For most participants, the same researchers collected both the healthy controls’ and medically-at-risk drivers’ data.
Data Analysis
We performed data analysis using the average of the three trial times for Vision Coach for the healthy controls and the medically-at-risk participants. We used a coefficient of variation to measure the variation from the mean for each participant across the three trials. Results showed a mean of 6% variation, with a minimum of 0% and a maximum of 20% variation of standard deviation to the mean, which supported the use of the average of the three trials as the outcome measure for VPSRT.
The average Vision Coach VPSRT was summarized in mean, standard deviation, and 95% confidence interval (CI). Because of its varying variations across groups, the average Vision Coach reaction time was log-transformed for subsequent analyses of variance (ANOVAs) to stabilize its variance. To establish the Vision Coach reaction time norm for healthy controls, we used a two-way ANOVA with age group (young vs. middle age vs. older), gender (male vs. female), and their interaction term. The interaction term was removed from the model if its p value was over .1. To compare the Vision Coach reaction time between healthy controls and medically-at-risk participants, we used a three-way ANOVA with health condition (healthy control vs. medically-at-risk), age group, gender, and all interaction terms. The interaction terms, as well as main effects, were removed from the model using backward elimination if the p values were >.1. Finally, we used a logistic regression to determine the effect of processing speed on the outcome of an on-road comprehensive driving assessment for all medically-at-risk participants (as one group). The same analysis was repeated separately for medically-at-risk participants who were 16 to 64 yr old and those who were ≥65 yr old. Receiver operating characteristic (ROC) curves were created to determine the area under the curve (AUC) in predicting the probability of passing the comprehensive driving assessment. The ROC curve is a visual measure of how well a binary classification model works, demonstrating varying levels of certainty by plotting sensitivity versus 1-specificity across a multitude of cut points. The AUC is an aggregate quantification of the sensitivity and specificity of the clinical test, the Vision Coach, derived from the ROC curve to identify the validity of the clinical test to predict the outcomes of the comprehensive driving assessment. Optimal cutoffs were suggested, and corresponding Vision Coach reaction times were calculated. Data analyses were performed using SAS (Version 9.4) with significance level set as p < .05.
Results
Of the 419 participants, 272 (64.9%) were healthy controls with an age range of 21 to 87 yr (M = 49.4, SD = 21.9) with 196 (72.1%) women, and 147 (35.1%) were medically-at-risk with an age range of 16 to 90 yr (M = 62.2, SD = 15.7) with 52 (35.4%) women (see Table 1).
Demographic Characteristics of Healthy Controls and Medically-at-Risk Participants (N = 419)
Analysis of Healthy Controls
The Age Group × Gender interaction was not statistically significant, F(2, 266) = 0.34, p = .711, and was removed from the model. Analysis showed significant, F(2, 268) = 250, p < .001, differences in mean reaction times in seconds among the three age groups of the healthy controls (young, M = 44.8, SD = 4.21; middle age, M = 53.4, SD = 7.98; older, M = 64.4, SD = 8.74) with the mean reaction time increasing as age increased (see Table 2). Post hoc tests with Tukey– Kramer adjustment showed all three age groups were significantly (p < .001) different from each other. These results suggest that natural aging causes a decrease in processing speed to a visual stimulus. However, analysis showed no significant gender difference, F(1, 268) = 2.55, p = .111, in mean reaction times of the healthy controls (male, M = 55.6, SD = 12.1; female, M = 53.7, SD = 11.0).
Summary of Mean Vision Coach Reaction Time of Healthy Controls and Two-Way ANOVA by Age Group and Gender
Two-way analysis of variance (ANOVA) on log-transformed average Vision Coach reaction time (R 2 = .65). The Age Group × Gender interaction was not statistically significant (p = .711) and was removed from the model.
Comparison of Healthy Controls and Medically-at-Risk Groups
Because gender main effect and all interaction terms were not statistically significant (p > .302) in a three-way ANOVA, the model reduced to a two-way ANOVA with age group and health condition without interaction. Analysis showed significant, F(2, 415) = 200, p < .001, differences in mean reaction times in seconds among the three age groups (young, M = 45.4, SD = 5.08; middle, M = 60.1, SD = 14.1; older, M = 70.2, SD = 14.5), with the mean reaction time increasing as age increased (see Table 3). Post hoc tests with Tukey–Kramer adjustment showed all three age groups were significantly (p < .001) different from each other. These results suggest that natural aging caused a decrease in VPSRT of both healthy controls and medically-at-risk participants. In addition, analysis showed a significant, F(1, 415) = 110, p < .001, difference in mean reaction times in seconds between the two health conditions (healthy controls, M = 54.2, SD = 11.3; medically at risk, M = 71.0, SD = 18.0), suggesting that having a medical condition that increased driving risk also resulted in significantly slower processing or reaction speed. However, the age effect and the health condition effect did not interact with each other (see Table 4).
Summary of Mean Vision Coach Reaction Time of All Participants (Both Conditions) and Two-Way ANOVA by Age Group and Heath Condition
Two-way analysis of variance (ANOVA) on log-transformed average Vision Coach reaction time (R 2 = .62). Because gender and all interaction terms were not statistically significant (p > .302) in a three-way ANOVA, the model reduced to a two-way ANOVA without interaction.
Logistic Regression Model Predicting Passing the On-Road Assessment for Medically-at-Risk Participants Using the Average Vision Coach Reaction Time
Note. OR = odds ratio; CI = confidence interval; AUC = area under the curve.
Predictability of Driving Fitness Using the Vision Coach
For all medically-at-risk participants the Vision Coach reaction time had a statistically significant negative effect on passing the on-road driving assessment (odds ratio [OR] = 0.859, 95% CI [0.818, 0.903], p < .001), suggesting for every second increase in reaction time, the odds of passing the on-road driving assessment decreased by about 14%. Similar statistically significant negative effects of the Vision Coach reaction time on passing the on-road driving assessment were found for medically-at-risk participant 16 to 64 yr old (OR = 0.835, 95% CI [0.767, 0.908], p < .001) and for those who were ≥65 yr (OR = 0.916, 95% CI [0.857, 0.977], p = .008). The ROC curves for the three populations had AUCs equal to 0.886 (95% CI [0.834, 0.938]), 0.894 (95% CI [0.825, 0.964]), and 0.783 (95% CI [0.663, 0.903]), respectively, suggesting moderate to good prediction power (Mandrekar, 2010; see Figure 1).
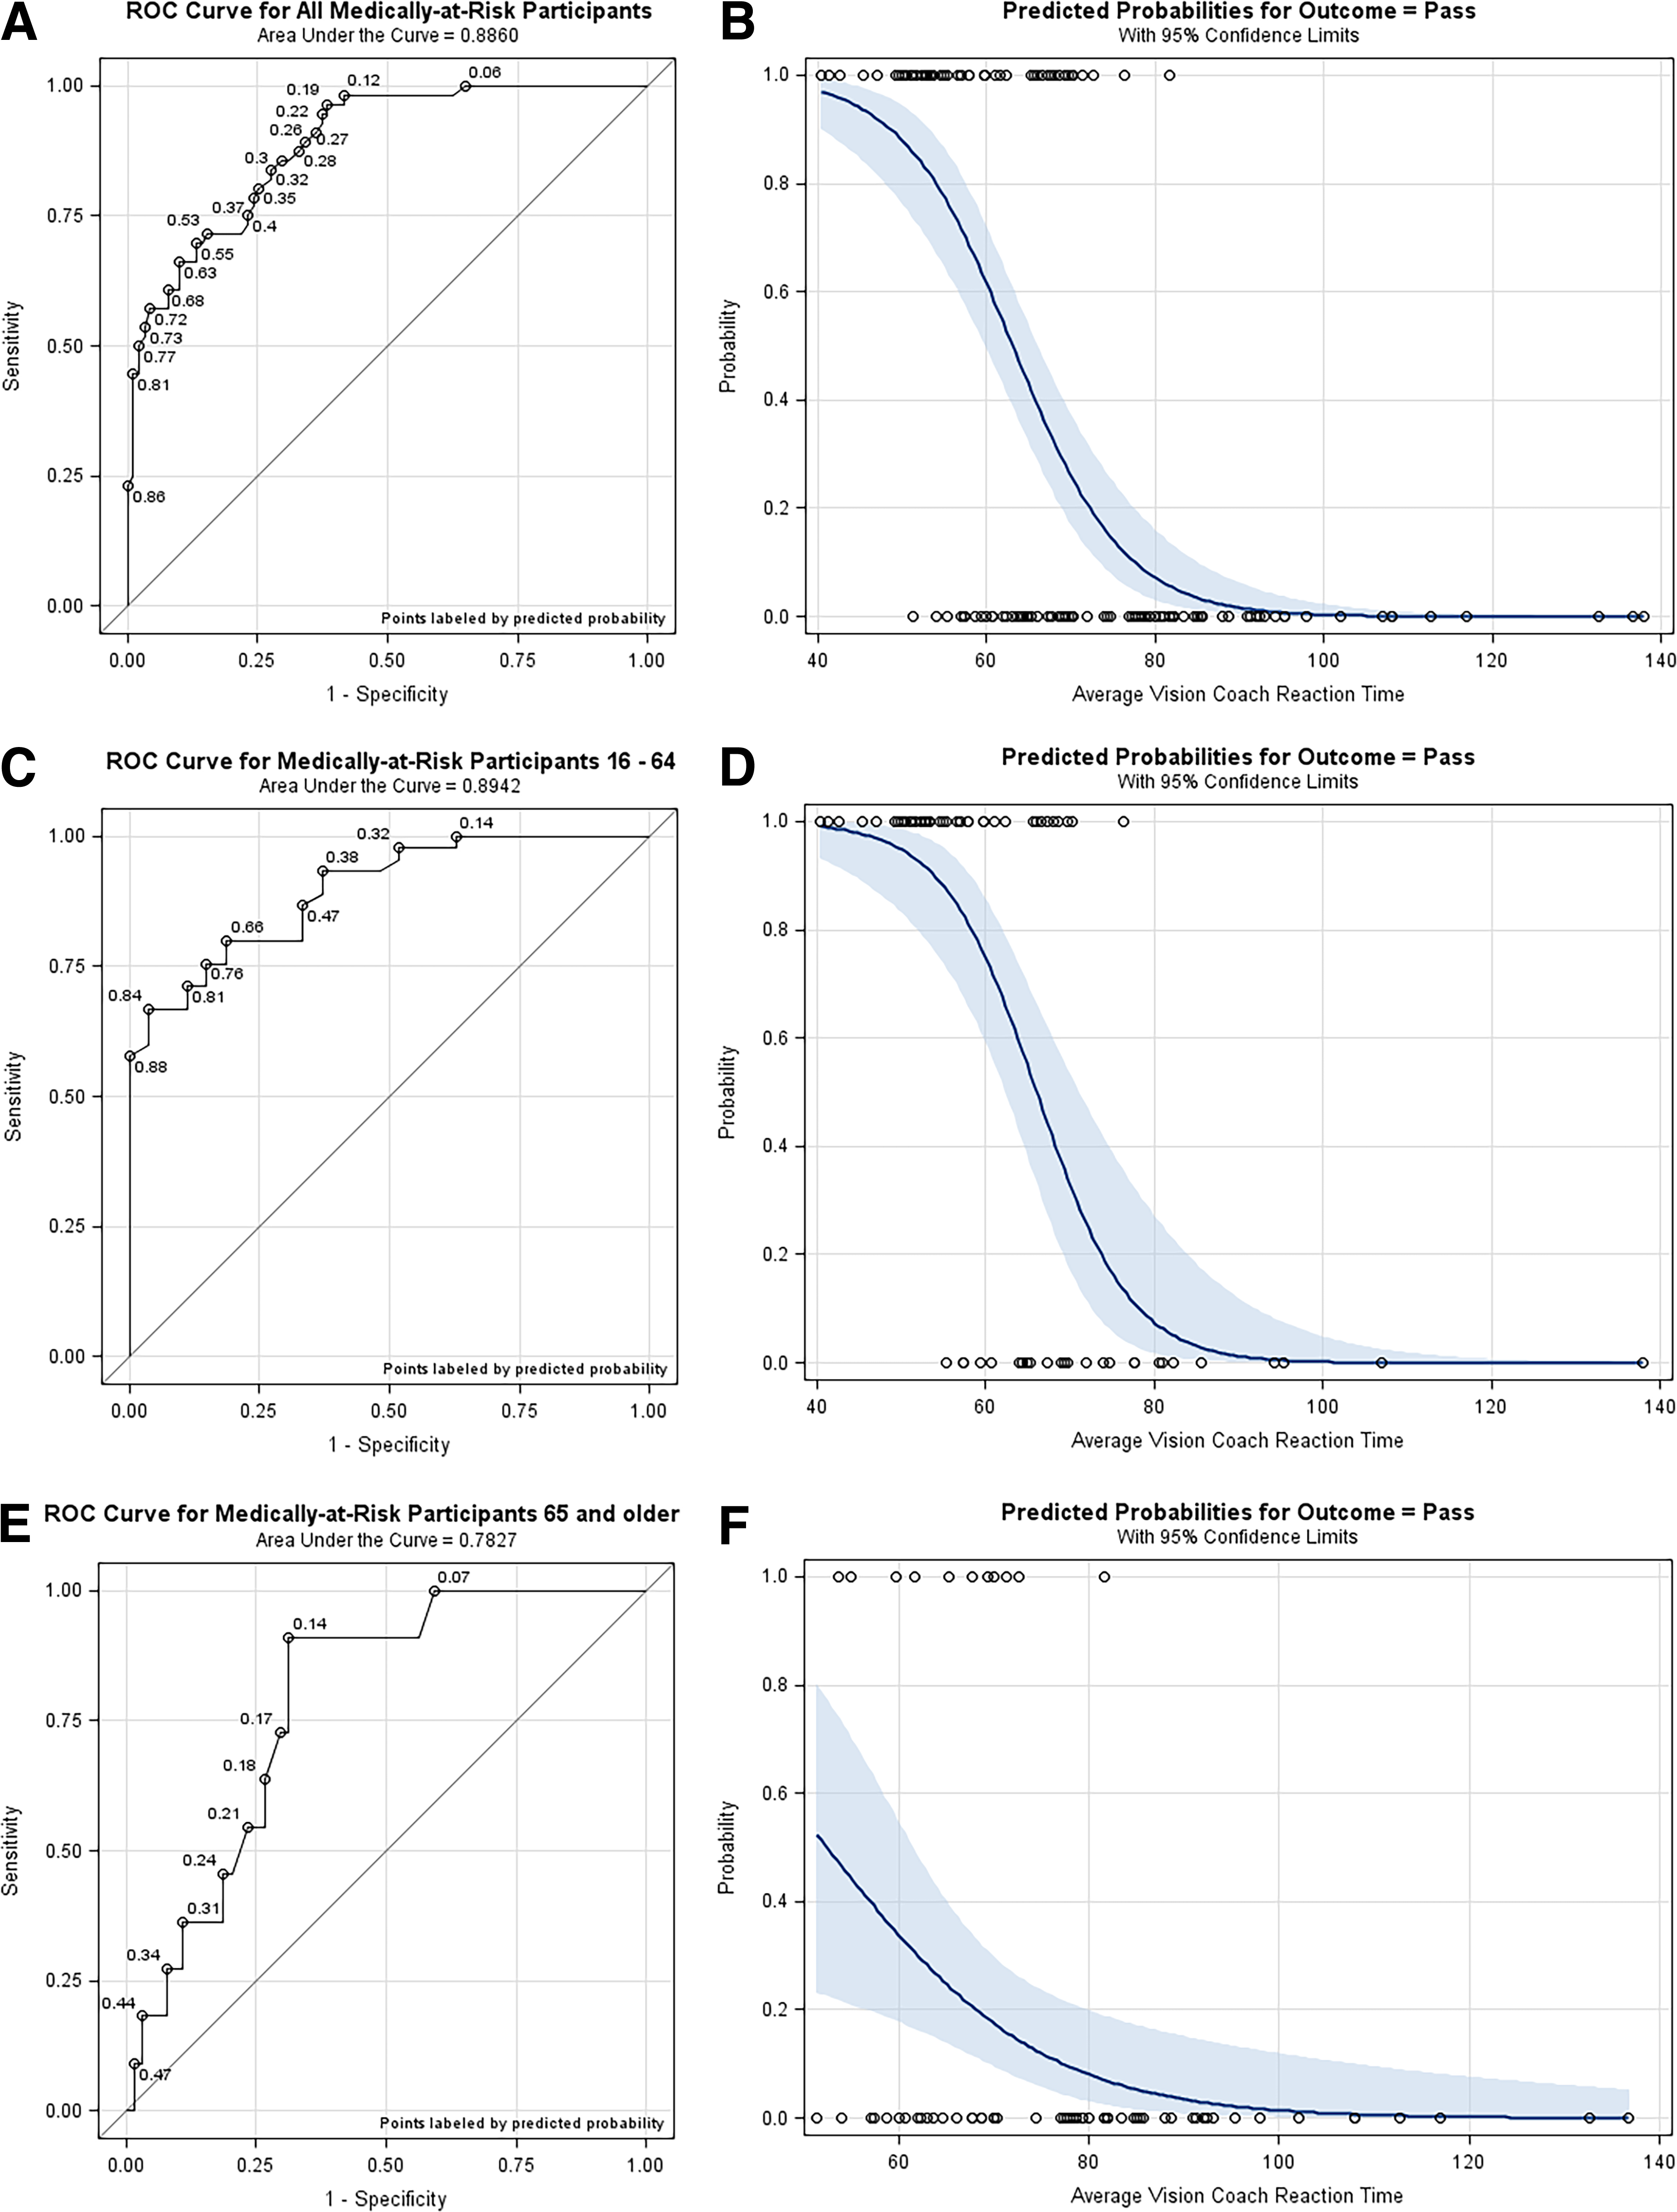
Receiver operating characteristic (ROC) curves and effect plots from logistic regressions.
When considering all ages of the medically-at-risk population, the ROC curve was not very decisive in the optimal cutoff probability for predicting the result of the on-road driving assessment. Cutoff probabilities between 0.12 and 0.72 seemed to work equally well because they were equally apart from the diagonal line. Which cutoff to use represents a trade-off between the sensitivity and specificity of the test. For example, if the probability 0.12 was used as the cutoff, the sensitivity would be 0.98 and the specificity would be 0.58, whereas if the probability 0.72 was used as the cutoff, the sensitivity would be 0.57 and the specificity would be 0.96. If 38% of the medically-at-risk population actually pass the on-road driving assessment as the data suggested, the positive predictive value (PPV) and negative predictive value (NPV) of the test would be 0.59 and 0.98, respectively, if the cutoff probability 0.12 was used. If the cutoff probability 0.72 was used instead, the PPV and NPV would be 0.89 and 0.78, respectively. According to the effect plot of the model, however, the probability 0.12 translates to 76.2 s in reaction time, and the probability 0.72 translates to 56.9 s in reaction time. These results suggest that if we predict that a medically-at-risk participant would pass the on-road driving assessment (a positive) when their Vision Coach reaction time is below 56.9 s, we will be right 89% (PPV) of the time. Similarly, if we predict that a medically-at-risk participant would fail the on-road driving assessment (a negative) when their Vision Coach reaction time is above 76.2 s, we will be right 98% (NPV) of the time. For a medically-at-risk participant with a Vision Coach reaction time between 56.9 and 76.2 s, we suggest referring the participant to take the actual on-road driving assessment to determine their suitability for driving.
For the medically-at-risk population 16 to 64 yr old, the ROC curve suggested cutoff probabilities between 0.38 (PPV = 0.81, NPV = 0.85) and 0.84 (PPV = 0.97, NPV = 0.63). The corresponding effect plot shows that the probability 0.38 translates to 68.8 s in reaction time and the probability 0.84 translates to 56.9 s in reaction time. Thus, we would predict a pass of the on-road driving assessment if a participant’s VPSRT is below 56.9 s, predict a failure of the on-road driving assessment if their VPSRT is above 68.8 s, and refer the participant to take an on-road driving assessment otherwise.
Lastly, for the medically-at-risk population ≥65 yr, the ROC curve suggested a cutoff probability of 0.14 (PPV = 0.33, NPV = 0.98), which translates to 72.9 s in reaction time. In this case, we would predict a failure of the on-road driving assessment if a participant’s Vision Coach reaction time is above 72.9 s and always refer the participant to take the on-road driving assessment otherwise.
Discussion
This study investigated the functionality of the Vision Coach as an accurate assessment tool for predicting fitness to drive. This included analyzing the Vision Coach VPSRT between healthy adults and medically-at-risk adults across age groups, building upon previous research (Dickerson et al., 2024). This study reaffirmed there were no gender differences in visuomotor processing speed reaction time. We also found that age had an inverse relationship with processing speed; namely, as age increased, processing speed decreased. We expanded on those results by collecting significantly more data points and confirmed that age had a statistically significant impact on VPSRT. For the healthy controls, the mean speed was 44.8 s for young adults versus 53.4 s for middle-age adults and 64.4 s for older adults. The fact that confidence intervals for each age group did not overlap demonstrate how the three age groups were significantly different in their VPSRT. Thus, we can conclude that natural aging causes a decrease in processing speed to a visual stimulus and that slowing starts in middle age. These findings support the early work of Salthouse’s (1996) processing speed theory as an important part of age-related cognitive decline.
Medically-at-Risk Drivers
This study provides critical evidence for the use of VPSRT using Vision Coach as an evidence-based tool for predicting fitness to drive for medically-at-risk adults, supporting the earlier pilot study (Penna et al., 2024). Our findings clearly demonstrate that there was an age effect on VPSRT for the healthy controls and the medically-at-risk participants. In addition, both increased age and the presence of a medical diagnosis contributed to slower visual processing speeds, but they acted independently of each other. Moreover, a medical diagnosis at any age can produced slower VPSRT, so a young adult diagnosed with a medical condition could demonstrate slowed VPSRT regardless of age. This also means that an older adult with no medical conditions will demonstrate slowed visual processing speed, but not necessarily putting them at risk for driving. However, an older adult with a medical condition may be particularly at risk for slowed processing speed and are more likely to be at risk.
Predictability of Driving Fitness
Perhaps the most important result of this study was the ability to quantify the predictability of the Vision Coach in determining fitness to drive for medically-at-risk drivers. In other words, the Vision Coach is a valid predictor of whether someone will pass or fail a CDE. For the medically-at-risk population of any age, drivers with Vision Coach VPSRT below 56.9 s are predicted to pass the on-road assessment with 89% accuracy. Similarly, drivers with scores above 76.2 s are predicted to fail an on-road assessment with 98% accuracy. The gray area between Vision Coach speeds of 56.9 s and 76.2 s should be referred for further evaluation. For the medically-at-risk population of 16 to 64 yr old, the cutoff for the passing score remains at 56.9 s or below. However, the prediction of failing the on-road assessment for this age group is 68.8 s or above, with those in the gray area needing further evaluation. Finally, for a medically-at-risk driver over 65 yr of age, it is very likely the driver will fail the on-road driving assessment if their Vision Coach reaction time is above 72.9 s. Those with scores below should be considered for further evaluation, including the on-road assessment.
Current research shows that there is no single test appropriate for determining fitness to drive (Dickerson et al., 2014). However, VPSRT has been shown to be a significant indicator of variance in ability to practice safe driving (Anstey et al., 2012). Our findings here also support previous studies that found that processing speed was more closely related to driving risk regardless of age (Hotta et al., 2018) and the likelihood of individuals being involved in a motor vehicle crash was increased among those with decreased visual processing speed (Elgin et al., 2010). Thus, using this assessment tool adds an important criterion that will separate those who are fit from those who are unfit to drive. In more recent work, Wadley et al. (2021) demonstrated that processing speed is strongly and closely correlated with the ability to perform instrumental tasks of daily living, including driving, for those with cognitive impairment. This means that processing speed should be an integral factor for determining fitness to drive because driving is considered one of the most complex of IADLs.
Implications for Occupational Therapy Practice
Occupation-based assessments and tools are currently examining driving skills such as motor coordination and visual acuity, but other than the UFOV Subtest 2, visual processing speed is not routinely being measured in driving evaluations (Dickerson, 2013). The UFOV has been hailed as a good screening tool for visual processing speed (Ball et al., 2006; Clay et al., 2005; Edwards et al., 2006). Individuals who performed poorly on UFOV Subtest 2, a test for evaluating visual processing speed, were found more likely to fail the CDE (Classen et al., 2013, 2019). Supporting VPSRT as an indicator for determining fitness to drive, this result suggests the Vision Coach is an appropriate and valid screening tool to measure these differences in VPSRT and may be similar to results of the UFOV Subtest 2 (Ball et al., 2006; Clay et al., 2005; Edwards et al., 2006). Future research comparing these two tools is needed. However, because the Vision Coach has been demonstrated as a valid and useful tool for measuring VPSRTs, it can be used by occupational therapists to determine when a CDE is necessary. Moreover, older adults’ reaction to being tested on the UFOV is typically negative and frustrating, with even healthy controls unsure about the quality of their skills, duplicating experiences of older adults in previous research (Myers et al., 2008). Conversely on the Vision Coach, taking approximately 5 min or three trials of 60 s to 80 s, driving participants, regardless of age, generally find the activity interesting and clearly understand the relationship of the scanning task to scanning the environment of driving.
CDEs typically assess physical abilities such as range of motion, coordination, strength, and postural control, as well as cognition, vision, and attention, which are all necessary for driving (Carr et al., 2011; Dickerson, 2013; Dickerson & Niewoehner, 2012). These evaluations are time consuming and costly for practitioners and patients in a clinical setting as well as an on-road component. Using the Vision Coach as a component of the clinical testing for fitness to drive, general practitioners can use the norms to determine when someone would be a good candidate for a CDE. More important, not only can the Vision Coach be used as a tool to assess VPSRT, but it can also be used as an intervention tool to potentially improve visual scanning as well as processing speed (Gartz et al., 2021). With its various settings to specify the field-of-view size and location, it might be used to address multiple client performance deficits such as neglect or inattention.
Limitations
This study had several limitations. The medically-at-risk adults were engaged in this research as part of a larger CDE, and the healthy controls were just participating in the Vision Coach practice trial and three research trials. Thus, there may have been a limitation of fatigue for the medically-at-risk group, because the Vision Coach portion of the evaluation was completed within other assessments. To account for this potential for fatigue, breaks up to 1 min were allowed between trials. In addition, the same protocols were followed for each group, and the medically-at-risk participants were likely to be more motivated to do well. It is interesting to note that most individuals, after completing the first trial, found themselves competing against their prior score and tended to express interest in outcomes.
An additional limitation to consider was the placement of the random dots on the Full Field 60 task. Because the dots appeared randomly, reaction speed may seem faster on some trials because of convenience of location. There could also have been a learning effect, because each participant performed one practice trial and three additional research trials. These possible changes in VPSRT were accounted for by averaging the three trial times together for the final outcome measure. Averaging the times together could also be a limitation if variation between each of the trial times was vastly different. To determine whether this was the case, we performed a coefficient of variation for each participant’s three trial times. The average variance was 6%, so this was marginal, and therefore averaging the three trial times should not have affected data analysis or the results.
Another potential limitation may be the variation in the size of the groups, because the healthy control group was gathered by convenience sampling and therefore was larger than the medically-at-risk group. Because the study was assessing VPSRT, which is a discrete skill, it is unlikely that the population of healthy controls or medically-at-risk participants would vary greatly from those of the general population.
Finally, because the evaluation site did not have a modified motor vehicle for evaluating drivers with significant physical impairment who would need adaptive equipment, our VPSRT scores may not reflect the scores of individuals with slowed speeds that are solely due to physical impairment rather than processing speed. Nevertheless, with medical conditions that are primarily physical in nature, a CDE is recommended regardless because of the need for specialized equipment.
Conclusion
The purpose of this study was to confirm differences in VPSRT between age groups as well as differences between healthy adults and medically-at-risk adults using a significantly larger sample size. The results demonstrate that VPSRT is slower as age increases. The results also show that, regardless of age, being medically at risk significantly affects how quickly an individual can respond or react to a visual stimulus. This study also demonstrates that the Vision Coach can assess VPSRT and use this to accurately predict whether an individual will pass or fail a CDE 90% of the time. This makes the Vision Coach a valid and appropriate tool for occupational therapists to assess whether clients may need further testing with a CDE, and it can serve as an efficient and effective tool for occupational therapy practitioners to assess fitness to drive.
Footnotes
Acknowledgments
Meagan Denny Irick and Alec DuCharme were master’s-level occupational therapy students who each completed a research thesis and collected most of the data for this study (Irick) and another driving assessment study (DuCharme). Both received funding support to complete their thesis from the College of Allied Health Sciences, East Carolina University.