
Abstract
Importance:
Little is known about compensatory scanning by drivers with homonymous visual field loss (HVFL) in daily driving.
Objective:
To use naturalistic driving methods to investigate the feasibility of quantifying head scanning behaviors of HVFL drivers in daily driving.
Design:
Cross-sectional pilot study with video and GPS data collected from dashboard cameras installed in participants’ personal vehicles between October 2023 and June 2024.
Setting:
Intersections with left-turn maneuvers in daily driving.
Participants:
Two drivers with HVFL (ages 52 and 63 yr) and two with normal vision (NV; ages 47 and 62 yr), all male, recruited from study site databases.
Outcomes and Measures:
Head scanning behaviors were quantified from driver-facing videos, including the number and magnitude of leftward and rightward scans. Road-facing videos were manually annotated for environmental features associated with situations in which no leftward scan was made.
Results:
HVFL drivers exhibited greater leftward than rightward scan magnitude (∼20° difference), whereas NV drivers showed minimal difference (∼3°). Cross-traffic from the left increased left scan frequency for HVFL drivers but not NV drivers. HVFL drivers never failed to scan to the left at stop-sign intersections, although NV drivers sometimes did, but they did fail to scan left at some traffic light and no-sign intersections.
Conclusions and Relevance:
These results demonstrate the feasibility of using naturalistic driving methods to quantify compensatory scanning as well as failures to scan in daily driving of individuals with HVFL. The methods have potential for application in larger-scale research studies as well as in clinical driving rehabilitation.
Plain-Language Summary
Drivers with homonymous visual field loss (HVFL), the loss of half the visual field in both eyes, need to make large head scans (head turns) to see hazards approaching on the nonseeing side. However, little is known about how drivers with HVFL scan in daily driving because most prior studies have been conducted in a driving simulator or during a road test in an unfamiliar vehicle. We used an in-car camera in each participant’s own vehicle to record head scanning before left turns at intersections. Drivers with HVFL made larger and more frequent head scans toward their nonseeing side than drivers with normal vision, suggesting compensatory scanning by HVFL drivers; however, both groups sometimes failed to scan in low-demand situations (e.g., when no traffic was present). These findings suggest that our methods can be successfully used to investigate scanning behaviors in daily driving and are feasible for implementation in a study with more participants.
This study used naturalistic driving methods to investigate the feasibility of quantifying the head scanning (head turning) behaviors of drivers with homonymous visual field loss in daily driving.
Homonymous visual field loss (HVFL) is the loss of vision on the same side in both eyes as a result of lesions in the postchiasmal visual pathways. The most common causes are stroke, traumatic brain injury, and tumors (Zhang et al., 2006). Despite the reduced visual field, individuals with HVFL are permitted to drive in some states in the United States if they meet the minimum visual field extent requirement for licensure (Bowers, 2016). In addition, individuals with HVFL may be allowed to drive in certain other countries that offer exceptional-case provisions (e.g., Belgium, the Netherlands, and the United Kingdom) if they pass a practical-fitness-to-drive test (Bowers, 2016; Harper et al., 2022). However, even when a person with HVFL is rated as safe after a road test and is permitted to drive, little is known about how well they compensate for their vision loss during daily driving. Naturalistic driving offers an approach to address this knowledge gap. With the help of a dashboard camera (hereafter dashcam) mounted in the participant’s own vehicle, naturalistic driving methods enable the unobtrusive recording of habitual driving behaviors in real-world environments for extended periods (Owsley et al., 2015; van Schagen & Sagberg, 2012) without confounds caused by the presence of a driving examiner or the use of an unfamiliar vehicle (Lundberg & Hakamies-Blomqvist, 2003). Moreover, naturalistic driving can provide safety-relevant insights into driving behaviors that may not be observed in the controlled situations of simulated driving or a road test.
Scanning (looking) to the side of the field loss (the blind side) is an important aspect of compensating for HVFL when driving. To date, evidence related to compensatory scanning by drivers with HVFL, such as making more scans to the blind side than the seeing side, has come from studies that have used driving simulators (Bowers, 2016; Bowers et al., 2014; Xu et al., 2022) and road tests (Wood et al., 2011). No research has yet addressed scanning behaviors in daily driving. In this Brief Report, we start to address this important knowledge gap by reporting on our evaluation of the feasibility of using naturalistic driving methods to quantify head scanning on approach to intersections where a wide field needs to be scanned. This is a challenging situation for drivers with HVFL. To check for hazards that are approaching along a cross-street on the blind side, drivers with HVFL need to make a large lateral head rotation (scan) to that side to bring all of the cross-street within a seeing area of their visual field. Prior studies in driving simulators provide evidence that failure to scan adequately at intersections (i.e., failing to execute a head scan, or failing to scan far enough) results in blind-side hazards being missed (Bowers et al., 2014, 2015; Swan et al., 2021).
In this report, we focus on the use of naturalistic driving methods to quantify head scanning by two drivers with left HVFL on approach to intersections before a left-turn maneuver (when driving on the right side of the road, as in the United States). We investigated the extent of compensatory head scanning; rates of failing to scan to the blind side at intersections with different signage; and factors that might affect scanning behaviors, including cross-traffic from the left side and environmental conditions.
Method
Participants and Setting
Participants included two current male drivers with HVFL, one with left homonymous quadrantanopia (LHQ) and the other with a left homonymous scotoma (LHS; Figure 1, Panel A), each of whom drove >180 km/wk (Table 1), and two male drivers of a comparable age with normal vision (NV) from similar geographic locations to provide comparison data. Neither of the drivers with HVFL reported any driving accidents or incidents after they had resumed driving after the onset of HVFL. Participants were recruited from a database of individuals who had previously taken part in research studies at the study site, as well as through an online recruitment portal hosted by the study site’s institution. All participants provided written informed consent prior to taking part in the study, and all met the eligibility criteria: age ≥18 yr, possession of a valid driver’s license, and a minimum of 2 yr of driving experience. No participant reported physical impairments that would affect vehicle operation, and no cognitive impairment was identified with the Montreal Cognitive Assessment; scores ranged from 26 to 29 (Nasreddine et al., 2005).
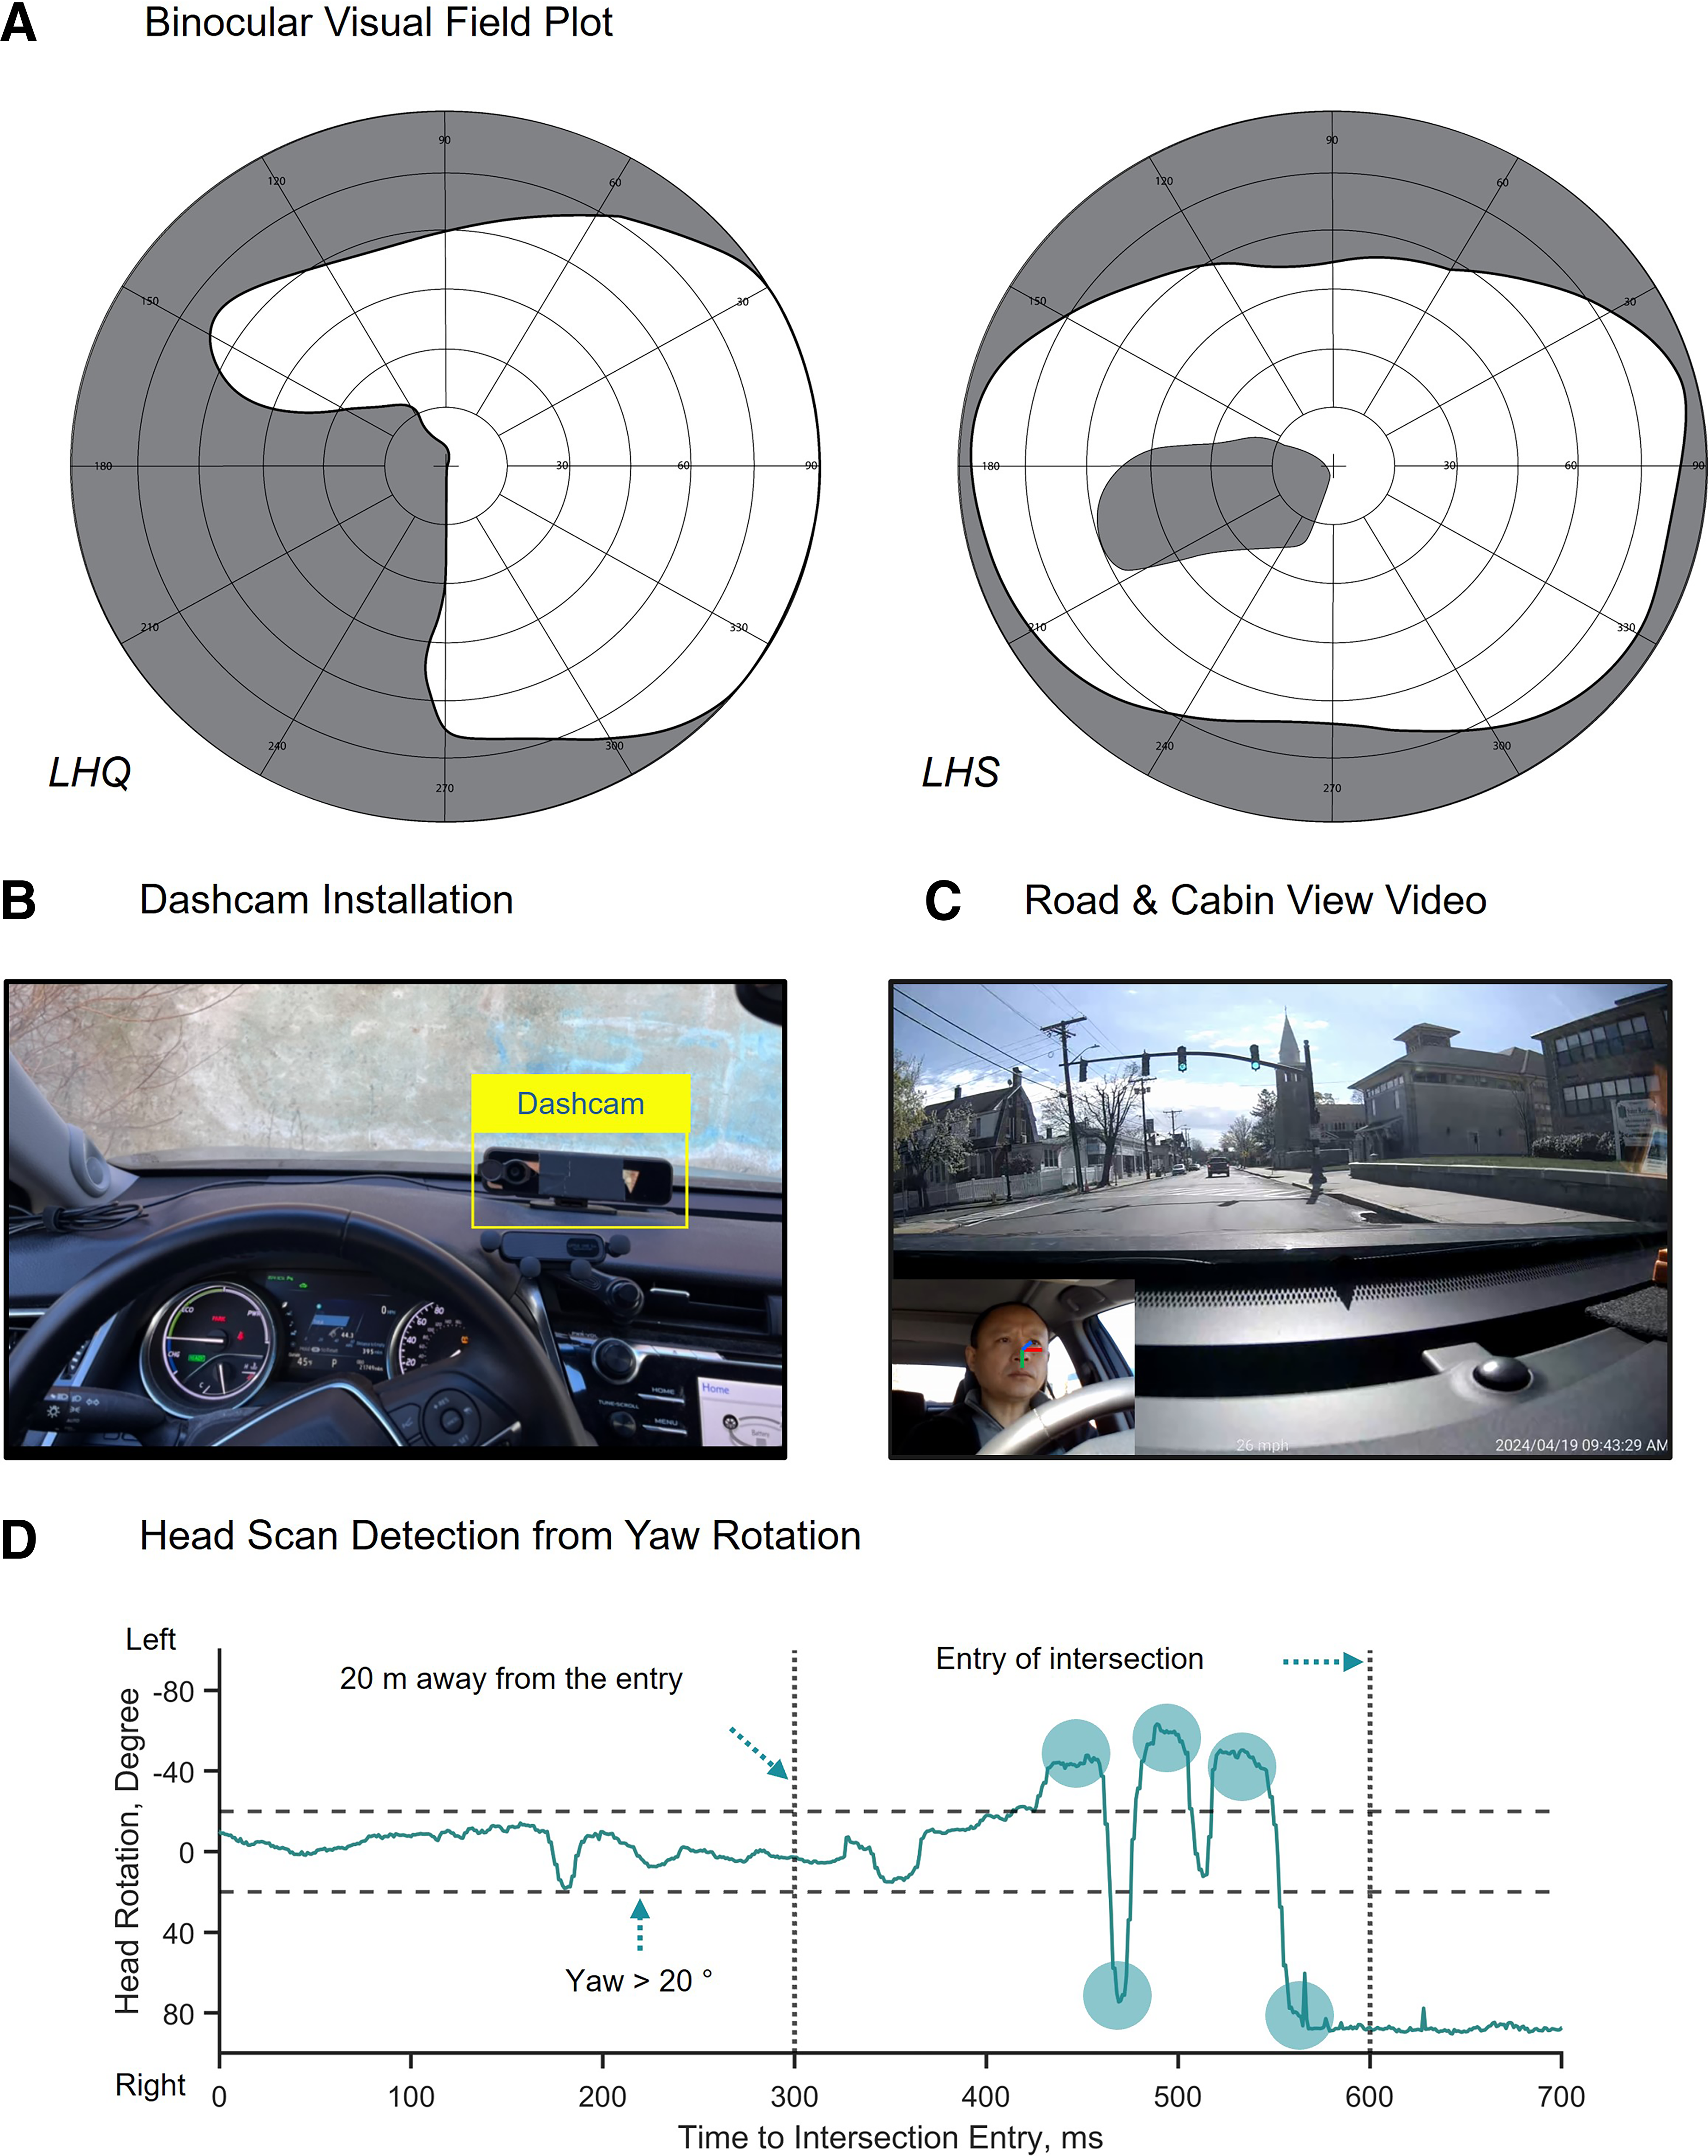
Visual field characteristics of drivers with homonymous visual field loss and overview of head scan measurement in naturalistic driving.
Summary of Participants’ Demographic and Driving Characteristics
Note. LHQ = left homonymous quadrantanopia; LHS = left homonymous scotoma; logMAR = logarithm of the Minimum Angle of Resolution (0.00 logMAR = 20/20 Snellen visual acuity); M = male; NA = not applicable; NV = normal vision.
Daily driving was recorded using a Zubie (Bloomington, MN) dashcam installed in each driver’s own vehicle. The road-facing camera recorded the scene through the front windshield, and the cabin camera captured the driver’s head (Figure 1, Panels B and C). Analyses focused on T and four-way intersections with a stop sign, traffic light, or no control device, driven through at least 20 times to ensure sufficient data (Table 1). Vehicle speed, GPS data, and the processing of road-facing videos enabled identification of intersections and annotation of their configurations, traffic control devices, and driving maneuvers (Pundlik et al., 2025).
Outcome Measures
For each intersection, video clips were extracted from approximately 100 m before to 100 m after the intersection. Road camera footage was manually reviewed to determine the time of intersection entry and characterize the traffic environment, including cross-traffic volume from the left (the side of the visual field loss), and adverse environmental conditions. Each clipped video was typically <1 min in duration, and manual review required approximately 2 min/clip.
Cabin footage was processed using a deep learning–based model to compute head yaw (horizontal rotation; Pundlik et al., 2025). A scan was defined as a yaw rotation >20° from the driver’s straight-ahead direction for at least 167.7 ms (Figure 1, Panel D). Because the majority (>80%) of head scans occurred within 20 m of the intersection, we analyzed head-scanning behaviors from 20 m before the intersection to the point of entry, including (1) the leftward scan proportion, (2) the scan presence rate (≥1 scan), (3) scan frequency (number of scans per intersection), and (4) average scan magnitudes. Whenever there was no scan toward the left side (the blind side for the HVFL participants), intersection videos were manually reviewed to characterize the situation.
Data Analysis
For within-subject paired comparisons, we used χ2 tests to compare leftward and rightward scan presence rates and Wilcoxon signed-rank tests to compare other leftward and rightward scan metrics. For between-group comparisons (HVFL vs. NV), we used Mann–Whitney U tests to compare scan presence rates between drivers. We further analyzed scan metrics across repeated intersection visits using Scheirer–Ray–Hare tests to examine the effect of left-side cross-traffic (presence vs. absence) across scan directions and its differential effects by vision condition (HVFL vs. NV). Statistical significance was set at p < .05.
Results
Naturalistic Driving Context
Across the four drivers, 65% of the analyzed intersections were located in rural areas, with the remainder in urban areas. Of these intersections, 42% were signalized intersections with traffic lights, 31% were stop-sign–controlled intersections, and 27% had no traffic control device. Approximately 34% of intersections had other traffic (66% had no traffic); 28% occurred during nighttime driving, 6% involved wet road conditions (rain or snow), and 27% involved following a lead vehicle.
Scanning Behaviors Before Left Turns
Scanning behaviors before making a left turn are summarized in Figure 2. For all participants, a greater proportion of scans were to the left than to the right. The driver with LHQ had the highest leftward scan proportion, significantly higher than that of the driver with LHS and the two NV drivers (p = .001). For the HVFL drivers, the leftward scan presence rate was higher than the rightward scan presence rate by approximately 30%, and they made significantly more leftward than rightward scans (LHQ, Mdn = 4 vs. 1 per intersection, p < .001; LHS, Mdn = 1 vs. 0, p < .001). For the NV drivers, the leftward scan presence rate was also higher than rightward scan presence rate by approximately 25%, and they made more leftward than rightward scans (NV1, Mdn = 3 vs. 2 per intersection, p = .008; NV2, Mdn = 1 vs. 1, p = .010).
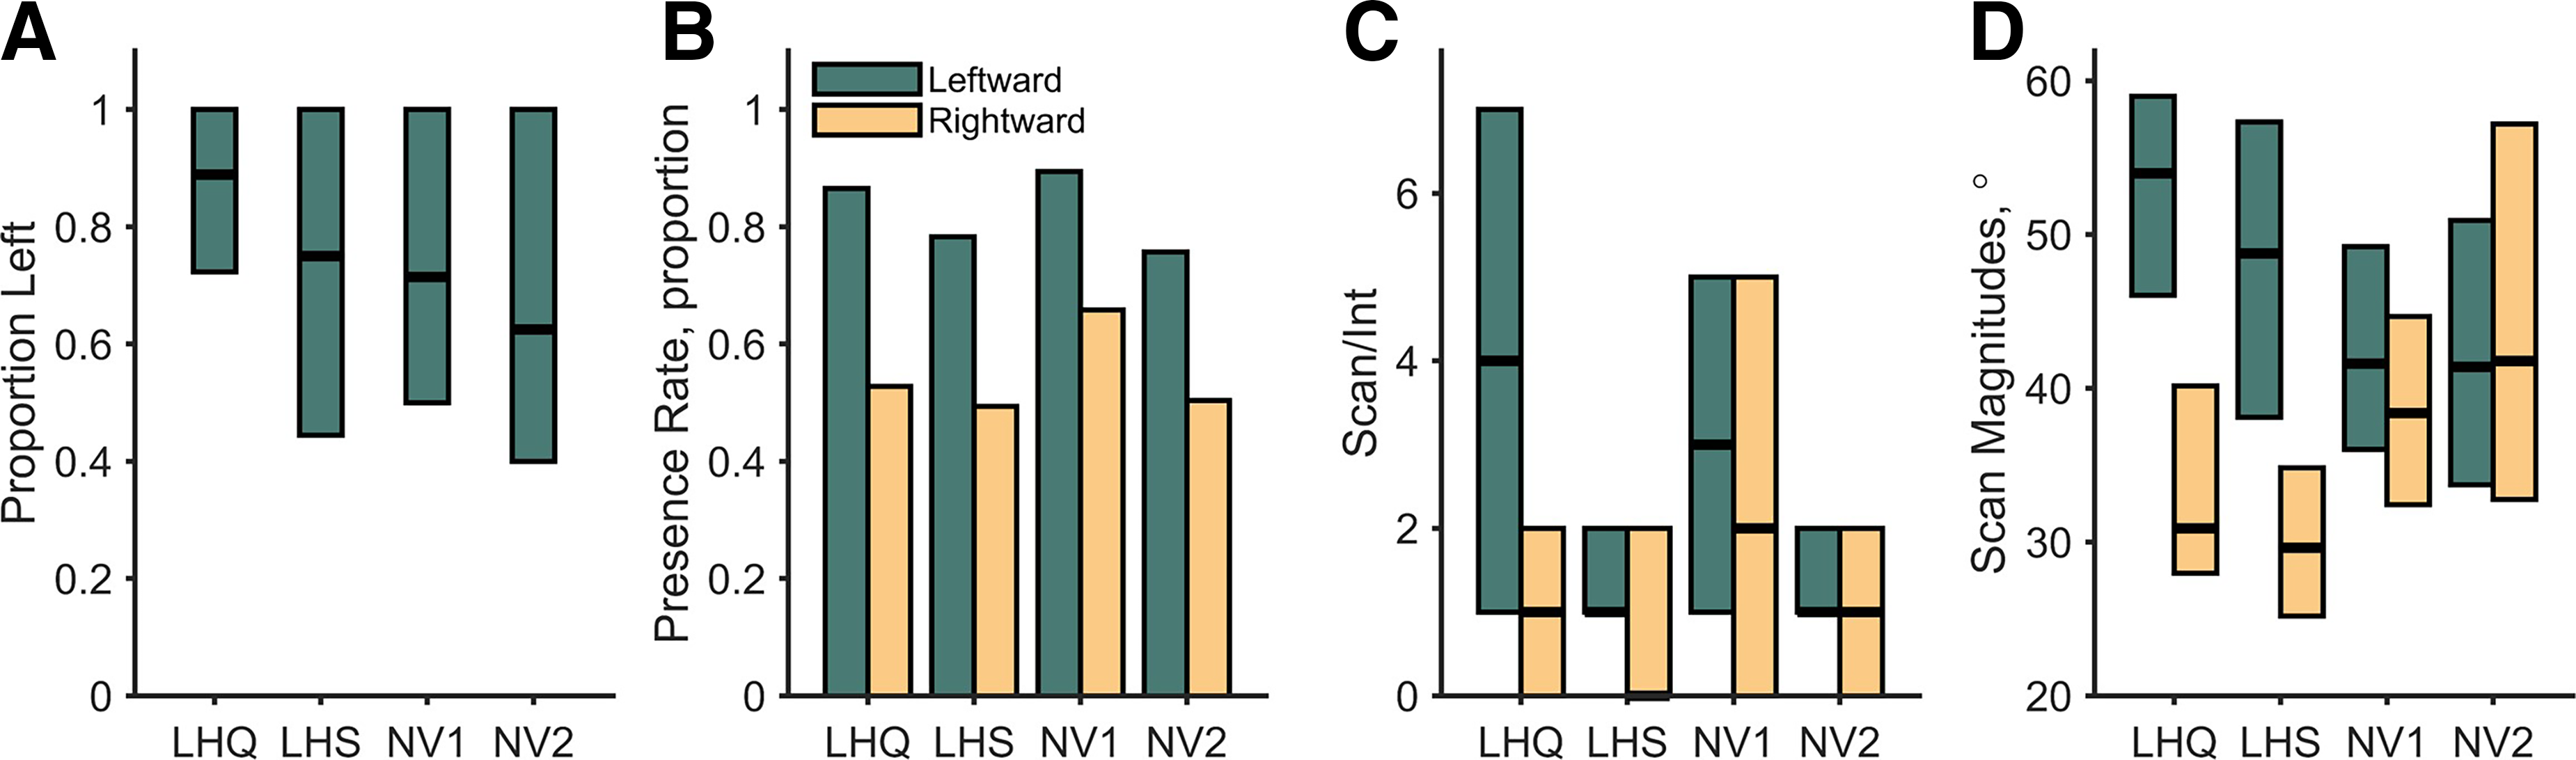
Head scanning behaviors of two participants with left homonymous visual field loss (LHQ and LHS) and two participants with normal vision (NV1 and NV2) before a left-turn maneuver.
For scan magnitudes, the drivers with left HVFL made substantially larger leftward than rightward scans (LHQ, Mdn = 54.0° vs. 31.0°, p < .001; LHS, Mdn = 48.8° vs. 29.6°, p < .001). In contrast, the NV drivers exhibited much smaller differences in left and rightward scan magnitudes (NV1, Mdn = 41.6° vs. 38.4°, p = .014; NV2, Mdn = 41.4° vs. 41.8°, p = .960). A comparison of the HVFL and NV drivers indicated that the former made significantly larger leftward scans than the latter (Mdn = 49.3° vs. 42.6°, p < .001) but made significantly smaller rightward scans (Mdn = 32.3° vs. 38.3°, p < .001).
Effects of Left-Side Traffic on Scanning Behaviors Before Left Turns at Stop-Sign Intersections
To assess the effects of cross-traffic approaching from the left, blind side of the HVFL drivers, we focused on intersections controlled by a stop sign, where drivers should always stop and look for hazards before entering the intersection. For both HVFL drivers (Figure 3, Panels A and B), leftward scan frequency increased with left cross-traffic (LHQ, Mdn = 7 vs. 3 scans per intersection, p = .021; LHS, Mdn = 1 vs.1, p = .007), and rightward scan frequency increased only for the driver with LHS (Mdn = 1 vs. 0; p = .001). In contrast, for the NV drivers (Figure 3, Panels C and D), left cross-traffic did not significantly affect either leftward or rightward scan frequency (all ps >.3). With respect to scan magnitude, the driver with LHQ and Driver NV1 showed no changes with cross-traffic. However, the driver with LHS made significantly larger leftward scans with cross-traffic (Mdn = 60.4° vs. 52.5°, p < .001), while the rightward scan magnitude remained unchanged. Conversely, Driver NV2 made significantly smaller leftward scans with cross-traffic (Mdn = 41.4° vs. 50.4°, p = .035), with no change in rightward scan magnitude.
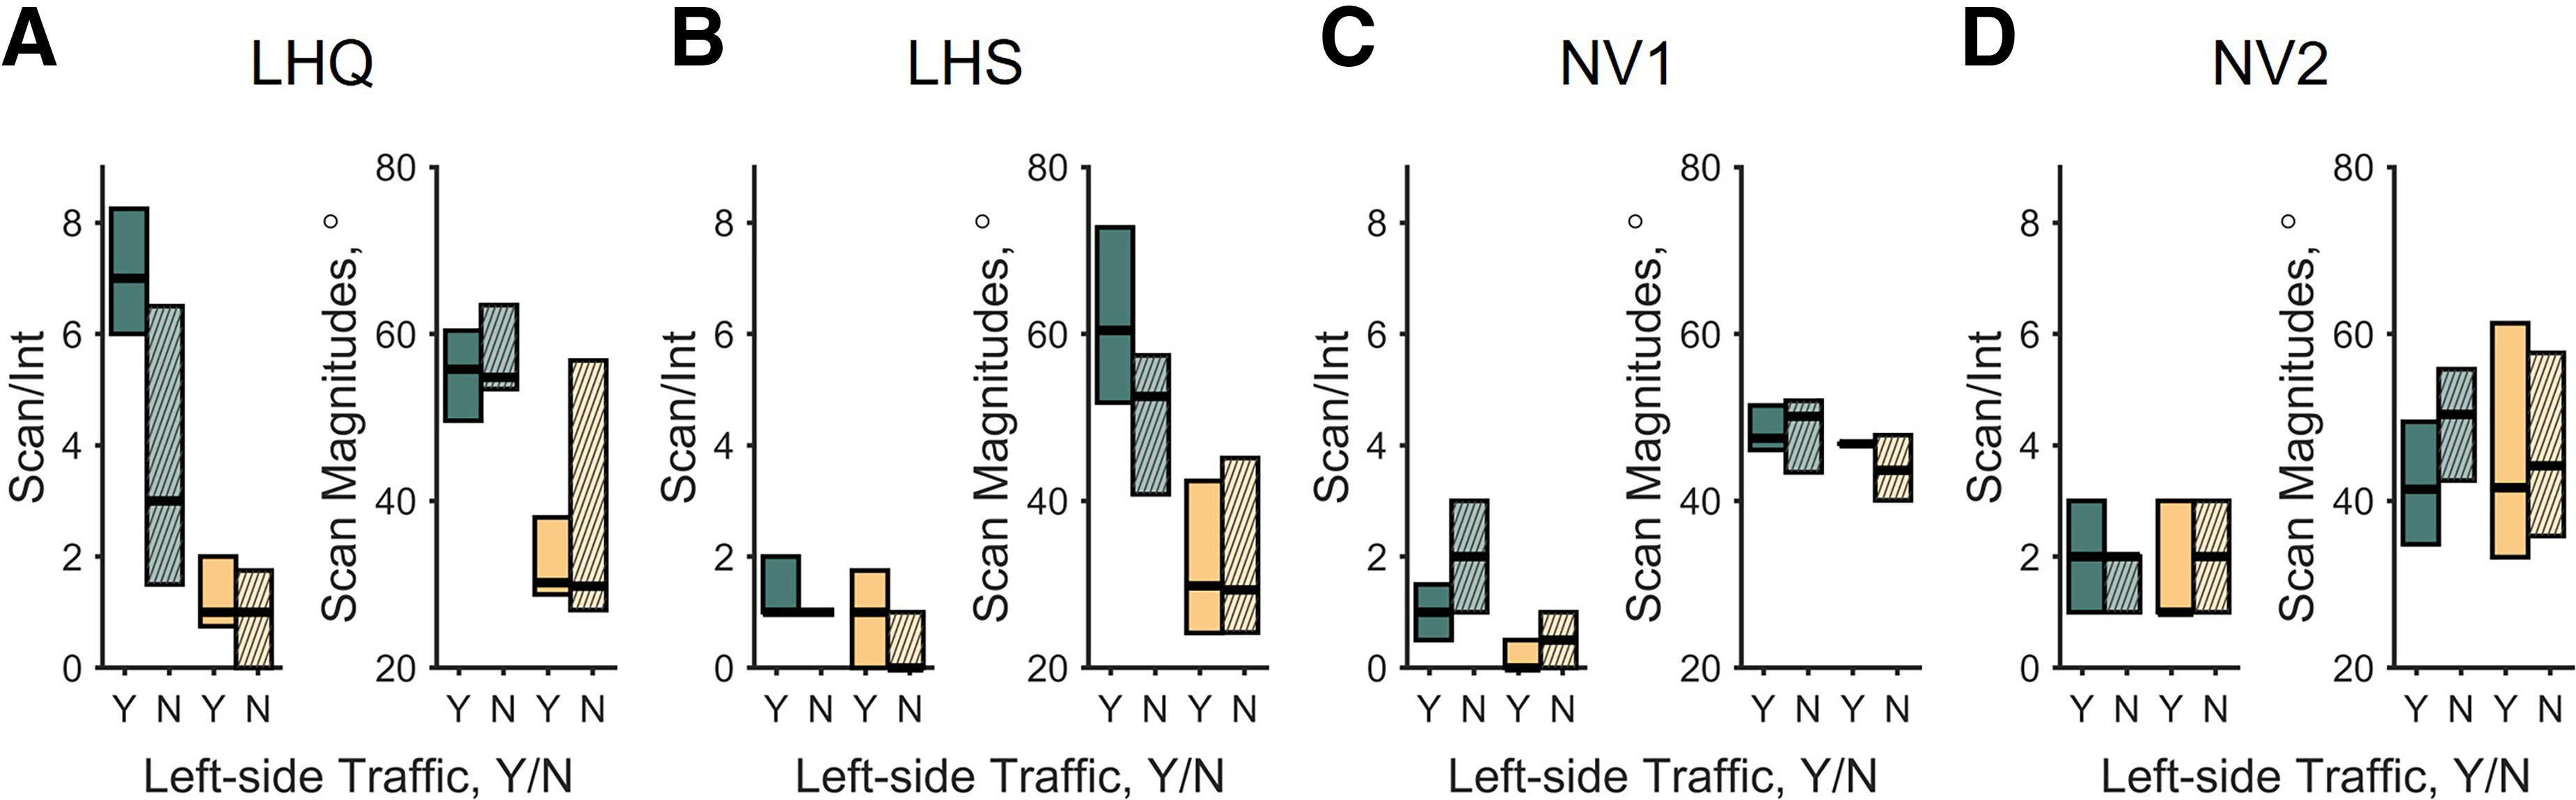
Head scanning behaviors with left-side traffic (solid bars) and without left-side traffic (hatched bars) before left turns at stop-sign–controlled intersections.
No Scan Toward the Left Side
For the two HVFL drivers, rates of not scanning to the left (blind side) were highest (>30%) for traffic-light intersections but lower (∼10%) for no-sign intersections, and they never failed to make a leftward scan at stop-sign intersections (Figure 4, Panel A). Driver NV1 had relatively low rates of not scanning to the left for all intersection types, whereas Driver NV2 had relatively high (>40%) rates only for traffic-light intersections. Most instances of not scanning to the left before making a left turn occurred in the presence of one or more of eight contextual factors listed on the left side of Panel B in Figure 4, most notably: no cars on road (all intersection types), a lead vehicle present (traffic light intersections only), and waiting for oncoming traffic (traffic-light and no-sign intersections). Interestingly, nighttime driving and adverse weather were also among the eight most common situations associated with no leftward scans. Qualitatively, the environmental situations in which no leftward scans occurred were similar for the HVFL and the NV drivers.
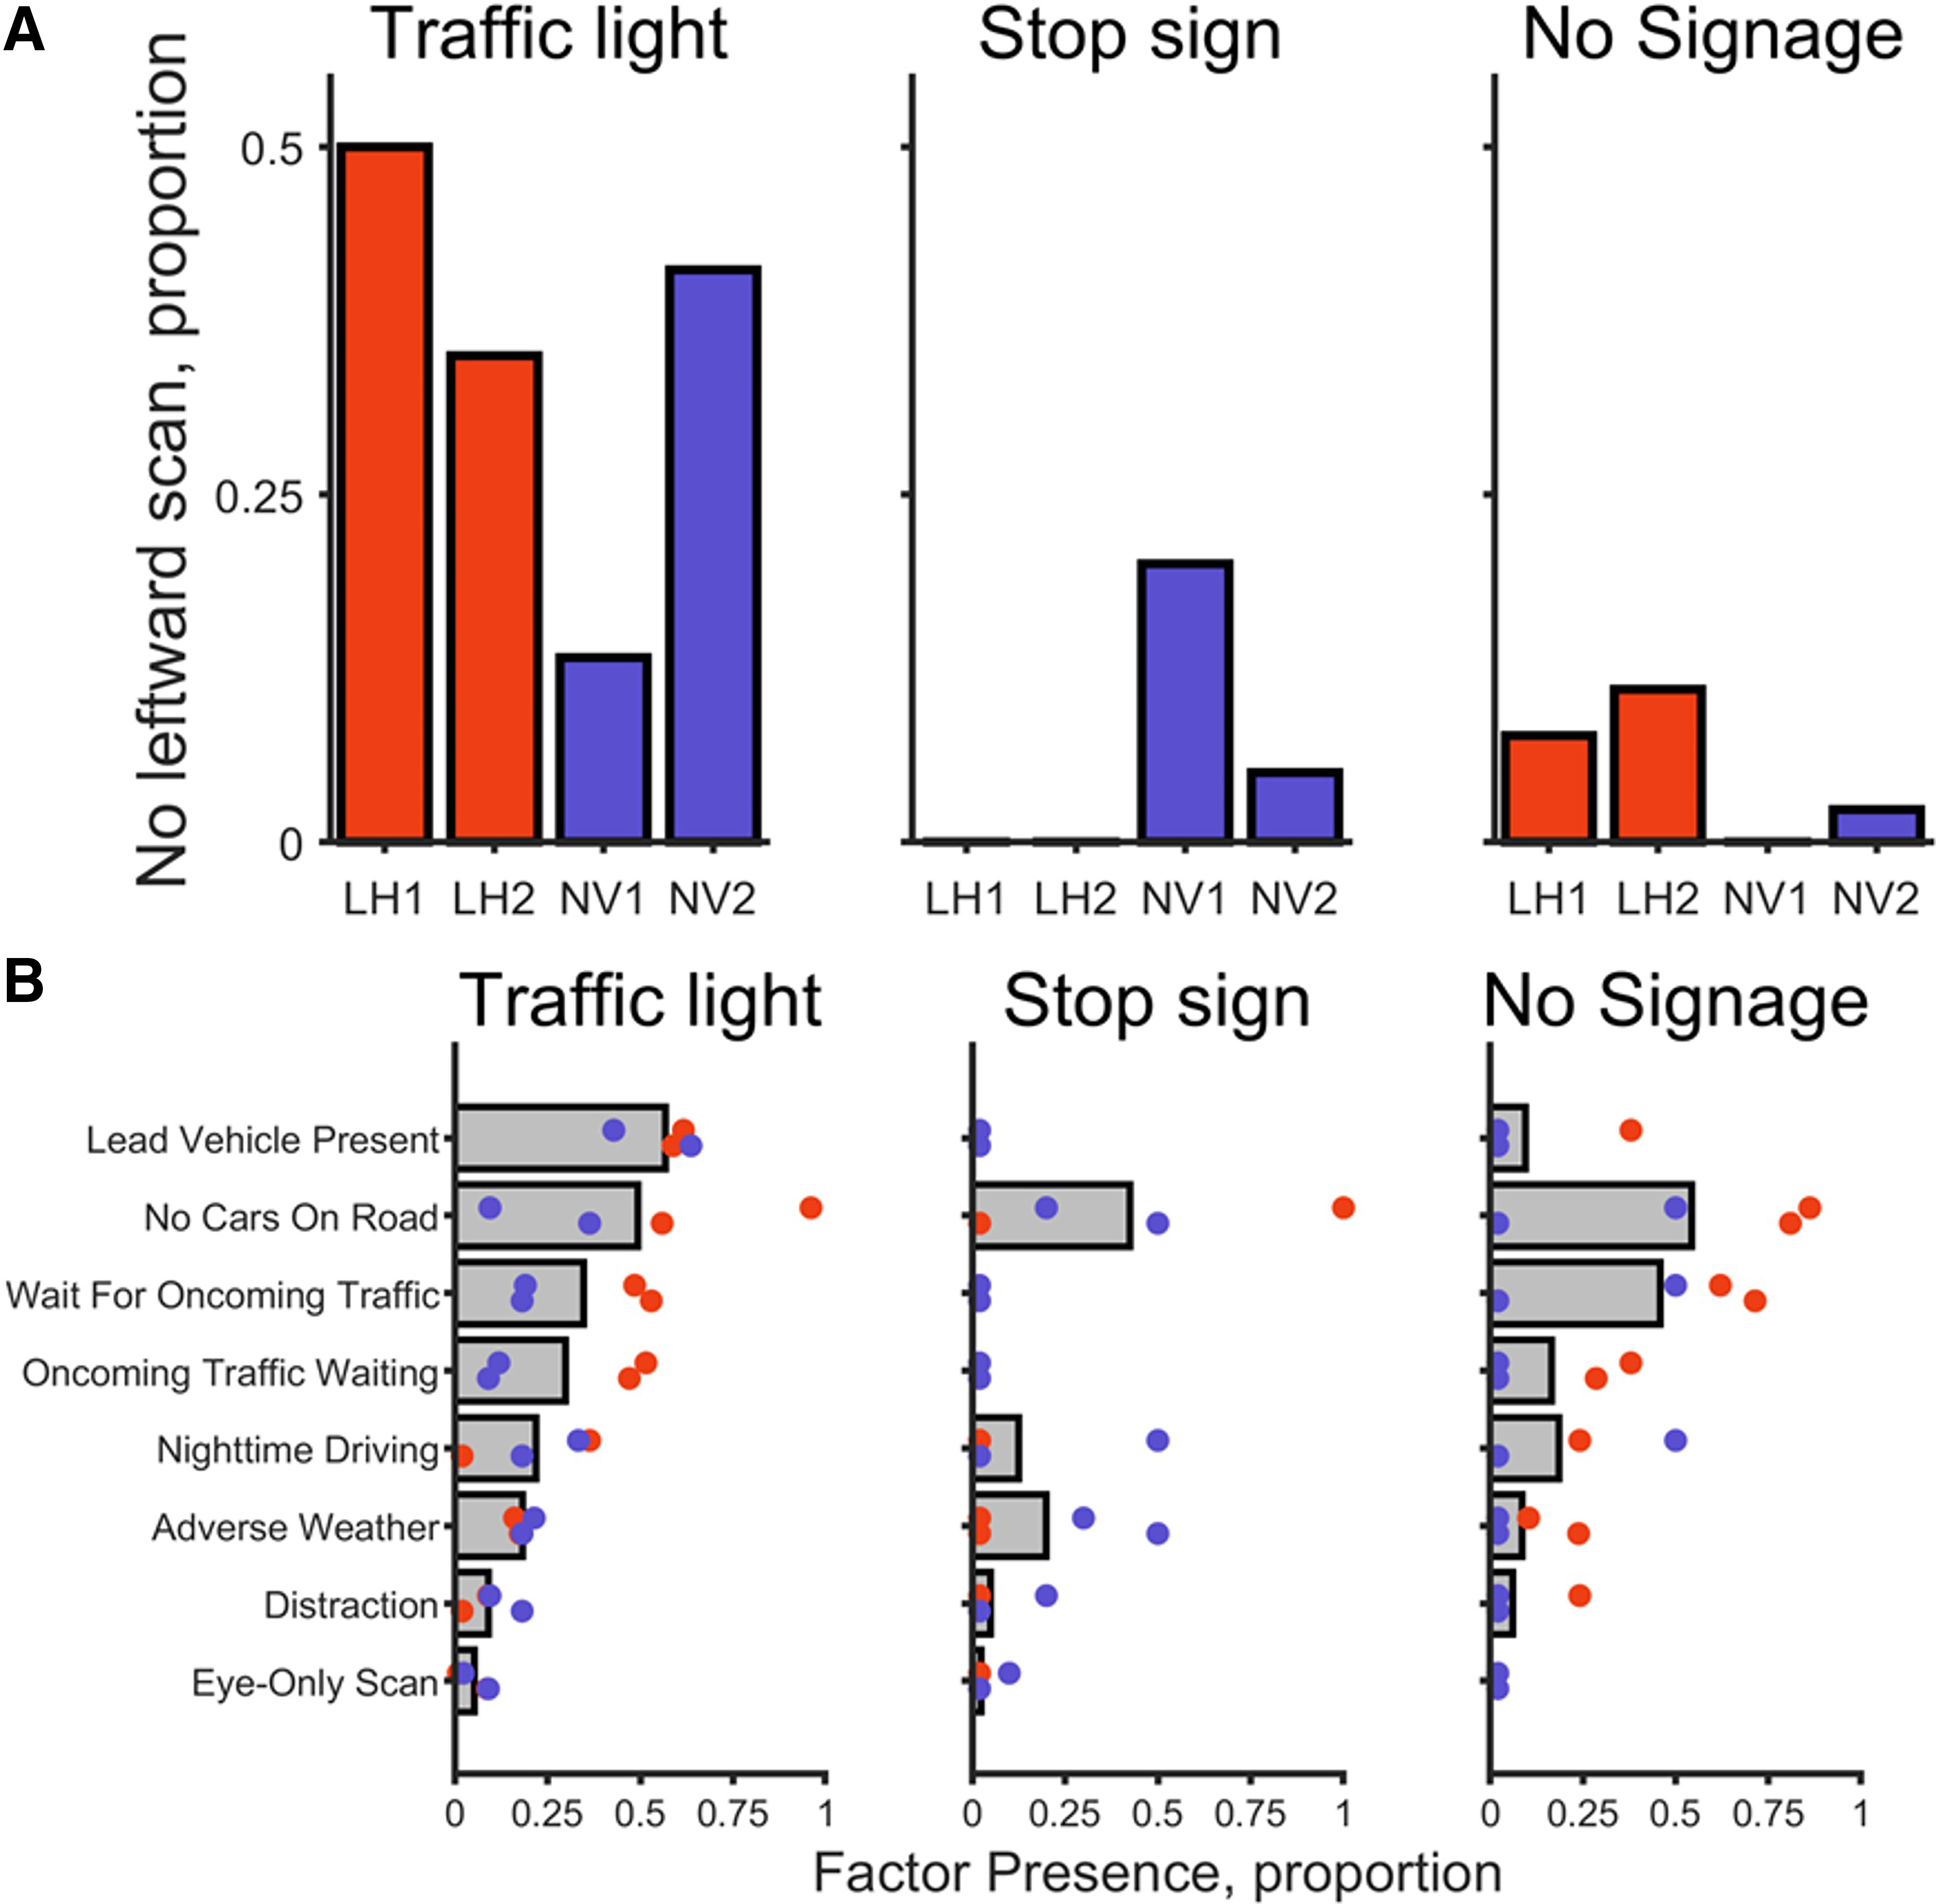
Failing to scan to the left before left turns by intersection type and environmental contextual factors.
Discussion
In this pilot study, we examined the scanning behaviors of drivers with HVFL in a naturalistic driving environment, with a particular focus on large-angle head scans before a left turn at an intersection. The four participants were all active drivers (at least 180 km/wk) with similar total years of driving experience (started driving at age 16 yr). They all exhibited leftward-dominated scanning patterns consistent with those expected for a left turn when driving on the right side of the road (i.e., they were more likely to make at least one scan to the left than the right, with overall more scans to the left). It is noteworthy that the HVFL participant with the greatest amount of visual field loss (LHQ) had the most leftward-dominated scanning with the highest proportion of leftward scans and the least variation in that proportion compared with the HVFL driver with LHS and the two NV drivers.
In a prior simulator study (Bowers et al., 2014), HVFL drivers demonstrated compensatory behaviors in head scan patterns (first scan to the blind side) but not head scan magnitudes. In contrast, our naturalistic driving data suggest compensatory behaviors in both frequency and magnitude of head scanning. HVFL drivers made substantially larger (∼20°) leftward (blind side) than rightward scans, whereas NV drivers did not (<3° difference). Interestingly, the leftward scans of HVFL drivers were larger than those of NV drivers, whereas rightward scans were significantly smaller, suggesting a potential trade-off that may reduce scanning coverage of the seeing side. The presence of cross-traffic from the left increased the frequency of leftward scans in HVFL drivers, but not in NV drivers, suggesting the traffic may have acted as a cue to scan (Xu et al., 2022). Although these findings are all very intriguing, they need to be verified in a study with a larger sample that includes participants with complete homonymous hemianopia.
Drivers with left HVFL never failed to scan to the left at stop-sign intersections and were most likely to not scan to the left at traffic-light intersections. This pattern of behavior seems to be broadly consistent with the potential risk from left-side cross-traffic being higher at stop-sign intersections (where the cross- traffic has priority) than at traffic-light–controlled intersections (especially with protected left turns). Rates of not scanning to the left did not follow such a clear pattern for the NV drivers. Manual review of the videos revealed that the environmental situations with no leftward scans were similar for the HVFL and NV drivers and typically involved situations with no traffic on the road, the presence of a lead car, or waiting for oncoming traffic that was stopped. An interesting finding is that nighttime driving and adverse weather were also among the most frequent contexts for not scanning to the left, which might not have been discovered without naturalistic driving recordings. Reduced visibility during nighttime driving and adverse weather may result in more time looking toward the forward road to resolve visual uncertainty, thereby reducing head scanning. This would be consistent with findings obtained using driving simulators in low-visibility conditions (Konstantopoulos et al., 2010).
Given the case study design and inclusion of only two drivers with differing extents of left HVFL, our findings cannot be assumed to be representative of drivers with HVFL more broadly, in particular those with complete homonymous hemianopia. Similarly, the inclusion of only two age-similar, same-sex drivers with NV limits the generalizability of the findings. Accordingly, these findings should be interpreted as demonstrating the feasibility of applying naturalistic driving study methods to quantify compensatory scanning and the potential of the approach to reveal differences between scanning to the left and right in both drivers with HVFL and drivers with NV. Our analyses focused on head scanning during left-turn maneuvers; future work should compare scanning behavior across different left-turn conditions (e.g., protected left turns, left turns from dedicated turn lanes, and unprotected left turns), extend analyses to straight-through and right-turn maneuvers, and examine interactions between maneuver type and the side of visual field loss in a larger sample. Manual annotation of time of entry to the intersection and traffic environment was feasible for this pilot study but would be impractical for a larger scale study. From a scalability perspective, further automation would be required to potentially eliminate the need for video review of large volumes of data, except in cases requiring detailed examination of critical situations (e.g., scan failures; Pundlik et al., 2025); otherwise, the methods used in this pilot study were found to be robust and suitable for implementation in a larger study.
Implications for Occupational Therapy Practice
This pilot study provides initial objective data demonstrating the potential of naturalistic driving methods to quantify compensatory scanning and identify situations where drivers with HVFL fail to scan. Given the limited number of drivers in our study, these findings suggest preliminary considerations for both rehabilitation practice and future research for occupational therapy practitioners who specialize in driving rehabilitation.
This Brief Report has the following implications for occupational therapy practice: Rehabilitation of clients with HVFL who wish to continue driving may benefit from emphasizing large head turns toward the blind side at intersections to ensure adequate coverage of the cross-street on that side; scans to the blind side should be larger than scans to the seeing side. In addition, the scan failures we observed in specific contexts highlight the importance of reinforcing scanning at all intersections, including low-demand situations (e.g., traffic-light or no-stop–sign intersections with minimal cross-traffic) where hazards may be less common but are still a possibility. The identification of nighttime and adverse weather as contexts associated with increased scan failures suggests that these conditions warrant consideration during assessment and training, although confirmation with larger samples is needed. From a research and practice perspective, these findings highlight the potential value of incorporating naturalistic driving methods into occupational therapy to objectively evaluate compensatory strategies and the contexts in which compensations are applied. Such methods may complement simulator and on-road evaluations by assessing whether rehabilitation interventions translate into habitual scanning behaviors during everyday driving.
Conclusion
This pilot study demonstrates the feasibility of naturalistic driving methods to objectively quantify compensatory head scanning behaviors and identify instances of scan failures among drivers with left HVFL. Although this work was limited by a small sample size, it offers initial, real-world evidence to support use of the methods in a larger study that investigates head scanning of drivers with HVFL in daily driving.