
Abstract
Purpose
Few optical coherence tomography (OCT) studies have investigated outer retinal thickness including the photoreceptor layer in glaucoma. We measured changes in the macular outer retinal thicknesses using OCT in patients with glaucoma with an average follow-up of 2.9 ± 0.8 years.
Methods
A total of 39 eyes of 39 patients with primary open-angle glaucoma were analyzed. The RTVue-100 was used to measure the macular outer retinal, macular ganglion cell complex, and circumpapillary retinal nerve fiber layer thicknesses, global loss volume, and focal loss volume. Using the paired t test, baseline parameters were compared with those at the last follow-up.
Results
The average baseline mean deviation value in the Humphrey Field Analyzer was −2.13 dB. The ganglion cell complex thickness significantly decreased over the follow-up period (baseline thickness, 79.66 ± 7.71 μm; final thickness, 76.79 ± 7.39 μm; p<0.001). There were significant differences between baseline and final visit measurements for circumpapillary retinal nerve fiber layer thickness, global loss volume, and focal loss volume (p<0.001, p<0.001, and p = 0.004, respectively). However, there was no significant change in outer retinal thickness (baseline thickness, 167.56 ± 7.26 μm; final thickness, 167.25 ± 7.93 μm; p = 0.540).
Conclusions
Outer retinal thickness was not altered during the follow-up period. The stability of outer retinal thickness may indicate the reliability of OCT analysis for glaucoma follow-up.
Introduction
Glaucoma is an optic neuropathy characterized by progressive loss of retinal ganglion cells with retinal nerve fiber layer (RNFL) thinning (1). The RTVue-100 (Optovue Inc., Fremont, CA, USA) is a spectral-domain optical coherence tomography (SD-OCT) system that can measure the thickness of the macular ganglion cell complex (GCC: measured from the inner limiting membrane [ILM] to the outer inner plexiform layer [IPL] border), macular outer retina (measured from the outer IPL border to the outer retinal pigment epithelium [RPE] border), and circumpapillary RNFL (cpRNFL). With this instrument, studies report a decrease in GCC and cpRNFL thicknesses at early stages of glaucoma (2-4). The GCC and cpRNFL thicknesses thus may be an important diagnostic parameter for glaucoma (2, 3). A structure–function relationship has also been established for several parameters measured by SD-OCT (5-7). However, decrease in cpRNFL and GCC thickness is observed not only in glaucoma but also in Parkinson disease and multiple sclerosis (MS) with and without optic neuropathy (8-12).
Several studies have used OCT to measure the outer retina thickness in glaucoma patients (13-17). Compared with that in normal eyes, the outer retina thickness was 3% less in glaucoma eyes with time-domain OCT (13). Using SD-OCT, one study reported an annual decrease in outer retina thickness of 1.295 μm in glaucoma eyes (14). On the other hand, others have observed no significant difference in outer retina thickness between normal and glaucoma eyes (15-17). Moreover, outer retina thickness has been reported to be lower in eyes of patients with MS than in normal eyes (10, 11).
The RTVue-100 measures GCC thickness with automated segmentation of retinal layer boundaries. However, segmentation errors of retinal boundaries are frequent and can reduce the reliability of the analysis (18). In order to avoid segmentation error, higher-quality images are vital. Cataract often coexists with glaucoma in the elderly and affects OCT scan quality (19, 20). The signal strength index (SSI) of RTVue-100 ranges from 0 to 90. According to the user's manual, values ≥50 are considered good. However, segmentation error may occur even if the SSI is >50, without the influence of cataract (Fig. 1, A-C). In this case, precise measurement of GCC and cpRNFL thicknesses is not possible. The GCC thickness measurements require precise delineation of the ILM and outer boundary of IPL. Failure to achieve this precise measurement of IPL results in inaccurate measurement of GCC and outer retina thickness (Fig. 1D).
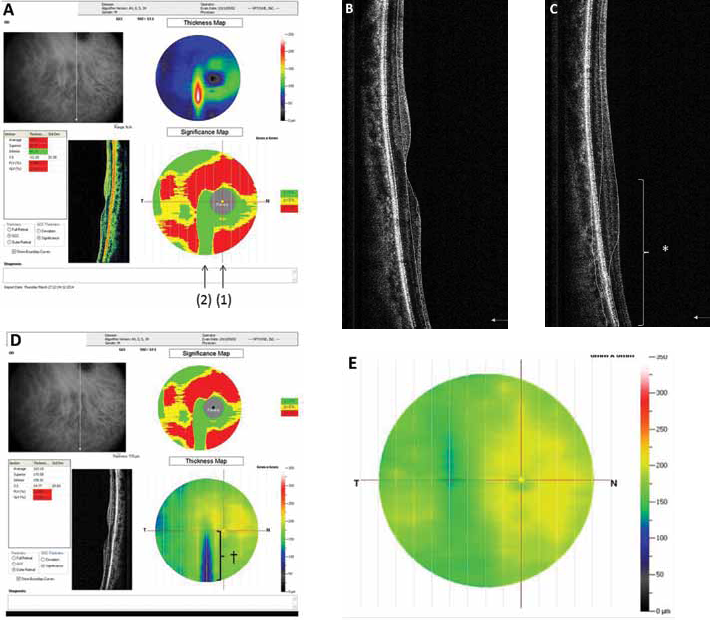
Examples of segmentation errors in ganglion cell complex (GCC) thickness in a right eye with glaucoma. (
During glaucoma follow-up, if outer retina thickness changes minimally, monitoring this parameter when monitoring GCC thickness may be an indication of reliability. That is, if a change in outer retina thickness is detected, another disease or segmentation errors must be considered.
In this retrospective study, we evaluated the changes in macular outer retina and macular GCC thicknesses in patients with glaucoma who were followed for at least 2 years.
Methods
From the research database at Toho University Ohashi Medical Center in Tokyo, we assessed results from one randomly selected eye from each of 50 patients with primary open-angle glaucoma who had been followed for at least 2 years between October 2009 and October 2013. The Toho University Ohashi Medical Center Institutional Review Board for Human Research approved the study protocol (No. 14-16), which adhered to the tenets of the Declaration of Helsinki.
All participants had undergone complete ophthalmologic examination, including visual acuity testing (with refraction), slit-lamp biomicroscopy, gonioscopy, Goldmann applanation tonometry, and dilated stereoscopic fundus examination. Noncycloplegic refraction was measured using an autorefractor/keratometer (ARK-530A; Nidek, Aichi, Japan). Refraction data were converted to the spherical equivalent, defined as the spherical power (in diopters) plus one-half the cylindrical power. The Humphrey Field Analyser (Humphrey-Zeiss Systems, Dublin, CA, USA) 30-2 Swedish Interactive Threshold Algorithm was used for the visual field (VF) test. The VF test was considered reliable when fixation losses were <20% and false-positive and false-negative rates were <15%. An abnormal VF result was defined as an abnormal range on the glaucoma hemifield test, a pattern standard deviation of <5%, or 3 abnormal points (<5% probability of being normal), with 1 point having a pattern deviation of <1%.
To qualify, patients needed to have a best-corrected visual acuity of 20/20 or better, a refractive spherical error between +3.00 and −6.00 D, a refractive cylindrical error of <3.0 D, and open angles gonioscopically (Shaffer grade >2). All patients had characteristic glaucomatous optic neuropathy with corresponding VF abnormalities; we included eyes with primary open-angle glaucoma or normal-tension glaucoma. Glaucomatous optic neuropathy constituted neuroretinal rim narrowing at the optic disc margin with notching, excavation, and/or visible RNFL defects. Patients with secondary elevated intraocular pressure caused by conditions such as iridocyclitis or traumatic angle recession were excluded, as were patients with retinal pathology, neurologic disease, diabetes, or a history of intraocular surgery and retinal laser procedures. All patients were followed up at 6-monthly intervals with VF testing. The first set of VF test data was excluded to obviate any learning effect. The VF data used had a time interval of at least 2 years between baseline and final tests. Estimation of change in VF loss depends on its definition. Fukuchi et al (21) reported that the average mean deviation (MD) slope in 315 Japanese patients with open-angle glaucoma was −0.41 dB/y. We divided our subjects into 2 groups according to the MD slope: those with an MD slope of ≥-0.4 dB/y were placed in the fast change group, and patients with an MD slope of <-0.4 dB/y were placed in the slow change group.
Macula and retinal nerve fiber layer imaging
The OCT measurements of macular parameters and cpRNFL thickness were obtained using the RTVue-100 (software version 4.0.5.39). The RTVue-100 collects ocular microstructural images using a scanning laser diode with a wavelength of 840 ± 10 nm. After pupil dilation, a skilled operator obtained high-quality OCT images. Measurements of macular parameters and cpRNFL thickness for each eye were obtained on the same day. For follow-up of glaucoma patients, OCT scans were not taken regularly. Each of the eyes underwent at least 2 OCT measurements, with a minimum 2-year interval between baseline and final measurements. Then patients meeting the inclusion criteria and the baseline and final OCT data were selected.
The GCC scanning protocol was used to determine GCC thickness (measured from the ILM to the outer IPL border), outer retina thickness (measured from the outer IPL border to the outer RPE border), global loss volume (GLV), and focal loss volume (FLV). Only scans with an SSI of >50 were included in the analyses. The GCC protocol included 15 vertical line scans over a 7 × 7-mm square region. To achieve optimum imaging coverage within the temporal region, the GCC protocol scan was centered 1 mm temporal to the fovea. The area within a 0.75-mm radius of the foveal center was excluded. During the scanning period, the GCC protocol captured 15,000 data points within 0.6 seconds. The GCC scan created a 6-mm map, corresponding to approximately 20° of the VF, and the average GCC and outer retina thicknesses were calculated over the 3 measurement regions (global, superior hemisphere, and inferior hemisphere). The GLV and FLV are two original RTVue-100 parameters calculated from the GCC scan, and detailed descriptions of these analytical methods have been reported (3). Briefly, GLV measures the average amount of GCC loss over the entire GCC map and is based on the fractional deviation (FD) map. The FLV measures the average focal loss over the entire GCC map and is based on both the FD and pattern deviation maps.
The optic nerve head (ONH) protocol was used to determine cpRNFL thickness. Generally, the value of SSI is smaller on the ONH protocol compared to the SSI of GCC scan protocol (2, 19). This is because the number of subjects will decrease when the SSI is more than 50. Therefore, only scans with an SSI >40 were included in the analyses. The total time required to acquire a single scan was 0.55 seconds. Using the OCT-generated fundus image (video baseline protocol), ONH contours were manually traced. The cpRNFL thickness was then automatically measured using existing software at a diameter of 3.45 mm around the center of the optic disc. A total of 775 A-scans were obtained along this circle. Participants were excluded if peripapillary atrophy extended outside the OCT measurement circle. The cpRNFL thickness represented a mean thickness of a 360° area. All VF and OCT tests were conducted within a 3-month period. When data from both eyes were eligible for analysis, the eye with the higher SSI was selected.
Statistical analyses
SPSS statistical software (version 20.0, SPSS Inc., Chicago, IL, USA) was used for statistical analyses. The normality of distribution of the study sample was assessed by the Shapiro-Wilk test. Descriptive statistics are presented as mean ± SD for normally distributed variables and medians and interquartile ranges for non-normally distributed variables. The paired t test was used to compare factors between the baseline and final values. Intervisit reproducibility was determined by intraclass correlation coefficient (ICC) of outer retina thickness. A p value of <0.05 was considered statistically significant. For a power of 0.8 with a significance level of 0.05, the minimal required sample size would be 30 patients to detect differences in outer retina thickness as small as 3.755 μm (14). Power analysis was performed using the Power and Sample Size program, version 3.0.43, 2009 (Vanderbilt University, Nashville, TN, USA).
Results
Fifty eyes initially qualified for study inclusion, of which 11 were excluded because of poor OCT image quality. Of the 11 excluded eyes, 4 had a GCC SSI of <50 and 7 had segmentation errors. Therefore, the final analyses included 39 eyes of 39 patients (mean age 57.3 ± 11.3 years). The mean baseline MD value, baseline pattern standard deviation (PSD) value, and follow-up period were −2.13 dB, 5.85 dB, and 2.9 ± 0.8 years, respectively. For the 39 eyes, OCT scans were carried out twice in 27 eyes, 3 times in 8 eyes, and 4 times in 4 eyes. The participants’ characteristics are presented in Table I. The final MD value and final PSD value were −3.23 (5.03) dB and 6.92 (9.37) dB, respectively. These values were significantly different from the baseline values (p = 0.007 and p = 0.005, respectively; Wilcoxon signed-rank test). There were 13 eyes in the fast and 26 in the slow change group.
Characteristics of the study participants at baseline
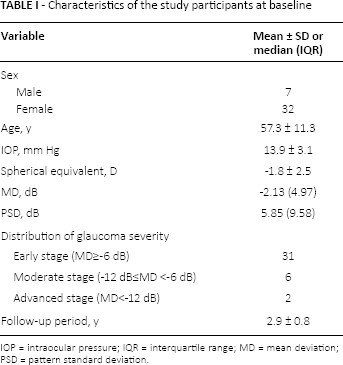
IOP = intraocular pressure; IQR = interquartile range; MD = mean deviation; PSD = pattern standard deviation.
Table II summarizes the SD-OCT parameter measurements obtained using the RTVue-100. The average final GCC and cpRNFL thicknesses were significantly decreased compared with those at baseline (p<0.001 and p<0.001, respectively). The final FLV and GLV were significantly increased compared with those at baseline (p = 0.004 and p<0.001, respectively). However, no significant difference was observed in outer retina thickness (p = 0.540).
Optical coherence tomography parameter measurements obtained using RTVue-100
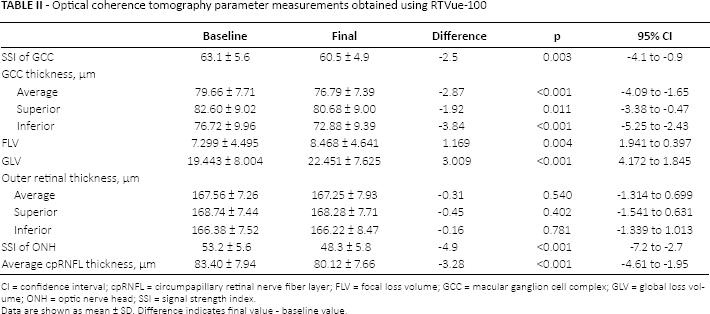
CI = confidence interval; cpRNFL = circumpapillary retinal nerve fiber layer; FLV = focal loss volume; GCC = macular ganglion cell complex; GLV = global loss volume; ONH = optic nerve head; SSI = signal strength index.
Data are shown as mean ± SD. Difference indicates final value - baseline value.
Since there was no significant difference in outer retina thickness, the reproducibility of outer retina thickness was assessed. Intervisit reproducibility is shown in Table III. The intervisit ICC was 0.918 for average outer retina thickness.
Intervisit intraclass correlation coefficients of macular analysis
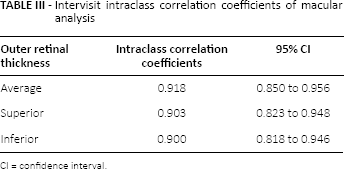
CI = confidence interval.
Discussion
We evaluated changes in outer retina and GCC thicknesses in patients with primary open-angle glaucoma over a minimum period of 2 years (mean follow-up duration, 2.9 years). Although there was no significant difference between baseline and final outer retina thickness, GCC thickness decreased significantly over the follow-up period. Almost perfect intervisit ICC values were found for all outer retina thicknesses, ranging between 0.900 and 0.918.
Because cpRNFL and GCC thicknesses are significantly reduced in glaucoma eyes compared with those in normal eyes, many studies have suggested that they are effective diagnostic indicators for glaucoma (2, 3, 5, 22, 23). The GCC thickness measured during the course of glaucoma follow-up is a useful parameter (24, 25). However, GCC and cpRNFL thicknesses decrease with age and are affected by poor image quality (14, 19, 20). Compared with normal eyes, a decrease in cpRNFL and GCC thicknesses is not only reported in patients with glaucoma but also in patients with diabetes mellitus, sleep apnea syndrome, Parkinson disease, and MS (8-12, 26, 27). When cpRNFL and GCC thicknesses decrease during glaucoma follow-up, along with the possibility of glaucoma progression, physicians should consider these other diseases.
Perhaps because cone (but not rod) swelling might occur, an increase in outer retina thickness in the fovea was reported in glaucoma eyes (28). Nork et al (29) postulated ischemia from reduced choroidal blood flow with swelling of the photoreceptors and a decrease in glutamate reuptake. At the same time, no significant difference has been reported in outer retina thickness in the parafovea between normal and glaucoma eyes (28). It has been reported that the outer retina thickness decreases annually by 1.295 μm during glaucoma follow-up (14). This decrease in outer retina thickness with time in patients with glaucoma may be mostly age-related; outer retina change is not typical in glaucoma (14). We observed no significant difference in outer retina thickness during our mean 2.9 years of follow-up. This may be due to exclusion of measurement of the fovea in the RTVue-100 and/or because the follow-up period was only 2.9 years. In a study of patients with MS, thinning was observed not only in the GCC but also in the outer retina (11). Furthermore, Garcia-Martin et al (12) reported thinning in the GCC and outer plexiform layer in patients with Parkinson disease. Although a longer term follow-up is required for patients with glaucoma, the patient may contract another disease during the course of follow-up. It is meaningful to measure changes in outer retina thickness as well as GCC thickness because there is a possibility that the patient may develop a disease other than glaucoma if a change in outer retina thickness is detected. This is as important as confirming false-positive and false-negative results and fixation losses in standard automated perimetry.
Segmentation errors are frequent on scans obtained by SD-OCT. Previous reports have documented that segmentation errors often occur in normal eyes and in eyes with retinal disease (18, 30). A good image quality is required to decrease segmentation errors; the scan quality of RTVue-100 is indicated by SSI. The general guidelines from the manufacturer of RTVue-100 are as follows: an SSI value >40 and <50 indicates an adequate-quality scan that can be analyzed but should be repeated if possible, a value >50 and <60 indicates a good-quality scan, and a value >60 indicates a very good-quality scan. However, a segmentation error may occur in B scans even if SSI is >50 (Fig. 1, A-C). We found a segmentation error of 15% in patients even though SSI was >50 with the initial inclusion. The presence or absence of a segmentation error can be confirmed through B-scan, but only one vertical scan can be confirmed from the printout result. Although all 15 vertical scans can be confirmed from the OCT device, the procedure is not easy. A segmentation of ILM and IPL is necessary for the measurement of GCC thickness. If there is an error in IPL segmentation, there will also be an error in outer retina thickness measurement (Fig. 1D). Therefore, when following glaucoma eyes using OCT, not only the changes in GCC thickness but also changes in outer retina thickness should be evaluated. If a change in outer retina thickness is observed, a segmentation error could be considered. Measurement of outer retina thickness using OCT at the time of follow-up can increase the reliability of GCC thickness (Fig. 1E).
Our study has several limitations. First, it was retrospective. Second, confirmation of the absence of changes in outer retina thickness may indicate lack of error in segmentation of the outer IPL border and RPE border; however, it does not clarify the absence of error in segmentation of ILM. Third, as our patients predominantly had early-stage glaucoma, further investigations are needed to assess changes in glaucomatous eyes with more advanced damage. Finally, GCC thickness may appear decreased with the progression of cataract on OCT; however, it remains unclear whether outer retina thickness will decrease with cataract progression (19).
In conclusion, there was no significant decrease in outer retina thickness in glaucoma eyes over a mean follow-up period of 2.9 years (minimum at least 2 years), whereas a significant decrease in GCC thickness was observed. Almost perfect intervisit ICC value was found for outer retina thickness. Evaluation of changes in outer retina thickness together with evaluation of changes in GCC thickness to observe the progression of glaucoma is as important as confirming false-positive and false-negative results and fixation losses in standard automated perimetry; this measurement may also indicate the reliability of GCC thickness. Although the existing OCT program is able to follow the course of GCC thickness over a period of time, it lacks the program to monitor outer retina thickness automatically. Hopefully, a new software version will fill this gap.
Footnotes
Acknowledgment
The authors thank Prof. Chiaki Nishimura for statistical analysis of the data.
Financial support: No financial support was received for this submission.
Conflict of interest: None of the authors has conflict of interests with this submission.