
Abstract
Purpose
To assess the choroidal thickness in different degrees of myopia using enhanced depth imaging optical coherence tomography (EDI-OCT) compared with healthy subjects.
Methods
We included 240 patients with myopia and 60 emmetropes as controls. Participants underwent full ophthalmologic examination, axial length measurement, and EDI-OCT imaging of the choroid. Choroidal thickness (CT) was measured at 5 locations, including subfoveal (SFCT), 2 mm nasal, temporal, upper, and lower to fovea.
Results
Choroidal thickness was significantly lower in myopic eyes compared to controls. Regardless of the degree of myopia, nasal regions showed the lowest CT with decremental pattern with advance of myopia (low myopia 279.00 ± 24.50 µm, moderate myopia 269.58 ± 20.69 µm, high myopia 189.58 ± 25.95 µm, advanced myopia 96.75 ± 24.83 µm). Highest CT was variable according to the degree of myopia with decremental pattern with advance of myopia (low myopia in subfoveal region 354.40 ± 35.14 µm, moderate myopia in temporal region 337.87 ± 35.75 µm, high myopia in lower region 312.15 ± 38.90 µm, and advanced myopia in upper region 201.25 ± 18.27 µm). Axial length showed significant negative correlation with SFCT and CT in different studied regions.
Conclusions
Different degrees of myopia showed thinner choroidal thickness than that of normal control eyes with decremental thinning with progress of myopia. This might be secondary to the longer axial length, which was the determining factor in some locations such as subfoveal, nasal, and upper CT.
Introduction
High myopia is one of the main causes of visual impairment worldwide (1). About 1% of the population has high myopia (2).
There is significant evidence from research with animal models (1–2–3–4–5–6) and humans that the development of refractive errors is associated with changes in the structural characteristics of the choroid. Studies from a range of different animal species, including chicks (3, 4), macaque monkeys (5), and marmosets (6), indicate that alterations in choroidal thickness (CT) can precede and accompany the development of myopic and hyperopic refractive errors.
Cross-sectional studies utilizing optical coherence tomography (OCT) to image and measure the choroid in adult humans with normal ocular health have demonstrated that, along with age, refractive error is one of the major factors influencing CT (7–8–9–10–11–12).
Choroid is a 3D structure, with a highly anastomosed network of blood vessels, and has been shown to exhibit considerable topographic variation (13–14–15–16); a key gap in our current knowledge is whether ocular parameters affect CT uniformly throughout the macula or at different rates in various regions of the macula. Retinal and choroidal diseases are not confined to the fovea, and may involve other regions of the macula. Therefore, it is essential to understand how CT in different regions of the macula vary with spherical equivalent (SE), axial length (AL), or age so as to fully appreciate the effects of the disease process on the choroid.
Flores-Moreno et al (17) found that AL is especially associated with CT in high myopia. The CT profile in highly myopic patients differs from that in emmetropic patients. Wang et al (18) stated that the CT in highly myopic eyes was thinner than that of normal control eyes and this might be secondary to the longer AL but it is not an independent factor. Gupta et al (19) concluded that highly myopic eyes have significantly thinner peripapillary choroid and showed different distribution of thickness compared with emmetropic eyes. Axial length, intraocular pressure, posterior staphyloma, and chorioretinal atrophy significantly influence peripapillary CT (PPCT) and should be taken into consideration during clinical interpretation of PPCT measurement. Ikuno et al (20) concluded that the highly myopic choroid might gradually thin and be affected by many factors. Location and AL are key factors to regulate the rate of choroidal thinning in highly myopic eyes. Overall, CT was not found to change significantly. The research has targeted comparison between high myopia and emmetropia; therefore, we aimed to assess the CT of patients with different degrees of myopia using enhanced depth imaging OCT (EDI-OCT) and compare it with that of healthy subjects.
Methods
This clinical study was conducted between March 2014 and December 2015. All participants were chosen from patients attending the ophthalmologic outpatient clinics of Ain Shams University for ophthalmologic examination. It included 240 patients with myopia (age 15-35 years). Sixty age- and sex-matched healthy emmetropic subjects were included as a control group.
Study subjects included 240 patients with myopia (right eye of each) divided equally among 4 groups (each group contained 60 eyes) according to degree of myopia: mild myopia group >-0.5 D to -3.00 D; moderate myopia group >-3.0 D to -6.00 D; high myopia group >-6.0 D to 10.0 D; and advanced myopia group greater than -10.0 D. Sixty age- and sex-matched healthy emmetropic subjects (60 eyes) were included as a control group.
We excluded any patient with preexisting retinal disease, whether congenital or acquired, especially diabetes mellitus, opaque media, glaucoma, previous eye trauma, previous retinal surgery, and previous optic nerve disease such as optic neuritis or ischemic optic neuropathy.
All procedures performed in studies involving human participants were in accordance with the ethical standards of the Faculty of Medicine, Ain Shams University research committee, and with the 1964 Helsinki declaration and its later amendments or comparable ethical standards. Informed consent was obtained from all individual participants or their guardians, for whom identifying information is included.
All participants underwent a refractive error examination using noncycloplegic autorefraction (Topcon KR-8800; Tokyo, Japan). We calculated SE as the sum of the spherical power and half of the cylinder power (21). All participants also underwent a thorough ophthalmic evaluation including best-corrected visual acuity (BCVA), slit-lamp examination, Goldman applanation tonometry, indirect ophthalmoscopy, AL measurement (PacScan 300A; Sonomed Escalon, New Hyde Park, NY, USA), and spectral-domain OCT (Retinascan RS-3000 Advance; Nidek, Gamagori, Japan).
Axial length measurement
Axial length was measured using A-scan ultrasonography (PacScan 300A). Prior to measurement, the cornea was anesthetized with 1 drop of topical 0.4% benoxinate HCl. Five readings were taken to derive an average value. The standard deviation was below 0.1 mm for each subject.
Optical coherence tomography
Choroidal mode EDI-OCT scan was performed on every patient from 9 AM to 12 PM (to limit the potential confounding influence of diurnal variations in CT) (22) after mydriasis using Mydriacyl 0.5% eyedrops. The same experienced operator captured the OCT scans using a single macula line scan averaged from 120 A-scans to obtain the best quality image and nearly without noise, and the resolution of the single scan of the 120 A-scans is 1,024; thus every scan is high-definition. In addition, the signal strength in our device nearly equals the signal to noise ratio.
The line scans were taken at the macula horizontally at 180° and vertically at 90° approaching the device camera from the patient's eye until the image was inversed and we obtained the choroidal mode; then the image was captured when it was clear enough with high signal strength.
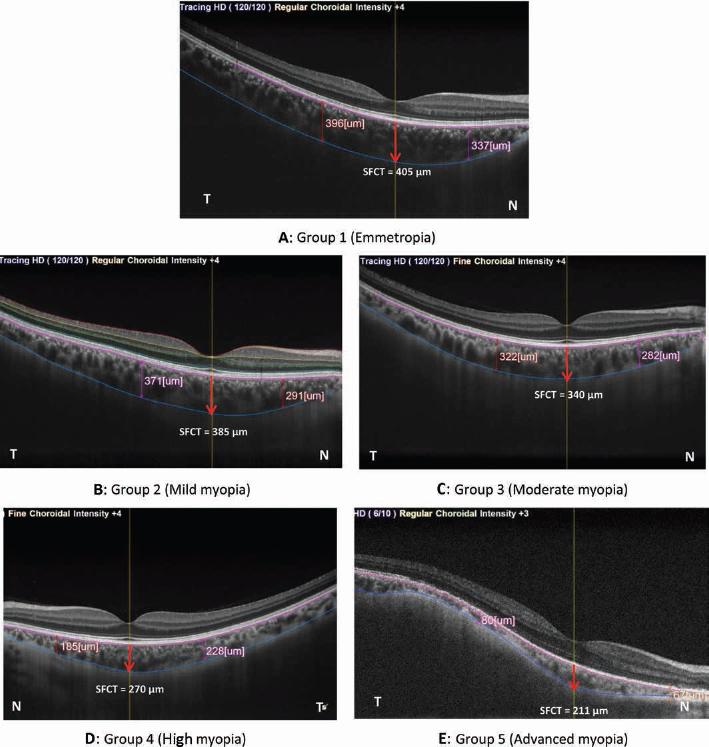
Subfoveal CT (SFCT) was measured perpendicularly from the hyperreflective outer border of the retinal pigment epithelium (RPE) to the sclero-choroidal interface (SCI), which was drawn manually using the embedded software.
Predefined locations (2 mm nasal, temporal, superior, and inferior) were measured from the center of the fovea using a caliper; then the CT was measured perpendicularly from the hyperreflective outer border of the RPE to the SCI (NAVIS- EX Image Filing software, RS3000-OCT).
Statistical Analysis
All data analyses were performed using the Statistical Package for Social Sciences version 15.0 (SPSS Inc., Chicago, IL, USA). Quantitative data are presented as mean ± SD. Sex differences were analyzed using chi-square analysis. Multiple group means of parametric datasets were compared using one-way analysis of variance (ANOVA) test. A Tukey honestly significant difference (HSD) post hoc test was performed if an overall significance was found. Regression analyses were done on the different factors that influence CT. p Values were considered statistically significant if <0.05.
Results
We included 240 patients with myopia (age 15-35 years). Sixty age- and sex-matched healthy emmetropic subjects were included as a control group.
Participants were classified based upon subjective noncycloplegic SE: emmetropia ≤ ± 0.5 D (male/female = 33/27), mild myopia >-0.5 D to -3.00 D (male/female = 32/28), moderate myopia >-3.0 D to -6.00 D (male/female = 31/29), high myopia >-6.0 D to -10.0 D (male/female = 35/25), and advanced myopia >-10.0 D (male/female = 34/26). Sex was not significantly different within or between groups (χ2 = 0.67, p = 0.95).
Analysis of variance showed no significant differences among the 5 groups for age, but there is a significant difference among the 5 groups for BCVA, refraction, and AL (Tab. I).
Comparison among the 5 studied groups regarding age, BCVA, refraction, and AL
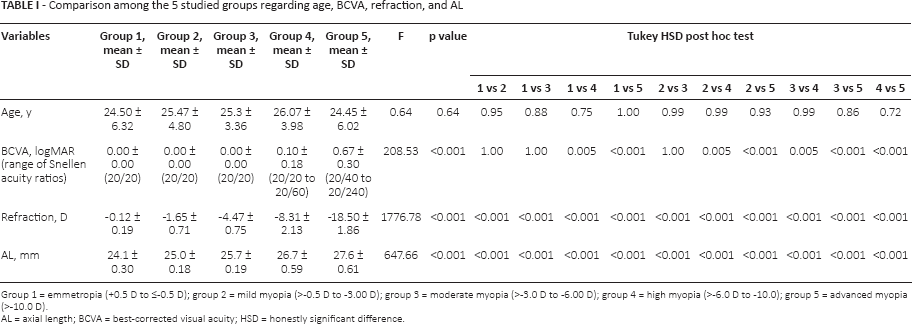
Group 1 = emmetropia (+0.5 D to ≤-0.5 D); group 2 = mild myopia (>-0.5 D to -3.00 D); group 3 = moderate myopia (>-3.0 D to -6.00 D); group 4 = high myopia (>-6.0 D to -10.0); group 5 = advanced myopia (>-10.0 D).
AL = axial length; BCVA = best-corrected visual acuity; HSD = honestly significant difference.
Post hoc (Tukey HSD) analysis revealed that BCVA is equal in groups 1, 2, and 3, but BCVA is lower in groups 4 and 5 than group 1 (p<0.001), BCVA is lower in groups 4 and 5 than groups 2 and 3 (p <0.001), and BCVA is lower in group 4 than group 5 (p<0.001). The AL is significantly lower in the emmetropic group than in the other myopic groups.
Fundus examination revealed the presence of peripapillary area (5 cases, 8.3%), fundus nasal to the disc (3 cases, 5%), and 1 case (1.6%) of posterior staphyloma in group 5 (advanced myopia group). There is Patches of chorio-retinal atrophyin the posterior pole & peri-papillary chorio-retinal atrophy but they are away from our mesurments.
Significant differences among the 5 groups regarding SFCT were found using ANOVA, whereas post hoc (Tukey HSD) analysis of SFCT showed a statistically significant difference in all groups except for group 1, which showed a statistically insignificant difference vs group 2 (p = 0.19); also, group 2 showed a statistically insignificant difference vs group 3 (p = 0.14) (Tab. II and Figs. 1–2).
Comparison among the 5 studied groups regarding SFCT and CT in different positions
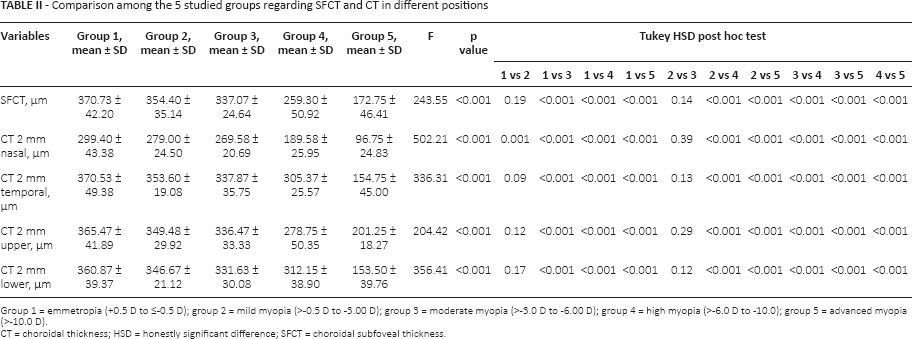
Group 1 = emmetropia (+0.5 D to ≤-0.5 D); group 2 = mild myopia (>-0.5 D to -3.00 D); group 3 = moderate myopia (>-3.0 D to -6.00 D); group 4 = high myopia (>-6.0 D to -10.0); group 5 = advanced myopia (>-10.0 D).
CT = choroidal thickness; HSD = honestly significant difference; SFCT = choroidal subfoveal thickness.
(
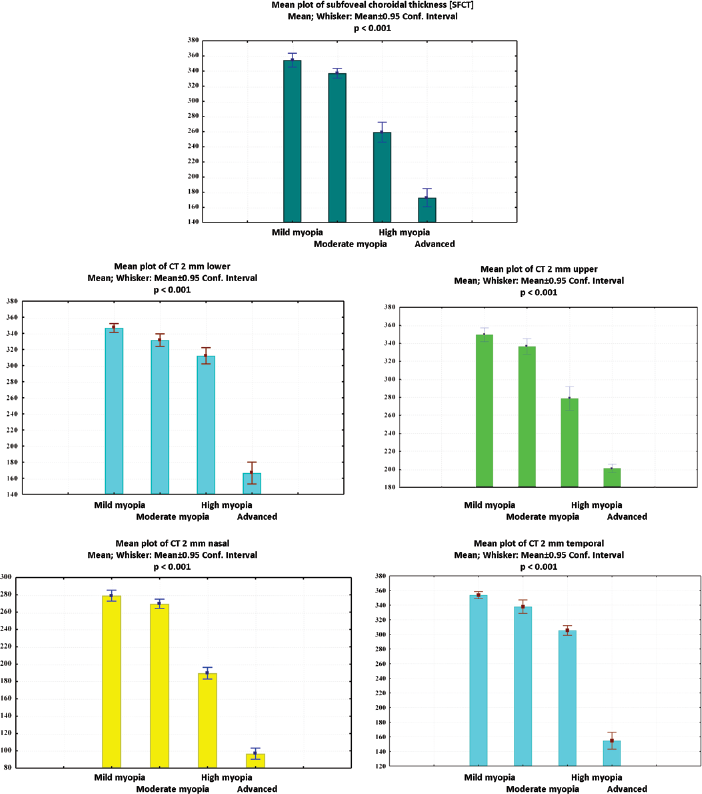
Comparison of choroidal thickness in different regions in the studied myopic groups (p<0.001).
Again, ANOVA disclosed significant differences among the 5 groups regarding the CT 2 mm nasal, and post hoc (Tukey HSD) analysis of CT 2 mm nasal in all groups was statistically significant, except for that of group 2, which showed a statistically insignificant difference vs group 3 (p = 0.39) (Tab. II and Figs. 1–2).
Regarding the CT 2 mm temporal, ANOVA showed significant differences among the 5 groups, and post hoc analysis revealed all groups’ CT 2 mm temporal to have a statistically significant difference, except that of group 1, which had a statistically insignificant difference vs group 2 (p = 0.09). A statistically insignificant difference between groups 2 and 3 (p = 0.13) was also observed (Tab. II and Fig. 2).
Moreover, significant differences among the 5 groups regarding CT 2 mm upper were discovered using ANOVA, and post hoc analysis revealed statistically significant differences among all groups. The results were insignificant between groups 1 and 2 (p = 0.12) and between groups 2 and 3 (p = 0.29) (Tab. II and Figs. 1–2).
Furthermore, the results showed significant differences among the 5 groups regarding the CT 2 mm lower with ANOVA, and post hoc analysis showed a statistically significant difference among all groups. The results were statistically insignificant between groups 1 and 2 (p = 0.17), and group 2 showed a statistically insignificant difference vs group 3 (p = 0.12) (Tab. II and Figs. 1–2).
Multiple regression analysis examining the influence of different factors on SFCT and CT in different positions
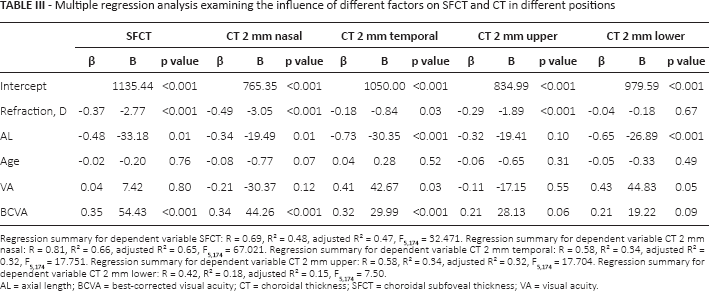
Regression summary for dependent variable SFCT: R = 0.69, R² = 0.48, adjusted R² = 0.47, F5,174 = 32.471. Regression summary for dependent variable CT 2 mm nasal: R = 0.81, R² = 0.66, adjusted R² = 0.65, F5,174 = 67.021. Regression summary for dependent variable CT 2 mm temporal: R = 0.58, R² = 0.34, adjusted R² = 0.32, F5,174 = 17.751. Regression summary for dependent variable CT 2 mm upper: R = 0.58, R² = 0.34, adjusted R² = 0.32, F5,174 = 17.704. Regression summary for dependent variable CT 2 mm lower: R = 0.42, R² = 0.18, adjusted R² = 0.15, F5,174 = 7.50.
AL = axial length; BCVA = best-corrected visual acuity; CT = choroidal thickness; SFCT = choroidal subfoveal thickness; VA = visual acuity.
Choroidal thickness also changed significantly with measurement location, with the thinnest choroid observed in the 2 mm nasal and the thickest choroid in the 2 mm temporal in mild and moderate myopia, 2 mm lower in severe myopia, and 2 mm upper in advanced myopia (Tab. II and Figs. 1–2).
Axial length showed a significant positive correlation with SE (r = 0.90 and p<0.001) but it showed negative correlation with SFCT, CT 2 mm nasal, CT 2 mm temporal, CT 2 mm upper, and CT 2 mm lower (r = -0.78, -0.83, -0.75, -0.76, and -0.69, respectively) (p<0.001, <0.001, <0.001, <0.001, and <0.001, respectively).
We plotted multiple regression analyses for myopic patients to show which factor in the study was the most important determinant of subfoveal CT and CT in different positions. We found that SFCT and CT in different positions were not attributable to age or visual acuity, while SE and AL were the most important determinants for SFCT (β = -0.37 and -0.48, respectively) (p<0.001 and 0.01, respectively). The SE, AL, and BCVA were the most important influential factors for CT 2 mm nasal (β = -0.49, -0.34, and 0.34, respectively) (p<0.001, 0.01, and <0.001, respectively). Also SD, AL, and BCVA have the most important influence for CT 2 mm temporal (β = -0.18, -0.73, and 0.32, respectively) (p = 0.03, <0.001, and <0.001, respectively). The SE was the only determining factor for CT 2 mm upper (β = -0.29, p<0.001), while AL was the only determinant for CT 2 mm lower (β = -0.65, p<0.001) (Tab. III).
Discussion
In this cross-sectional study, we measured the macular CT in different degrees of myopia and in normal control eyes. Overall, CT was significantly lower in myopes compared to emmetropes. Moreover, CT varied by location. In low myopic eyes, the thickest CT is under the fovea (subfoveal), while the thinnest is in the nasal region. However, for eyes with moderate myopia, the thickest measurements were found in the temporal region; the thinnest region remained in the nasal direction. This is in agreement with many studies, such as Zhang et al (23), who found that the thickest location for eyes with high myopia is found in the lower region while the thinnest region is in the nasal direction. We found that the thickest measures were found in the upper region in the advanced myopic eyes, but the thinnest region persisted in the nasal direction (23). This difference could be because Zhang et al (23) included 20 myopic patients (40 eyes) and he did not include a control group (emmetropic participants) while our work included 240 patients with myopia (240 eyes), with 60 age- and sex-matched healthy emmetropic subjects (60 eyes) as a control group. Zhang et al (23) included 20 eyes ≤3 D (low myopic), 10 eyes between -3 and -6 D (moderate myopic), and 10 eyes ≥6 D (high myopic). We classified our participants into 5 groups according to their SE refractive error: emmetropia +0.5 D to ≤-0.5 D, mild myopia >-0.5 D to -3.00 D, moderate myopia >-3.0 D to -6.00 D, high myopia >-6.0 D to -10.0 D, and advanced myopia greater than -10.0 D.
Multiple regression analyses showed that refraction, AL, and BCVA were the most important influential factors for CT 2 mm nasal (β = -0.49, -0.34, and 0.34, respectively) (p<0.001, 0.01, and <0.001, respectively). Also, refraction, AL, and BCVA have the most important influence on CT 2 mm temporal (β = -0.18, -0.73, and 0.32, respectively) (p = 0.03, <0.001, and <0.001, respectively). Refraction was the only determining factor for CT 2 mm upper (β = -0.29, p<0.001), while AL was the only determinant for CT 2 mm lower (β = -0.65, p<0.001).
The AL showed a significant positive correlation with refraction, but showed a significant negative correlation with SFCT, CT 2 mm nasal, CT 2 mm temporal, CT 2 mm upper, and CT 2 mm lower.
The choroid is primarily a vascular structure supplying the outer retina. Because transient increases in CT are followed by a prolonged decrease in synthesis of extracellular matrix molecules and a slowing of ocular elongation, and attempts to decouple the choroidal and scleral changes have largely failed, it seems that the thickening of the choroid may be mechanistically linked to the scleral synthesis of macromolecules, and thus may play an important role in the homeostatic control of eye growth, and, consequently, in the etiology of myopia and hyperopia (9).
Clinical studies, population-based investigations, and histologic studies have shown a marked thinning of the choroid with increasing axial elongation (24). The mean CT of 250 μm in emmetropic subjects decreased to <30 μm in highly axially myopic patients. This indicates that with increasing axial elongation, the distance between the Bruch membrane and the sclera was markedly decreased (20). Barteselli et al (25) found that the choroidal volume was lower in highly myopic eyes without vitreoretinal or choroidal pathologies than in emmetropic eyes (p<0.001). They also found that choroidal thinning is present in highly myopic eyes compared with emmetropic eyes, and is related to age, AL, and sex.
In a histologic study on the macular region of highly myopic eyes, Jonas et al (24) detected macular regions without Bruch membrane and (consequently) without adjacent RPE and without choriocapillaris. The photoreceptor layer was markedly diminished or rudimentary, as was the remaining choroid, with only a few large choroidal vessels present. In these regions with this secondary macular opening of Bruch membrane, the globe wall consisted of a markedly thinned sclera, some melanin-bearing cells on the inner surface of the sclera (lamina fusca sclerae), and remnants of the middle layer and inner layer of the retina, including the inner limiting membrane.
Further studies are needed to prove whether thickening of the choroid play an important role in the homeostatic control of eye growth, and, consequently, in the etiology of myopia and hyperopia.
Limitations of the study are as follows: it is not a prospective study with follow-up; it is a single center rather than multicenter study; and it has a small sample size.
Conclusion
The CT in different degrees of myopia was thinner than that in normal control eyes, with extreme thinning in advanced myopia. This might be secondary to the longer AL, which is a predictive factor in some locations such as SFCT, CT 2 mm nasal, CT 2 mm temporal, and CT 2 mm lower.
Footnotes
Financial support: No financial support was received for this submission.
Conflict of interest: None of the authors has conflict of interest with this submission.