
Abstract
Purpose
To examine the impact of continuous renal replacement therapy (CRRT) on glucose kinetics and therefore caloric balance.
Methods
In vitro experiments were conducted to characterize glucose kinetics in a variety of CRRT modalities and prescriptions. Additional experiments evaluated the impact of citrate anticoagulation using anti-coagulant dextrose solution A (ACD-A) on CRRT glucose movement. A formula was developed to predict the glucose delivery to/from the patient per day of CRRT, and this data was extrapolated to determine the net caloric impact of CRRT.
Results
A total of 104 experiments were conducted with an overall glucose extraction coefficient of 1.04 (95% CI 1.03-1.05). CRRT-related glucose removal was directly related to effluent (dialysate and/or hemofiltration) rate and pre-filter blood glucose concentration, and inversely related to dialysis solution glucose concentration. In all modalities tested, CRRT resulted in a net negative glucose balance, with estimated caloric losses ranging between 20 kcal and 550 kcal depending on the conditions tested. The addition of ACD-A resulted in net glucose delivery in some conditions and a positive caloric balance of up to 470 kcal per day.
Conclusions
CRRT can have a significant effect on glucose balance and result in either significant daily caloric gains or losses, and this effect can be predicted based on CRRT prescription and patient characteristics. Clinicians should be aware of this potential impact when prescribing nutritional therapy to patients undergoing CRRT, as an imbalance in caloric feeding can adversely affect outcomes in critically ill patients.
Introduction
Blood glucose control and caloric energy balance are important clinical variables that can impact outcomes of critically ill patients (1–5), and guidelines for both areas have been published by clinical societies (2, 6–9). Several factors can influence glucose control, including patient-related factors (eg., infection, trauma, wound healing), route and formulation of nutrition, and medications. In addition, renal replacement therapy (RRT) is an under-recognized factor that has the potential to alter glucose balance and therefore significantly influence both glucose control and overall caloric balance. While some guidelines acknowledge the potential impact of RRT in removing amino acids and water-soluble vitamins, RRT influence on glucose balance has not been addressed (6–10). As a result, most centers do not routinely account for RRT in the nutritional prescription.
Glucose is a small (180 Dalton), water-soluble molecule that does not extensively bind to plasma proteins. These characteristics suggest that glucose can readily cross the hemodialysis filter, and thus dialytic therapy can contribute to either positive or negative glucose balance depending on the prevailing blood:dialysis solution concentration gradient. Clinically, this becomes particularly relevant in critically ill patients with renal failure who are managed with continuous renal replacement therapy (CRRT). Commercially-available CRRT dialysis and replacement fluid solutions vary in glucose content, with the most common options being either 0 or 100 mg/dl concentration (11–13). Since most guidelines suggest a target glucose range of between 140 mg/dl and 180 mg/dl in critically ill patients (2), a significant gradient favoring glucose removal will exist in most patients. Conversely, the use of regional citrate anticoagulation for CRRT continues to gain popularity and many institutions utilize Anticoagulant Citrate Dextrose Solution, Formula A (ACD-A; Gambro, Lakewood, CO, USA) which contains 2.45% dextrose. Given the relatively high infusion rates (typically exceeding 300 ml/h in our institution), the use of ACD-A may serve as a significant unrecognized source of glucose delivery. Therefore the specific prescription of CRRT, including dialysis/replacement fluid concentrations and choice of anticoagulant, will likely affect glucose balance, and clinicians may need to consider these factors in determining the optimal nutritional prescription.
To date, the effect of CRRT on glucose and caloric balance has not been extensively researched. Early studies recognized the potential effect of dialysis on glucose balance and focused on the impact from using glucose-containing replacement fluids (14–18). The replacement fluids in those studies (typically peritoneal dialysis solutions) contained much higher glucose concentrations than the replacement fluids in use today (up to 5000 mg/dl vs. 100 mg/dl), and the CRRT prescriptions are not representative of today's standards. A recent study examined the bioenergetic gain from a specific CRRT prescription using citrate anticoagulation and noted that significant gains could occur secondary to delivery of glucose, citrate, and lactate (19). However, there have been no in vivo or in vitro studies to assess the impact of a broad range of modern CRRT prescriptions on glucose balance.
The purpose of this study was to characterize glucose kinetics during CRRT using an in vitro model in which several different CRRT prescriptions could be assessed. In addition, we sought to examine the influence of ACD-A infusion on glucose balance. Our goal was to incorporate all prescription parameters into a unifying predictive equation for glucose gain or loss during any modality of CRRT.
Materials and Methods
In vitro model
The methods for this in vitro bovine blood CRRT model have previously been described (20, 21). In brief, a Diapact (B. Braun, Bethlehem, PA, USA) CRRT machine and requisite tubing were used. The extracorporeal circuit was assembled and primed according to the manufacturer's specifications with M-150 hemodiafilters (Gambro, Lund, Sweden).
The experiments were performed using pH regulated (pH 7.4) bovine blood (Animal Technologies, Tyler, TX, USA) with 3.8% sodium citrate anticoagulation. The average hematocrit of this blood was approximately 33%. Upon delivery, 5000 units of heparin were added to each liter of blood for additional anticoagulation. The blood was adjusted to an initial glucose concentration of 100 +/- 10 mg/dl, confirmed before each session of therapy using a FreeStyle Freedom glucometer (Abbott, Abbott Park, IL, USA) which is certified to be accurate within the range of 20 mg/dl to 500 mg/dl. Six hundred milligrams of urea were added to each liter of blood as a control solute. The blood was placed in a flask and submerged in a 37°C water bath and continuously stirred. The blood was pumped through the in vitro system for 30 minutes before CRRT began to allow for thorough mixing and uniform protein coating of the tubing and filter membrane (22, 23). Commercially-available Normocarb dialysis solution (Dialysis Solutions Inc., Whitby, ON, Canada) was used to prepare the dialysis and replacement fluid according to the manufacturer's specifications (240 mL of Normocarb solution reconstituted in 3L of sterile water for irrigation). Normocarb dialysis solution is glucose-free and therefore a dextrose solution was added to achieve desired glucose concentrations based upon standard concentration calculations.
The modeled therapy modes were continuous venovenous hemofiltration (CVVH), continuous venovenous hemodialysis (CVVHD), and continuous venovenous hemodia-filtration (CVVHDF). A recirculating model was used in the CVVH arm, in which the ultrafiltrate acted as substitution fluid and was added back to the blood reservoir via postfilter placement in order to maintain constant pre-filter glucose concentration. A single pass model was used for both blood and dialysis fluid in CVVHD and CVVHDF modes. In the CVVH and CVVHDF arms, replacement fluid was infused in a post-filter manner. Post-filter blood was collected in a second flask. When the first (source) flask of blood was emptied, the post-filter flask became the pre-filter reservoir and the empty first flask then acted as the post-filter reservoir. Each time this switch was made, blood glucose was adjusted as needed. This allowed a single-pass model of blood flowing through the circuit with a known, constant glucose concentration. In the CVVHD arm, the ultrafiltration rate was set to zero and no replacement fluid was used. An additional set of CVVHD experiments were performed to assess the influence of ACD-A infusion. In these experiments, glucose-free dialysis solution was used with ACD-A infused pre-filter at a rate of 5 ml/min, consistent with the regional citrate anticoagulation protocol in our institution (24).
The dialysis, replacement and blood flow rates were each adjusted to cover a range of common clinical CRRT prescriptions. Table I provides a description for each of the CRRT operating characteristic variables tested in the study. Each experiment was performed three times and the mean results used.
CRRT Experimental Parameters
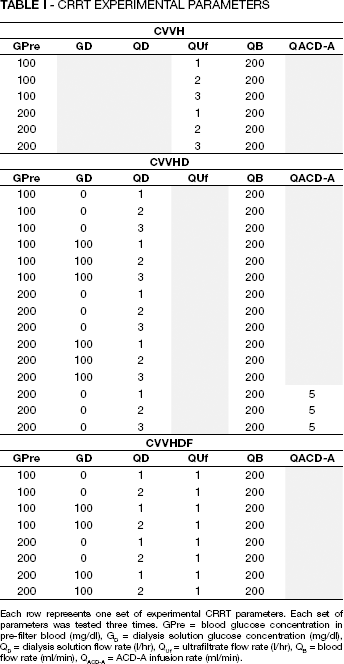
Each row represents one set of experimental CRRT parameters. Each set of parameters was tested three times. GPre = blood glucose concentration in pre-filter blood (mg/dl), GD = dialysis solution glucose concentration (mg/dl), QD = dialysis solution flow rate (l/hr), QUf = ultrafiltrate flow rate (l/hr), QB = blood flow rate (ml/min), QACD-A = ACD-A infusion rate (ml/min).
Assays
Samples consisted of 2 mL of blood taken via syringe from the pre-filter or post-filter sampling ports, post-filter dialysate, and effluent fluid. Blood urea nitrogen (BUN) and glucose concentrations from each blood and effluent sample were analyzed by fluorescence polarization immunoassay with a COBAS Integra 400 Plus (Roche Diagnostics, Basel, Switzerland). The urea and glucose coefficients of variation were <10% and 2%, respectively. The lower limits of detection were 3 mg/dl for urea and 1.98 mg/dl for glucose.
Calculations
The extraction coefficient (EC) of glucose and urea under each set of CRRT operating parameters was calculated using the following equation:

Where Ef = concentration in effluent leaving the dialysis filter and Pre = concentration in the pre-filter blood.
Glucose mass removed by therapy was determined via assay of the effluent. The effluent values were used instead of blood values for two reasons. First, it is a more direct measure of our intended variable – the glucose removed by CRRT therapy. Second, changes in blood glucose are affected by a number of variables, including the hematocrit of the blood and the extent of glucose redistribution from the red blood cells to the plasma. For CVVH, the daily glucose mass removed was simply the product of effluent volume produced per day and the effluent glucose concentration. For CVVHD and CVVHDF therapy, the following equation was used:

Where ΔG = change in glucose mass during time period, GD = glucose concentration of fresh dialysis solution, QD = dialysis solution flow rate, GEf = glucose concentration in effluent, and QUf = ultrafiltrate flow rate.
The caloric implication of glucose removal was determined by:

Where ΔC = change in caloric load and ΔG is expressed in grams. Negative numbers represent glucose and kilocalories removed, while positive numbers represent glucose and kilocalories delivered.
A mass balance calculation was performed to account for all of the glucose in the system using the following equation:
Where ΔM = change in glucose mass balance, GPre = glucose concentration of pre-filter blood, QB = pre-filter blood flow rate, GD = glucose concentration of fresh dialysis solution, QD = dialysis solution flow rate, GPost = glucose concentration of post-filter blood, QUf = ultrafiltrate flow rate, and GEf = glucose concentration of effluent.
Statistical analysis
T-tests were used to compare continuous variables between the different experimental conditions. Linear regression was performed using Microsoft Office Excel 2007 with Data Analysis ToolPak, version 12.0 (Microsoft Corporation, Redmond, WA, USA). The intercepts were not locked at predetermined values. The linear equation for the line of best fit was generated, an R-squared value was calculated to show strength of relationship, and a p-value was calculated for the regression as a whole. A p-value of <0.05 was considered significant.
The glucose removal by CVVH was modeled by the line:

Where m = the slope of the line and b = the vertical intercept of the line. The slower flow rate between blood flow (QB) and effluent flow (QUf in CVVH, QD in CVVHD, or QUf + QD in CVVHDF) is considered the rate-limiting step during renal replacement therapy. For this reason, blood flow, which was much faster than the ultrafiltration flow rate, was excluded from the formula.
In a similar fashion, the glucose removed by CVVHD was modeled by the line:

Because dialysis is a diffusion-based process, the parameter of interest is the concentration gradient between the dialysis solution and pre-filter blood (GPre-GD), not just the pre-filter blood concentration. It should be noted that pre-filter blood glucose here refers to blood immediately pre-filter, which is post-citrate infusion in experiments using citrate. To model CVVHDF, the two previous equations were combined into:

Results
All experiments were run according to the methods: 18 experiments were completed in CVVH mode, 36 experiments in CVVHD, and 24 experiments in CVVHDF. An additional 26 experiments using citrate anticoagulation were completed in CVVHD mode. No problems such as filter failure due to clotting or inadequate effluent production were encountered. The overall mean urea EC was 1.04 (95% CI 1.03-1.05). Similarly, the overall mean glucose EC in the study was 1.04 (95% CI 1.03-1.05). Mass balance analysis indicated that a mean of 95% (95% CI 95%-96%) of the glucose was accounted for (recovered in blood, effluent or unused dialysis solution) in the study as a whole.
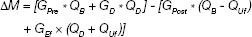
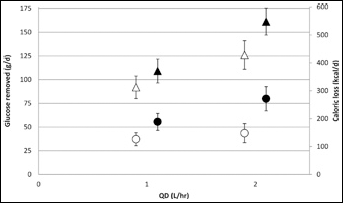
In the CVVH experiments, net glucose loss rose with increasing hemofiltration rate and increasing pre-filter blood glucose (Fig. 1). Assuming a glucose-free replacement fluid, net glucose balance related to CVVH ranged from approximately −30 g per day to −160 g per day (caloric equivalent −100 kcal per day to −550 kcal per day) under the experimental conditions tested, with a negative number indicating net loss. The addition of a replacement fluid containing 100 mg/dl of glucose would result in the glucose balance ranging from approximately −6 g to −90 g per day.
Glucose and kilocalories removed per day by in vitro continuous venovenous hemofiltration (CVVH) as a function of filtration rate and by pre-filter blood glucose concentration. Circles represent data from experiments using pre-filter blood glucose concentration of 100 mg/dl; triangles represent data using pre-filter glucose concentration of 200 mg/dl. QUf = hemofiltration rate. Error bars represent 95% confidence interval.
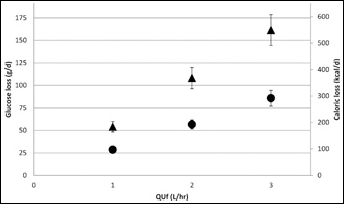
In the CVVHD experiments, net glucose loss was noted under all conditions tested (Fig. 2). Greater loss was associated with increasing dialysis solution flow rate and greater glucose concentration gradient between blood and dialysate. Total daily glucose balance ranged from −6 g per day to −160 g per day (-20 kcal to −550 kcal per day). Similar relationships were observed in the CVVHDF experiments (Fig. 3), and once again net glucose loss was observed under all conditions tested.
Glucose and kilocalories removed per day by in vitro continuous venovenous hemodialysis (CVVHD) as a function of dialysis solution flow and by pre-filter blood and dialysis solution glucose concentrations. Circles represent data from experiments using pre-filter blood glucose concentration of 100 mg/dl; triangles represent data using pre-filter glucose concentration of 200 mg/dl; filled shapes represent data from experiments using dialysis solution glucose concentration of 0 mg/dl; unfilled shapes represent data using dialysis solution glucose concentration of 100 mg/dl. QD = dialysis solution flow rate. Error bars represent 95% confidence interval.
Glucose and kilocalories removed per day by in vitro continuous venovenous hemodiafiltration (CVVHDF) as a function of dialysis solution flow rate and pre-filter and dialysis solution glucose concentrations. Hemofiltration rate was fixed at 1 l/h. Circles represent data from experiments using pre-filter blood glucose concentration of 100 mg/dl; triangles represent data using pre-filter glucose concentration of 200 mg/dl; filled shapes represent data from experiments using dialysis solution glucose concentration of 0 mg/dl; unfilled shapes represent data using dialysis solution glucose concentration of 100 mg/dl. QD = dialysis solution flow rate. Error bars represent 95% confidence interval.
The CVVHD experiments involving regional citrate anticoagulation with ACD-A found that net glucose balance ranged from −35 g to +140 g per day (-120 kcal to +470 kcal per day) (Fig. 4). In this model, net caloric balance was again inversely related to dialysis solution flow rate and the glucose concentration gradient.
Based on the results of this study, a linear regression model for net daily caloric balance was developed: y = 0.81[QD × EC × (GPre-GD) + QUf × EC × GPre] + 4.16, where y is the number of kilocalories removed per day (R-squared >0.999). This unifying model can be applied to any CRRT modality.
Discussion
A derangement in caloric balance, characterized by either underfeeding or overfeeding, can contribute to poor outcomes in critically ill patients (3–5). Published guidelines provide recommendations for prescribed caloric delivery in this population, yet the potential glycemic impact of CRRT has not been addressed (6–9). We have performed a set of in vitro experiments to quantify the potential glycemic impact from a wide range of common CRRT prescriptions. Our results suggest that the impact of CRRT on glycemic (and therefore caloric) balance can be profound and therefore has the potential to influence clinical outcomes.
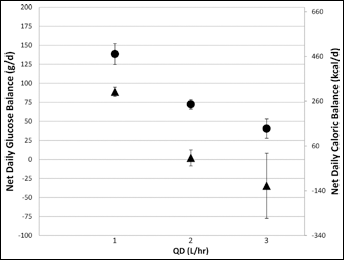
Net glucose and caloric balance per day during in vitro continuous venovenous hemodialysis using citrate anticoagulation with ACD-A. Positive values indicate glucose delivered, negative values indicate net glucose removed. ACD-A infusion was fixed at 5 ml/min and dialysate dialysis solution was glucose-free. Circles represent data from experiments using pre-filter blood glucose concentration of 100 mg/dl; triangles represent data using pre-filter glucose concentration of 200 mg/dl. QD = dialysis solution flow rate. Error bars represent 95% confidence interval.
While previous studies have observed the potential impact of glucose removal or delivery from CRRT (14–18), these studies were largely conducted in an earlier era of CRRT and may not be applicable to current prescriptions. In one of the earliest reports, Sigler and colleagues examined solute movement in critically ill patients undergoing continuous arteriovenous hemodialysis (CAVHD) and observed an average positive glucose balance of 154 g/day (18). However, the dialysate used had a glucose concentration of 1300 mg/dl, and the mean EC was reported to be only 0.45. Similarly, Bellomo and colleagues found net glucose uptake during CAVHD and reported glucose EC values ranging from 0.37 to 0.52 (14). We observed an overall mean glucose EC of 1.04, indicating free glucose passage across the hemodiafilter membrane by either diffusion or convection. This higher EC compared to earlier studies can be accounted for by the higher dialysate glucose concentrations used in the earlier studies, as well as potentially by improved solute movement using newer high-flux filter membranes. In a more recent study, Schneditz and colleagues examined the impact of intermittent hemodialysis on glucose balance and found that extracorporeal therapy accounted for approximately 40% removal of an intravenous glucose load (25).
As an in vitro study, we cannot draw any firm conclusions regarding the clinical impact of CRRT-related glucose delivery or removal. However, the potential caloric impact can be substantial and is presently clinically unrecognized in our experience. For example, in a patient with a blood glucose level of 200 mg/dl undergoing CVVHDF at QB 200 ml/min, QD 2 l/h, and QUf 1 l/h with dextrose-free dialysis and replacement fluid, our results suggest a daily loss of 161 grams of glucose (548 kilocalories). In a 70 kg, 170 cm tall, 50 year-old male with a basal energy expenditure of 1555 kcal/d via the Harris-Benedict equation (26), this loss would represent one third of his basal energy expenditure, and at least 25% of his recommended nutritional intake (8, 9). Clinicians should consider the influence of CRRT when setting the nutritional prescription; conversely, the CRRT prescription can be adjusted to better fit an individual patient's nutritional goals. Balik and colleagues recently conducted a clinical study in patients undergoing CVVHDF using citrate anticoagulation (19). They determined that significant bioenergetic gains could occur related to the CRRT prescription, supporting the application of our results to the clinical setting. Further studies are required to confirm our findings in the in vivo setting. Ideally, clinical studies are needed to determine whether adjusting the nutritional prescription to account for CRRT beneficially impacts clinical outcomes.
In contrast to the other CRRT prescriptions tested, the in vitro model of regional citrate anticoagulation found that a significant net positive glucose caloric balance was possible when using the dextrose-containing formulation ACD-A. Under certain conditions, specifically with slower effluent flow rates and larger glucose concentration gradients, this impact exceeded 300 kcal to 500 kcal per day in our study, which may represent >20% of a critically ill patient's recommended daily caloric intake (8–10). Of note, these experiments were conducted using a fixed infusion rate of citrate and a glucose-free dialysis solution. In clinical situations where the citrate infusion rate may be titrated upward and/or in which a glucose-containing dialysis solution is used, the positive caloric impact (and therefore the risk of overfeeding) will be even greater. For this reason, we advocate for consideration of a glucose-free dialysis or replacement fluid to mitigate some of the caloric impact when utilizing ACD-A based anticoagulation.
We found that the removal of glucose via CRRT can be highly predictable with a single equation that accounts for all CRRT parameters regardless of modality. Such an equation could be clinically useful when determining the caloric balance and therefore nutritional prescription of a critically ill patient on CRRT. However, this equation requires a measurement of glucose EC, which may vary to a slight degree based on CRRT prescription as observed in our study. Use of the mean EC of 1.04 would result in very little loss of accuracy based on our overall findings, but further in vivo studies are required before this equation can be applied at the bedside.
The present study has a number of limitations to consider. The current study only investigated two blood glucose concentrations, 100 mg/dl and 200 mg/dl. Based on current guidelines (2), we would expect the majority of critically ill patients to have blood glucose levels within this range, although concentrations outside of these tested values could certainly be encountered. Notably, the citrate experiments resulted in blood glucose concentrations of 169 mg/dl to 315 mg/dl immediately pre-filter, and glucose loss in these experiments remained highly predictable, suggesting that the predictive equation may extend to patients with higher blood glucose concentrations. The results of this study are applicable within the parameters evaluated, and may not necessarily be extrapolated to prescriptions outside these parameters. For example, patients undergoing high-dose CVVHD may have a significant drop-off in glucose EC. Conversely, pediatric patients typically require much slower blood flow rates and blood flow may become the rate-limiting step for solute removal via CRRT. Lastly, the results of this study require clinical confirmation and further in vivo studies are required before the findings of this study can be routinely applied to the clinical setting.
Conclusions
We present a comprehensive analysis of glucose kinetics using modern CRRT prescriptions, and we have characterized the relationship between glucose removal/delivery and the components of each modality of CRRT. In most situations, CRRT has a net negative influence on caloric balance. Conversely, use of anticoagulation based on ACD-A can result in significant caloric delivery. Clinicians should be aware of the potential impact that CRRT can have on caloric balance, and clinical studies are needed to determine the optimal approach to adjusting for this impact.