






Abstract
Background/Aims
The dialysis delivered dose is limited by the rate at which urea can be transferred from the different body compartments. The time needed to clear the peripheral compartments of the body has been called the patient clearance time (tp). The aim of the study was to compare delivered dialysis dose using the tp index between patients dialyzed through a permanent central venous catheter (CVC) and patients with an arteriovenous fistula (AVF).
Methods
The study included 48 stable hemodialyzed patients. Patients were classified into two groups according to their vascular access type. The first group included 24 patients dialyzed through a permanent CVC and the second group consisted of 24 patients with a mature AVF. The following parameters were calculated twice for each patient: tp, Kt/V adjusted for the tp.
Results
tp was lower in the AVF dialysis modality than in CVC (26 ± 7 vs. 42 ± 14 min, p<0.001) while the (eqKt/V)tp was higher in AVF than in CVC dialysis (1.36 ± 0.11 vs. 1.19 ± 0.13, p<0.001).
Conclusions
The patient clearance time is lower in AVF than in CVC dialysis, and this is accompanied by a higher delivered dialysis dose.
Keywords
Introduction
The outcome of patients treated by hemodialysis (HD) is influenced by the delivered dose of dialysis (1). At present, the adequacy of HD is usually evaluated by determining Kt/V (single or double pool kinetic model), a practical, reproducible and reliable index for quantifying the dialysis dose (2, 3) that can easily been modified by altering dialysis time and clearance rate. The Kt/V concept allows prospective predictions and planning of the dialysis delivered dose. However, HD efficiency is limited by the rate at which urea can be delivered from the different body compartments. This rate depends on cardiac output, blood flow in the different body regions (regional blood flow rate), and the rate of diffusion across cell membranes (intra/extracellular mass transfer coefficient) (4). Moreover, the characteristics of urea, which allow the molecule to be carried into the central circulation by venous blood flow, pumped into the aorta by the heart, and then carried to the needle by the fistula blood flow are additional factors affecting HD efficacy. Mathematics describing these effects are similar and can be simplified to a single time constant which is called patient clearance time (tp) (4, 5). This time represents both inter-compartment transfer and cardio-pulmonary recirculation, and, thus, is the time needed to clear all parts of the body when dialyzer clearance is infinite (eqKt/V = 1). It is equal to the mean of the ratios of the inter-compartment solute mass transfer rate (flow rate or diffusion coefficient) to the volume of the peripheral compartments (4, 5). Otherwise, in practice the tp index represents the time (in min) we have to modify the usually prescribed HD duration in order to minimize the effect of the post-dialysis rebound phenomenon on dialysis efficacy. In the literature, tp has a value of approximately 30 min (4). In addition, the tp is independent of the dialyzer clearance, is reproducible, and is also relatively constant between patients (4, 5). The aim of the study was to compare the delivered dialysis dose using the tp index between patients dialyzed through a permanent central venous catheter (CVC) and patients with an arteriovenous fistula (AVF).
Patients and Methods
Patients
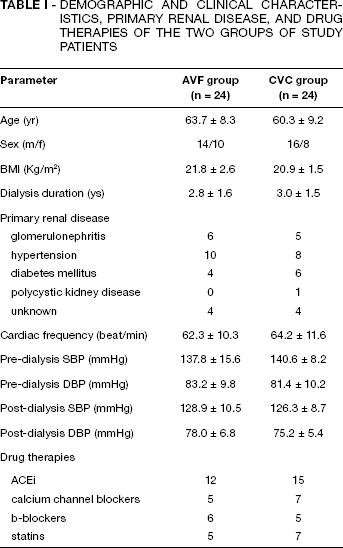
A total of 48 stable, chronic HD patients, 32 males and 16 females, were studied. Their median age was 56 years (range 37-73). The exclusion criteria were a history of liver or heart failure (stage IV New York Heart Association (NYHA)), active infection, hospitalization within the previous 30 days, hypoalbuminemia (serum albumin <35 g/l), active malignancy, and drugs affecting the urea metabolism. Patients known to have circulating antibodies to the hepatitis B surface antigen or to the human immunodeficiency virus (HIV) were excluded a priori. The primary chronic renal diseases were glomerulonephritis (23.8%), hypertension (37.5%), diabetes (20.8%), polycystic kidney disease (1.8%), and unknown (16.2%) (Tab. I).
Patients were classified into two groups matched for age and sex according to their vascular access type. The first group included 24 patients who were dialyzed through a permanent CVC and the second group consisted of 24 patients with a mature AVF. The recirculation fraction for all the AVFs was <5%, which was calculated by the slow flow method (3). Patients’ blood pressure and heart rate were recorded pre-dialysis and post-dialysis but also during the dialysis session (at 30-minute intervals) (Tab. I). Needles of 2.5 cm in length and two different sizes (15 and 16 G) were used. The sequence of the different needle combinations was established at random. A permanent double lumen CVC (right jugular, 19 pts; right/left subclavian, 5 pts) was used in the study. The type of the CVC used was the Tesio twin dialysis catheter system (Medcomp, Harleysville, PA, USA), which consists of two 10 F, 40 cm silicone catheters with Luer-Lock, color-coded removable hubs. Side holes are located in a spiral configuration over the distal 3.5 cm of the catheters. A Dacron subcutaneous tunnel cuff is fixed 22 cm from the intravascular tip of each catheter. Removable hubs allow shortening of the catheters outside the tunnels. Poorly mechanically functioning catheters were excluded from the study (blood flow less than 200 ml/min and venous pressure more than 150 mmHg). The study was approved by the local Ethics Committee and patients participated in the study after being informed and signing a formal consent.
Demographic and Clinical Characteristics, Primary Renal Disease, and Drug Therapies of the Two Groups of Study Patients
Methods
All patients received a 4 h conventional HD, 3 times/week. Food or fluid intake was restricted during the HD sessions. Residual urine volume was less than 200 mL during 44 h (short inter-dialytic interval between dialysis sessions). All calculations (n = 96) (twice for each patient), described later, were performed in the midweek HD session. Total effluent dialysate fluid (Vd) was collected in a volumetric big tank (40 L capacity) that was recalibrated on a scale. The effluent dialysate was collected in hourly aliquots to take advantage of the increased accuracy and precision made possible when measuring the higher solute concentrations early in dialysis. Because the contamination of bicarbonate dialysate is well documented (6) and can result in an underestimation of urea removed, samples were filtered through a 0.22 μ filter before being placed in sterile, plastic tubes. The whole blood urea clearance (KmDDQ) and urea distribution volume (VmDDQ) were calculated according to the mDDQ method (7).
Dialysis procedure
In all patients, HD was performed using Gambro AK 200 S hemodialysis (Gambro, Lund, Sweden) machines and low-flux polysulfone dialyzer (Fresenius Fx-10, surface area of 1.8 m2; Fresenius Medical Care, Bad Homburg, Germany). Blood and dialysate flow rate was set at 300 ml/min and 500 ml/min, respectively. Dialysate composition was: Na+ 132 mmol/l, Cl− 103 mmol/l, K+ 2 mmol/l, Ca2+ 1.25 mmol/l, Mg2+ 0.75 mmol/l, acetate 5 mmol/l and bicarbonate 35 mmol/l.
Blood/Dialysate samples
Blood samples for measuring urea relating parameters were taken from the arterial needle before the initiation of HD (C0); at the end of the treatment; immediately post dialysis (Ct); and 30 min (Ctcorr) and 60 min post-dialysis (Ceq) from the arterial needle. The slow-flow method was applied after the first 30 min of the HD session at the prescribed blood flow rate (300 ml/min) for the two dialysis modalities (AVF and CVC) (8, 9). Blood samples from the arterial (CA) and venous (CV) ports were taken simultaneously. The blood pump was then lowered to 50 ml/min for a 30 s period (CVC modality), after which another blood sample was drawn from the arterial port (CA 30 ), replacing the traditional peripheral sample (10, 11). For the AVF modality, the blood pump was lowered to 50 ml/min for a 120 s period, after which another blood sample was drawn from the arterial port (CA120) (10, 11).
Dialysate samples were taken from the total dialysate fluid volume spent at the end of the HD session, after an effective fluid mixing procedure (mechanical stirring by electrical equipment inside the tank) the urea concentration was measured (Cd). Values of serum urea (sUrea) in the blood samples and serum total proteins (sTP) were assessed pre- and post-HD session. These parameters were measured by photometric methods (Olympus AU 600; Olympus, Center Valley, PA, USA).
Calculations
Values for tp (min) were calculated from t, C0, Ct, and Ceq using the equation (12):

where, t (min) dialysis duration treatment, C0 Ct, and Ceq serum urea concentration (mmol/l) pre- and post-HD session and 60 min post-dialysis, respectively. Values were calculated independently for each patient during the AVF and CVC dialysis procedure.
The spKt/V values were calculated using the equation (13):

where, R Ct/C0 ratio, t (h), UF (L) ultrafiltration, Wt (kg) dry body weight.
The dpKt/V values were calculated using the equation (14):

where, t (hours) dialysis duration treatment.
The Kt/VmDDQ was calculated according the following equation (7):

where, KmDDQ (ml/min) the whole body urea clearance (ml/min), VmDDQ the urea post-HD distribution volume (mL)

and

where, V = volume of post dialysis urea distribution (ml),
R = total urea removal in dialysate (mmol),
t = duration of the dialysis treatment (min),
G = urea generation rate (mmol/min),
UF = ultrafiltration volume (ml),
0.93 = the multiplier to transform serum to be plasma water concentration,

where, WTG = interdialytic weight gain (g)
tid = interdialytic interval (min),
Ceq = previous 30-minutes post HD estimated from urea rebound of current dialysis (mmol/l).
Correction of the error in single pool Kt/V using the tp (eqKt/V)tp was calculated (using the results from Eqs. 1 and 2) by the equation (12):

Re-prescribed dialysis time (t*) is the time needed to modify the initially prescribed dialysis time, taking into account the tp values, in an effort to achieve a desirable eqKt/V. It was calculated (using the results from the equations 1, 5, 6, 8) by the following equation (12):

where, VmDDQ (mL) urea post HD distribution volume, KmDDQ (ml/min) whole body effective urea clearance.
Recirculation fraction (RF, %) was estimated by the equation (11):
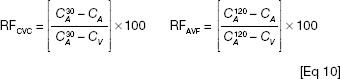
where, CA, CV, serum urea concentrations from arterial and venous port during HD (30 min after the HD initiation), and CA 30 , CA120 serum urea concentrations at 30 and 120 s after the occurrence blood flow of reduction at 50 ml/min, respectively.
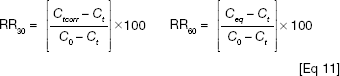
The redound rate (RR, %) at 30 min and 60 min post dialysis, in both cases, was calculated using the formula (15):
Statistical analysis
All analyses were carried out using SPSS® 17.0 statistical package for Windows® (SPSS Inc, Chicago, IL, USA). All data are expressed as mean values ± standard deviation (SD). Comparisons of variables between groups were performed using the x 2 test with continuity correction, parametric (t-test, one way ANOVA) and non-parametric statistical tests as appropriate (Mann-Whitney-Wilcoxon and Friedmann tests). A p<0.05 was considered statistically significant. All p values were two-tailed. Carryover effect was tested using values at the beginning of each session for each dialysis modality.
Results
The demographic characteristics, primary renal disease, clinical parameters, and drug therapies of the two groups are shown in Table I. The mean, pre-dialysis hematocrit was 33.6 ± 3.9% for the AVF group, and 34.7 ± 2.4% for the CVC group (p = ns), while the post-dialysis hemocrit was 35.2 ± 1.8 and 36.1 ± 1.1%, respectively (p = ns). The pre-dialysis values of serum urea were 70.2 ± 5.6 and 67.5 ± 6.7 mmol/l for CVC and AVF, respectively (p = ns), while the inter-dialytic (44 h interval between dialysis sessions) body weight gained was approximately 2.2 kg (median value) in all patients. There were no statistically significant fluctuations in arterial pressure (no need of i.v. saline supplementation) during all the HD sessions studied.
Factors involved in dialysis dose
Urea distribution volume (VmDDQ)
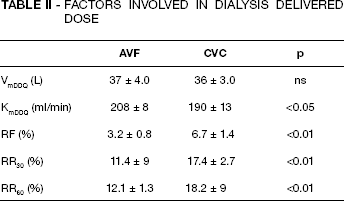
The post-dialysis urea distribution volume of the patients was approximately equal, as expected, in the two dialysis modalities. In particular, the VmDDQ was 37 ± 4.0 L for AVF and 36 ± 3.0 L for CVC dialysis modality (p = ns) (Tab. II).
Factors Involved in Dialysis Delivered Dose
Effective dialyzer urea clearance (KmDDQ)
The KmDDQ for urea was higher for AVF (208 ± 8 ml/min) than for CVC (190 ± 13 ml/min) dialysis modality (p<0.05), which is accompanied with a better dialysis delivered dose (Tab. II).
Recirculation fraction (RF)
The RF of urea was statistical significant lower for AVF (3.2 ± 0.8%) compared with CVC (6.7 ± 1.4%) dialysis modality (p<0.01) (Tab. II).
Rebound rate (RR)
The urea RR was significantly greater in the CVC dialysis in comparison with AVF dialysis in both post dialysis times (RR30 and RR60) that were calculated (17.4 ± 2.7 vs. 11.4 ± 29.0%, and 18.2 ± 9.0% and 12.1 ± 1.3%, p<0.01, respectively (Tab. II).
Dialysis duration treatment
tp values
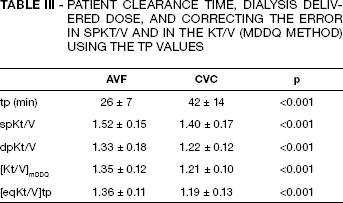
The tp measurements during the AVF dialysis modality were significant lower (26 ± 7 min) than during CVC modality (42 ± 14 min) (p<0.001) (Tab. III).
Patient Clearance Time, Dialysis Delivered Dose, And Correcting The Error In Spkt/V And In The Kt/V (Mddq Method) Using The Tp Values
Dialysis delivered dose
The dialysis delivered dose, calculated using the Daugirdas equations (first-and second-generation), for spKt/V was 1.52 ± 0.15 and 1.40 ± 0.17 for AVF and CVC, respectively (p<0.001), while for dpKt/V it was 1.33 ± 0.18 and 1.22 ± 0.12 for AVF and CVC, respectively (p<0.001) (Tab. III). Also the eqKt/V, calculated using the tp values (correction of the error in the single-pool Kt/V (spKt/V)), was 1.36 ± 0.11 and 1.19 ± 0.13 for AVF and CVC, respectively (p<0.001) (Tab. III).
Prescribing dialysis time (t*)
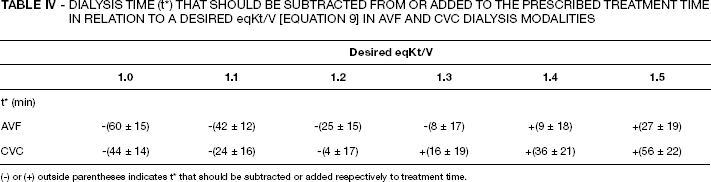
The t* values were calculated taking into consideration the rebound (Eq. 9). Values are shown in Table IV for any desired (eqKt/V)tp, as this was calculated from tp, in a range from 1.0 to 1.5. Our results showed that the t* value which should be deducted or added for a desired (eqKt/V)tp ≥1.2 is higher in the CVC dialysis modality than in the AVF dialysis schedule.
Dialysis Time (t*) That Should Be Subtracted From Or Added To The Prescribed Treatment Time In Relation To A Desired eqKt/V [EQUATION 9] In Avf And Cvc Dialysis Modalities
(-) or (+) outside parentheses indicates t* that should be subtracted or added respectively to treatment time.
Discussion
In the present study we examined the influence of the vascular access type on the dialysis delivered dose. Results of our study demonstrated that the patient clearance time is higher when a permanent CVC was used as vascular access instead of an AVF. The practical significance of our results is the fact that the duration of the dialysis treatment needs to be increased in both dialysis modalities that we studied (approximately 30 min for AVF and 45 min for CVC) if the target is a desired and acceptable eqKt/V >1.2. Conversely, the treatment time needs to be decreased if a less efficient dialysis (eqKt/V ≤1.2) is preferred. Our results for tp were comparable with the results reported by Tattersall et al (12). Moreover, the dialysis delivered dose was more efficient in the AVF than in the CVC dialysis modality. Finally, AVF dialysis was characterized by less recirculation and a lower rebound rate compared with CVC dialysis. These results support the advantage of a well functioning AVF over a CVC as the first choice for permanent vascular access for dialysis. Our CVC dialysis results are in agreement with the results from previous studies (10, 11).
As previously mentioned, the tp represents both the inter-compartment urea transfer and cardio-pulmonary recirculation (5). However, although the blood-based urea kinetic model (UKM) permits estimation of the urea distribution volume (V), various confounding factors may cause differences between the true distribution volume and that measured by the UKM. During HD, three principal mechanisms are likely to contribute to an effective multi-compartmental distribution of urea, namely, access recirculation, cardiopulmonary recirculation, and distribution of urea between intra-and extracellular and /or low and high blood flow regions (16). The result of the individual action of each mechanism is the reduction of dialysis efficacy by lowering the intra-dialytic serum blood urea profile. After HD, the serum urea level will rebound with different time scales, over a period of approximately 10 s for access recirculation (16), over a period of 2 min for cardiopulmonary recirculation typically (17), and over a period of 30 to 60 min for the compartmental effects (18, 19).
Access recirculation does not normally occur during HD. Previous studies have demonstrated that the recirculation is almost absent in a well-functioning peripheral vascular access (20–23). In the case of AVF (with cardiopulmonary recirculation), it occurs when a proportion of the blood returning to the patient in the venous line is immediately drawn into the arterial needle and dialyzed again without leaving the fistula. The placement of the arterial needle downstream of the venous needle or the incorrect placement of the needles, the situation in which extracorporeal blood flow rates exceeds the blood flow rate in the fistula and vascular access stenosis are among the factors contributing to the augmentation of access recirculation (24) above the upper acceptable limit, which is set at less than 5% (3). Recirculation effectively reduces the solute concentration of blood entering the dialyzer by diluting it with “clear” blood, reduces the mass of solute removed (whole body clearance) (25) without any influence on the dialyzer clearance (24). Obviously, a high recirculation fraction is accompanied by a high rebound rate, factors known to influence the dialysis delivered dose (26).
The HEMO study showed that the CVC group had lower recirculation and rebound values due to the absence of cardiopulmonary recirculation. Although our results seem to contradict the results of Daugirdas et al (26), in reality, since the two studies exhibit significant differences, a comparison between them risks arriving at erroneous conclusions. Some of the differences concern study design. Our study was prospective and had two numerically identical, well-matched patient groups. The duration of the dialysis session in our study was 4.0 h instead of 4.5 h in the HEMO study, in which the authors did not give any information on catheter performance. However, in the case of CVC (without cardiopulmonary recirculation), the percentage of the recirculation fraction depends not only on the catheter position but also on events such as eddy currents caused by turbulent flow, clotting at the tip of the catheter, reversal of flow in the sub-clavian venous catheter during atrial systole, sheathing of the catheter with fibrin that might create a pathway from outflow to inflow, and positive pressure ventilation (27). Moreover, the cardiac rhythm plays an important role in the recirculation phenomenon. The intermittency of blood flow in the central veins is probably the key reason for the higher recirculation observed in CVC dialysis modalities compared to AVF. Superior vena cava flow varies over the cardiac cycle, with flow transiently stopping just before ventricular systole (28). Indeed, Doppler studies show that blood flow actually reverses transiently during the cardiac cycle following the p wave (29).
Cardiopulmonary recirculation, i.e., the fractional amount of blood that reaches the venous district of the body and right heart chambers without passing through the peripheral capillaries compartment, has a small and predictable effect on dialysis efficiency. There is no need for it to be considered as a routinely measured parameter in patients without heart failure, as it is not involved in the dialysis delivered dose.
Urea rebound (excluding access and cardiopulmonary recirculation), is the third type of recirculation that has been defined as “intracorporeal recirculation.” Schneditz et al (29–31) reported a regional blood flow model (RFM) as an alternative to the two-pool model. This model can establish the missing link between hemodynamics and solute removal. In the RFM model, in an effort to explain intracorporeal recirculation, peripheral urea distribution districts are divided into a high and a low perfusion flow system. Thus, solute sequestration is higher in low perfusion flow areas than in high perfusion areas, which leads to the lower solute clearance of these compartments. The final result will be disequilibrium between the serum and tissue concentrations, with artificially low concentrations in the systemic blood that represent a sort intracorporeal recirculation. In fact, as long as the blood compartment is not refilled with urea due to poor perfusion of certain districts, the cleared volume appears with artificially low urea levels. Factors involved in the RFM are race and age, diabetic status, blood pressure and fluid removal, although other reasons that may contribute to post-dialysis urea rebound cannot be excluded.
Based on the considerations discussed in this paper, the tp value appears to be a convenient, clinical tool for quantifying inter-compartment solute transfer in dialysis patients. Unlike other approaches, tp can be calculated directly from the time and urea concentrations. It makes no assumptions as to the mechanism of the inter-compartment transfer (diffusion or blood flow). There is no need to measure parameters such as V, K, the cardiac index, or the inter-compartment mass transfer rate. Moreover, the tp index is independent of the rate and duration of dialysis. Using the tp index, we can override the disequilibrium between the intra-extracellular compartments, aiming for a more real and acceptable dialysis deliver dose.
In conclusion, patient clearance time is lower in AVF dialysis than in CVC dialysis, and is accompanied by a higher delivered dialysis dose. The tp is a useful tool in everyday clinical practice for an equilibration between the prescribed and delivered dialysis dose.