






Abstract
Background
The aim of our study was to analyze, in a pig model of prolonged ventricular fibrillation (VF) treated by veno-arterial extracorporeal membrane oxygenation (ECMO), the time dependent changes of VF wavelet frequency obtained from intracardial signals and its relations to return of spontaneous circulation (ROSC).
Methods
11 female pigs (50.3 ± 3.4 kg) under general anesthesia had undergone 15 min of VF with ECMO flow of 5 to 10 ml/kg per min simulating “untreated” VF followed by continued VF with full ECMO flow of 100 ml/kg per min. The median frequency (MF) of VF from right ventricular apex, coronary perfusion pressure, myocardial oxygen metabolism and resuscitability were determined.
Results
Median (interquartile range) of MF of fibrillatory wavelets in minute 15 of low ECMO flow [9.7 Hz (8.3; 10.1)] was not significantly changed in comparison to minute 1 [10.5 Hz (9.8; 12.4)], p = 0.12. Five minutes after full ECMO initiation MF increased [11.6 Hz (10.6; 13.5)], p = 0.04 (compared to minute 15 of VF) and did not deteriorate during the rest of ECMO treatment. Out of all subjects, three animals did not reach ROSC. Those subjects demonstrated deeper decrease of MF at the VF minute 15 as compared to others [-2.4 Hz (-2.5; −2.3) vs. −0.6 Hz (-1.6; −0.1)] and continuously significantly higher increase in MF on full ECMO support [4.3 Hz (2.9; 5.6) vs. 1.1 Hz (0.6; 1.6)] with p = 0.05 for both observations, respectively.
Conclusions
The veno-arterial ECMO reperfusion influences MF of VF wavelet obtained from right ventricular apex. The course of changes in wavelet frequency corresponds to a presence of later ROSC.
Introduction
Ventricular fibrillation (VF) is recognized to be the initial rhythm in approximately 30% of non-traumatic sudden death events (1). The effect of various VF analysis strategies, including VF wavelet frequency based parameters, has been investigated in prediction of countershock success (2–10). It has been shown that duration of VF, effectiveness of cardiopulmonary resuscitation (CPR) (2, 11–14) or administration of vasopressors (15, 16) can cause changes in the power spectrum of the VF wavelet frequency with an attendant chance for return of spontaneous circulation (ROSC) rate (2, 11–16).
Extracorporeal membrane oxygenation (ECMO) is increasingly used in adult cardiac arrest (CA) of any rhythm (17–25). This approach is aimed to sustain vital organ perfusion during CA to provide time span for diagnosis and therapy (23). Recently, the impact of different veno-arterial (V-A) ECMO settings on brain and coronary perfusion was described by our team in a pig model of prolonged VF (26). However, no research focused on analysis of intracardially recorded VF wavelet pattern during simulated prolonged CA treated by ECMO is available.
Therefore, the aim of our current analysis was to identify the time-dependent changes of VF wavelet frequency in a pig model of prolonged VF treated by V-A ECMO. We hypothesized, that ECMO reperfusion and ECMO related changes of coronary perfusion might influence the VF wavelet pattern and occurrence of ROSC.
Methods
The protocol was approved by the Charles University First Medical School Institutional Animal Care and Use Committee and performed at the Animal Laboratory, Department of Physiology, First Medical School, Charles University in Prague, in accordance with Act No 246/1992 as amended, Collection of Laws, Czech Republic, which is harmonized with EU Directives 86/609/EEC as amended, 2007/526/ES, 2010/63/EU.
Study protocol
The current study was a part of a project on the hemodynamic and metabolic aspects of V-A ECMO in prolonged VF. The protocol used in this study has been described in detail previously (26) and is outlined in Figure 1. Briefly, 12 female pigs (Sus scrofa domestica), crossbreed (Landrace x Large white), body weights 50.3 ± 3.4 kg were used.

Study protocol outline, for explanation see text. Vertical bars on upper horizontal line represent 15 min intervals for respective measurement periods. The numbers on upper horizontal line indicate the ECMO flow. The lower horizontal dotted line indicates the phase of ECMO analysis.
Following induction of anesthesia and orotracheal intubation (O.D. 7.5 mm), an ECMO circuit was connected. The cannulation was randomly assigned either as femoral vein - femoral artery (FF) or femoral vein - subclavian artery (FS). Following placement of ECMO, a standard 30 mL intraortic balloon counterpulsation (IABP) balloon (Arrow International, Reading, PA, USA) was placed in the descending thoracic aorta. A diagnostic decapolar 6-Fr non-steerable catheter with 2-8-2 mm spacing (Response CSL, St Jude Medical, St Paul, MN, USA) was transvenously advanced into the right ventricle apex. After the initial stabilization, both IABP and ECMO in FF and FS settings were set to adjust the best possible augmentation and to exclude any technical problems.
VF was induced by the high frequency burst method. Animals were not ventilated during first experimental phase (ECMO_LOW) when basal ECMO flow (5-10 ml/kg per min to avoid ECMO circuit thrombosis) was continued. After 15 min of VF the assigned ECMO regimen with target flow of 100 ml/kg per min (ECMO_MAX) was initiated in all animals irrespective of the cannulation.
At the same time, inspired oxygen fraction on ECMO was adjusted to maintain pO2 and pCO2 in ranges of 10 kPa to 15 kPa and 4.5 kPa to 5.6 kPa in blood leaving the oxygenator, respectively. After finishing the respective ECMO interval of 15 min, IABP was initiated in an internal mode of 100/min for the next 15 min. Then, the ECMO circuit was switched from the initial configuration to the alternative configuration (initial FF setting to FS and initial FS to FF). After the next 15-minute interval, IABP was initiated in the same mode for the last 15 min. Biphasic defibrillation with 270 J (TEC-550; Nihon Kohden, Japan) and advanced CPR was performed according to ERC Guidelines (27) until ROSC was achieved or the animal died.
Thereafter, surviving animals were euthanized by morphine and propofol overdose followed by intravenous potassium chloride 1 mmol/kg.
VF wavelet signal analysis
The electrophysiological system (Boston Scientific, Natick, MA, USA) was used to record and store intracardial signals at a sampling frequency of 977 Hz with voltage resolution of 0.001 mV. Analysis was performed in continuous 10-second segments (one segment per measurement) of ventricular electrograms (single bipolar signal from right ventricular apex) that were exported and analyzed. The analysis was performed in defined time points: at min 1 and 15 of low-flow ECMO (ECMO_LOW 1 and 2, respectively), and at min 5, 15, 30, 45, 60 during ECMO flow of 100 ml/kg per min (ECMO_MAX 1, 2, 3, 4 and 5, respectively). All segments were carefully visually inspected for technical artefacts. The signal was filtered between 2 Hz and 48 Hz to exclude low-frequency artefacts and minimize ambient noise. Next, signals were converted from time to frequency domain by fast Fourier transformation. Median frequency (MF) was defined as frequency at which half of the power of the spectrum is below and half above. The data were compared to coronary perfusion pressure (CoPP), level of lactate in coronary sinus, cardiac oxygen extraction and occurrence of ROSC. Cardiac O2 extraction was estimated as arterio-venous difference in blood O2 content per 1L of blood as described previously (26). ROSC was defined as a supraventricular rhythm with hemodynamically effective pulsations regardless of ECMO flow with mean invasive arterial pressure in descendent aorta of 60 mmHg or more evaluated at 5 minutes following first defibrillation.
In order to exclude any impact of other factors on the MF of VF, the hemodynamic monitoring was analyzed. The monitoring was performed by using routine invasive pressure transducers to measure central venous pressure and pulmonary capillary occlusion pressure via inserted central venous line (internal jugular vein), Swan-Ganz catheter (via femoral vein) and aortic pressure via sheats or guiding catheters.
Statistical analysis
All continuous variables are reported as median and interquartile ranges (IQR). Mann-Whitney U-test was used for comparison of independent samples. Spearman's correlation analysis, Chi-squared test and Wilcoxon test were used for analyses as appropriate. A p-value less than 0.05 was considered significant.
Results
Out of 12 animals, one animal developed massive retroperitoneal bleeding during venous ECMO cannula insertion and was excluded from the study. In all animals target ECMO flow of 100 ml/kg per min has been reached.
MF analysis
The median and IQR of MF in min 1 of VF (ECMO_LOW 1) was 10.5 Hz (IQR: 9.8; 12.4). The MF did not change significantly during 15 min of VF up to the second measurement (ECMO_LOW 2). Following the increase in ECMO flow to 100 ml/kg per min, MF increased significantly and remained stable during continued maximal ECMO flow (Tab. I).
Ventricular Fibrillation Frequencies During Experiment Progress in Low-Flow Cardiac Arrest (Ecmo_Low 1 and 2) and during Full Ecmo Phases (Ecmo_Max 1 - 5)
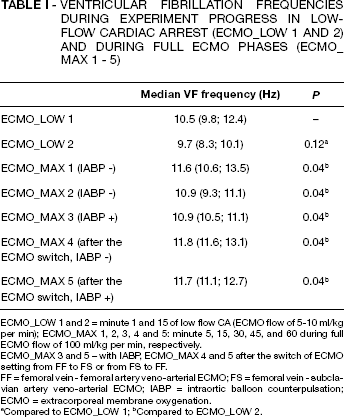
ECMO_LOW 1 and 2 = minute 1 and 15 of low flow CA (ECMO flow of 5-10 ml/kg per min); ECMO_MAX 1, 2, 3, 4 and 5: minute 5, 15, 30, 45, and 60 during full ECMO flow of 100 ml/kg per min, respectively.
ECMO_MAX 3 and 5 – with IABP, ECMO_MAX 4 and 5 after the switch of ECMO setting from FF to FS or from FS to FF.
FF = femoral vein - femoral artery veno-arterial ECMO; FS = femoral vein - subclavian artery veno-arterial ECMO; IABP = intraortic balloon counterpulsation; ECMO = extracorporeal membrane oxygenation.
Compared to ECMO_LOW 1
Compared to ECMO_LOW 2.
Immediate Supraventricular Rhythm/ROSC Assessment
Six out of the eleven animals recovered stable supraventricular rhythm with effective spontaneous circulation immediately after the first defibrillation despite prolonged period of 2:12 hours (1:20; 2:34) spent in VF. Prolonged experimental time was required in some of the animals due to the technical difficulties with data acquisition. These six animals had increased values of MF on recordings immediately preceding the countershock (ECMO_MAX 5) as compared to the others, 11.6 Hz (11.4; 11.7) vs. 10.9 Hz (9.7; 11.6); p = 0.04.
Out of five animals without effective supraventricular rhythm immediately after the first defibrillation, two animals initially presented pulseless electrical activity but reached ROSC criteria within 5 min following application of vasopressors (norepinephrine 0.1-1 μg/kg/min administered continuously by an IV drip). Two out of the remaining three animals without 5 min ROSC manifested prolonged pulseless electrical activity after the first defibrillation and the last one suffered refractory VF despite six defibrillations. Overall, we gained 5 min ROSC in 8 animals (73%).
When compared to the rest of the animals, three subjects without 5 min of ROSC demonstrated significantly greater decreases of MF between ECMO_LOW 1 and ECMO_LOW 2 points [Δ LOW 2: −2.4 Hz (-2.5; −2.3) vs. −0.6 Hz (-1.6; −0.1)] and continuously significantly higher increases in MF between ECMO_LOW 2 and ECMO_MAX 1 points [Δ MAX 1: 4.3 Hz (2.9; 5.6) vs. 1.1 Hz (0.6; 1.6)] with p = 0.05 for both observations, respectively (Fig. 2).

Differences in VF median frequency during the progress of the experiment. Two subsequent time spots were compared as follows: Δ LOW 2 refers to ECMO_LOW 1 and 2 difference; Δ MAX 1 to ECMO_LOW 2 and MAX 1 difference; Δ MAX 2 to ECMO_MAX 1 and 2 difference; Δ MAX 3 to ECMO_MAX 2 and 3 difference; Δ MAX 4 to ECMO 3 and 4 difference and Δ MAX 5 to ECMO 4 and 5 difference, respectively. Animals with ROSC (n = 8): closed circles and solid line. Animals without ROSC (n = 3): open circles and dashed line.
The three animals without ROSC in comparison to animals with ROSC presented lower levels of lactate during phases of low-flow ECMO and during first 15 min of full-flow ECMO, i.e., ECMO_LOW 2 time point [5.4 mmol/l (3.3; 5.8) vs. 8.0 mmol/l (5.7; 8.9), p = 0.05] and ECMO_MAX 2 point [6.4 mmol/l (4.7; 7.2) vs. 8.9 mmol/l (7.9; 10.7), p = 0.04], respectively. When compared to the rest of the animals, decreased oxygen extraction was detected at ECMO_MAX 2 in subjects without ROSC [27.4 ml O2/l (26.2; 28.7) vs. 33.8 ml O2/l (31.3; 43.8), p = 0.02], Figure 3.

Serum lactate level (panel A) and myocardial oxygen extraction (panel B) during experiment progress. Animals with ROSC (n = 8): closed circles and solid line. Animals without ROSC (n = 3): open circles and dashed line.
Between animals with and without stable supraventricular rhythm after the first defibrillation and animals with and without ROSC was not detected any significant difference in basic hemodynamic parameters: arterial pressure in aorta (p = 0.54 and p = 0.85), pulmonary artery pressure (p = 0.71 and p = 0.83), pulmonary capillary wedge pressure (p = 0.56 and p = 0.68) and cardiac output (p = 0.46 and p = 0.56), respectively.
MF to CoPP comparison
Immediately after induction of VF, the median CoPP decreased from baseline of 85 mm Hg (72; 94) to 15 mm Hg (10; 20) with p = 0.001. The first CoPP value on maximal ECMO (ECMO_MAX 2) was 34 mm Hg (26, 44) and gradually increased to 68 mm Hg (45; 82) before the start of CPR, (p = 0.003 for comparison of ECMO_LOW 2 vs. ECMO_MAX 5). MF correlated significantly although weakly with CoPP (R = 0.56; p = 0.03), Figure 4. No difference between animals with and without ROSC was detected in CoPP (p = 0.68).

Correlation of median VF frequency and CoPP. Open circles: ECMO_LOW 1-2 with ROSC; closed circles: ECMO_LOW 1-2 without ROSC; open triangles: ECMO_MAX 2-5 with ROSC; closed triangles: ECMO_MAX (2–5) without ROSC. Solid line: regression line for all data; Dotted line: regression line in ROSC subgroup; Dashed line: regression line for subgroup of animals without ROSC. No difference between subgroups was noticed (p = 0.68).
MF and ECMO type and IABP
As mentioned in Tab. II, both initial FF and FS ECMO settings manifested the similar MF. There was no difference in MF when IABP was added to either FF or FS ECMO.
Ventricular Fibrillation Wavelet Frequency according to Initial ECMO type
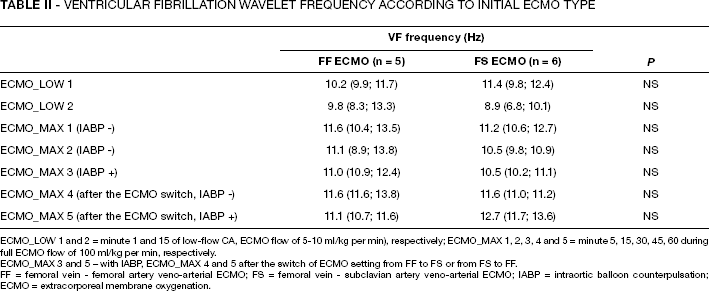
ECMO_LOW 1 and 2 = minute 1 and 15 of low-flow CA, ECMO flow of 5-10 ml/kg per min), respectively; ECMO_MAX 1, 2, 3, 4 and 5 = minute 5, 15, 30, 45, 60 during full ECMO flow of 100 ml/kg per min, respectively.
ECMO_MAX 3 and 5 – with IABP, ECMO_MAX 4 and 5 after the switch of ECMO setting from FF to FS or from FS to FF.
FF = femoral vein - femoral artery veno-arterial ECMO; FS = femoral vein - subclavian artery veno-arterial ECMO; IABP = intraortic balloon counterpulsation; ECMO = extracorporeal membrane oxygenation.
Discussion
The present data demonstrate that MF of VF recorded intracardially from right ventricle apex is not significantly deteriorated despite long period of VF when treated with V-A ECMO. Reduced values of MF imminently before CPR were noted in animals in whom stable supraventricular rhythm was not restored by the first defibrillation. In addition, the changes of MF in time during CA are in a close correlation to later ROSC occurrence. The lactate and oxygen extraction patterns in relation to later ROSC suggest different energy metabolism already during the low-flow ECMO regimen.
Previously published data dealing with VF wavelet analysis in context of defibrillation success have been predominantly extracted from the superficial ECG recordings (2–10). The MF course derived from intracardial signals during VF on V-A ECMO is described for the first time in this report.
MF during low-flow phase of ECMO
Despite the expected change of MF during “untreated” VF, the decrease of MF during this period is not significant. This phenomenon is most probably related to low ECMO flow of 5 to 10 ml/kg per min intentionally provided to avoid circuit thrombosis. The given ECMO flow well simulates low flow during cardiopulmonary resuscitation generating CoPP between 15 and 20 mmHg, typically seen with good quality chest compressions. This level of perfusion assured VF structure that improved immediately after converting to full ECMO support.
MF during full-flow ECMO phase and resuscitability
In response to full ECMO launch (ECMO_MAX 1 to 5), the MF increases above baseline level and remains stable for the rest of the whole ECMO period. Moreover, the overall rate of successful defibrillation is very high taking into account more than two hours of ongoing VF. In accordance with our intracardially obtained MF dynamics, some previously published data have shown similar dynamics of amplitude and spectrum parameters derived from surface ECG in four animals in prolonged VF treated with cardiopulmonary bypass (28, 29).
If VF is left untreated, both dominant and median VF frequencies decline and increased risk of unsuccessful defibrillation or chance for electromechanical dissociation after defibrillation exists (11, 30–35). Other reports have found threshold values of fibrillation MF predicting the results of defibrillation (11, 17, 19). On the other hand, in contrast to many published data, the extensive variability of the results in VF characteristics has been provided (2–10). As we have recently published, the use of V-A ECMO for urgent organ support sufficiently assures both cerebral and myocardial perfusion and oxygenation and improves the post-arrest metabolic state with manifest threshold effects for oxygen extraction (26). These important metabolic consequences are appropriately reflected in the MF pattern and consequently in a high resuscitability rate on ECMO.
A reduced MF immediately before CPR is present in animals without stable supraventricular rhythm achievable by the first countershock attempt (despite the occurrence of definitive ROSC). Interestingly, no difference in metabolic data (obtained in ECMO_MAX 5 phase) has been found between subjects with and without stable supraventricular rhythm immediately after the first defibrillation. Although MF may be highly predictive for supraventricular rhythm restoration by first countershock, more metabolic and circulatory variables might be necessary for prediction of sustained effective myocardial contractions, i.e., ROSC (36). The three animals without ROSC (defined as effective stable circulation 5 min after defibrillation attempt) have manifested deeper changes of the MF already at the phase of VF without full ECMO treatment and an advanced MF increase after full ECMO initiation. It should be noted that both lactate levels and oxygen extraction in the first 15 min of full ECMO treatment differ according to the presence of later ROSC. In addition, the lactate level is significantly lower at the end of low flow ECMO phase in subjects without ROSC. The differences and MF pattern in both metabolic markers manifest variations in animals with and without ROSC at comparable time points.
We can only speculate about the pathophysiological background of our findings. There may be more complex processes encompassing myocardial metabolism derangements (secondary to VF and not detectable by lactate and oxygen extraction) responsible for absence of ROSC despite the ECMO treatment. In a rat study, Choi et al (37) proved that CPR maintains myocardial ATP for only 2 min with subsequent decline despite ongoing resuscitation. We have shown that ECMO-based resuscitation maintains myocardial oxygen extraction, lactate and MF stable for more than two hours (26). In another study, Shibayama et al showed in canine ex vivo model of CA, that early asystolic hearts, i.e., hearts developing asystoly following unresuscitated VF, had more ADP, less phosphocreatine, and higher levels of lactate in contrary to late asystolic hearts (38). Contrary to these findings, we have observed animals with unsuccessful, later ROSC that had less increase in lactate and lower oxygen extraction. These observations suggest that animals without later ROSC did not produce lactate and did not utilize oxygen at the same rate as the others. Most likely, the myocardium of these animals was exhausted demonstrated by prolonged pulseless electrical activity without contractions following the first defibrillation and, possibly, lactate was metabolically utilized (39).
Nonetheless, this observation based on a limited number of experimental animals warrants further confirmation and elucidation. A weak correlation between VF wave frequencies and CoPP was observed in our present study. In general, it is widely accepted that adequate CoPP is a key prerequisite for ROSC in prolonged CA (40, 41). The correlation of the MF and CoPP corresponds to previously obtained data and supports the ability of the MF to reflect the overall coronary perfusion and resuscitability rate (5, 11, 42). The threshold effect in both parameters likely plays a role in predicting a successful countershock.
Influence of ECMO settings and IABP use
The protocol of study with different ECMO ± IABP modes was designed to investigate whether pulsatility represented by IABP might play a beneficial role in peripheral configuration of FF or FS ECMO in prolonged VF. The effect of IABP on macro- and also on microcirculation is still controversial. Some results have shown a favorable effect of IABP on both macro- (42) and microcirculation (43) in subjects with cardiogenic shock. On the other hand, some authors have shown that addition of IABP was not beneficial in severely hypotensive subjects (44, 45).
Despite the different course of CoPP improvements in FF versus FS ECMO approach with/without IABP (26), the MF seems to be almost unaffected by the two ECMO ± IABP modes. This phenomenon may be pathophysiologically similar to a threshold pattern of CoPP and ROSC achievement. The MF thus seems to be a less sensitive parameter for detecting subtle changes in ECMO mode. Of note, both FF and FS ECMO starting groups have presented with similar rates of ROSC. Nonetheless, a decreased MF may still identify a worse chance of ROSC.
Clinical consequences
ECMO assures adequate coronary perfusion and metabolic state in prolonged VF (26), also reflected by the MF of the VF wavelet, and thus offers a reasonable chance for successful countershock and ROSC achievement in case of refractory VF. In clinical practice, we frequently encounter patients with prolonged CA (often refractory VF) caused by a potentially treatable condition. Unfortunately, fewer than 50% out of hospital CA patients reach ROSC in the prehospital setting, while the rest die on the scene. The invasive approach encompassing ECMO may provide a time span to correct the triggering mechanism (46, 47). Thus, the main result of our analysis, i.e., the description of MF dynamics during prolonged VF, contributes to a deeper understanding of pathophysiological changes during ECMO-treated CA and elucidates the relation of the MF to later ROSC.
Study limitations
Our study has several limitations. We did not monitor left ventricle diameters and volumes and their possible changes during the experiment. It has been shown that the VF threshold may vary according to the degree of left ventricular distension influenced by ECMO. However, this experimental model aims to simulate the initial course of CA managed by ECMO with early ROSC. Left ventricle distension and possible venting is usually not considered in this very early phases.
In our VF period, the “low-flow” phase imitates ongoing CPR from the beginning of VF. We did not use the clinically typical “no-flow” phase in our model and consequently we were not able to perform analysis of pure, untreated VF. However, it has been described repeatedly (11–14). Despite this low-flow presence, significant metabolic consequences of prolonged VF (as reflected by high lactate and increased oxygen extraction consistent with prolonged resuscitated CA) were detected (26). In addition some basal flow is essential for prevention of circuit thrombosis. Next, subgroup analysis was not primarily designed for investigation of MF of VF in relation to ROSC. Finally, different electrophysiological properties of pig and human myocardium should also be taken into account. Underlying conditions causing refractory VF in clinical practice may modify the pattern of the arrhythmia; thus, the analysis of otherwise healthy pig hearts is potentially a limiting factor. Nonetheless, our biomodel was represented by a breed that has been validated for simulation of human CA and resuscitation (48).
Conclusions
We have shown that MF changes during low-flow CA may predict later ROSC. When full-flow ECMO reperfusion is initiated, the MF remains stable despite a very long period of VF. Compared to MF changes, the lactate and oxygen extraction patterns related to later ROSC suggest a different energy metabolism already during the low-flow phase of CA.
Footnotes
List of Abbreviations
Acknowledgements
We thank prof. Jan Bakker for invaluable input and help with the manuscript preparation. We also thank Tereza Vavrikova and Alena Ehrlichova for technical assistance.