
Abstract
Purpose
Intradialytic hypotension (IDH) represents a common hemodialysis (HD) complication. Blood volume tracking (BVT) is a tool regulating the relative blood volume changes and potentially reducing the occurrence of IDH. The aim of this study was to evaluate the ability of BVT to reduce the staff workload associated to IDH.
Methods
Ten hypotension-prone HD patients were treated each with 39 conventional HD (HD) sessions and then switched to 39 HD sessions with BVT (HD-BVT). The staff interventions related to IDH were monitored by a trained staff.
Results
Dialysis sessions complicated by IDH and staff interventions were affected by BVT (HD: 102 and 127 vs. HD-BVT: 57 and 59, respectively, for both p<0.001). The time consumed by staff in IDH management was decreased by HD-BVT (1416 vs. 578 min, p<0.001).
Conclusions
The effectiveness of BVT to reduce the frequency of IDH leads to a reduction of the dialysis staff workload with fewer staff interventions, allowing for major work-time saving.
Introduction
Intradialytic hypotension (IDH) is a common acute complication of hemodialysis (HD) therapy accounting for up to 20% to 30% of complicated dialysis sessions (1). This clinical hemodialysis side effect is continuously growing as a consequence of the increasing age of the HD population and the concomitant presence of several co-morbidities, such as diabetes, autonomic dysfunction, or cardiomyopathy (2, 3). The most common reasons why a patient develops IDH are hypovolemia, decreased cardiac output, arterial and venous dilatation. Apart from the discomfort caused to the patients (nausea, vomiting, headache, and muscle cramps), IDH seems to be an independent risk factor for patient mortality (3, 4). Many efforts have been made to prevent IDH, such as ultrafiltration profiling, sodium profiling, dialysate cooling, etc. (5). The blood volume tracking (BVT) system is a tool capable of reducing the occurrence of IDH by preventing sudden drops of relative blood volume (RBV) during the dialysis session and customizing the blood volume changes in the individual patient by automatically and continuously adjusting both the ultrafiltration rate and the dialysate sodium content during the HD session (6). The system has been proven to reduce hypotension episodes and to increase the number of event-free sessions (i.e., number of dialysis sessions not requiring staff intervention) (7, 8). In some patients, particularly volumesensitive ones, hypovolemia control may reduce discomfort, which is the source of continuous calls made to the staff. The present study aimed to evaluate whether the BVT system is able to decrease the number of staff interventions (both hypovolemia- and hypotension-related), reduce the staff workload, and save working time.
Patients and Methods
Study Design and Patients
The study was planned according to a prospective sequential design lasting six months: the patients were treated first of all with conventional dialysis (HD, 3 months) and then with hemodialysis with BVT (HD-BVT, 3 months) without any washout period. Since we observed that the sequence did not affect variability in the analysis of variance in a previous randomized controlled crossover study (7), we did not consider the study as two sequences (HD vs. HD-BVT or HD-BVT vs. HD). Ten ESRD patients (5M/5F, age 76.7 ± 8.3 years, HD vintage 6.6 ± 4.5 years) prone to IDH during dialysis treatment were selected for the study. The patients were considered eligible for the study if in the previous six months the frequency of IDH was more than 20% of the HD sessions, with stable hemoglobin and dry weight. The presence of cancer and/or mental illness, pregnancy, residual diuresis greater than 500 ml/die, and poor vascular access requiring single-needle HD were considered exclusion criteria. The patients were blinded to the delivered therapy, but not the users. The study protocol was in accordance with the Helsinki declaration and all the patients provided informed consent before entering the study.
Intervention and Measurements
BVT is a biofeedback system with continuous monitoring and control of the patient's RBV changes. As the RBV is estimated in real-time by an optical absorbance measurement system, the BVT system automatically adjusts the treatment parameters ultrafiltration (UF) and dialysate conductivity (DC), keeping the RBV reduction stable and within a patient's predefined RBV trajectory where hypovolemia is avoided. In contrast to conventional approaches to minimize hypotensive episodes, BVT avoids salt loading, applying the concept of equivalent conductivity, which is the conductivity value that produces the same sodium mass balance as a standard dialysis (7, 8). The two treatments (HD and HD-BVT) were performed with the same setup (treatment time, blood flow, dialysate conductivity, synthetic membrane, concentrates) and delivered by Integra monitors (Gambro Hospal, Bologna, Italy) equipped with the RBV sensor (Hemoscan™; Gambro Hospal, Bologna, Italy) and Hemocontrol™ (Gambro Hospal, Bologna, Italy). In the control period (HD), the dialysis was performed with no ultrafiltration profiles and sodium profiles, while in the HD-BVT period, the dialysis was assisted by BVT. Any medications or drugs were kept at a constant dose and frequency during the entire study.
Outcomes
The primary end-point was the number of HD sessions requiring staff intervention (physicians and nurses) related to IDH management. The secondary end-points were: the number of sessions interrupted before the end treatment, the number and grade of IDH, effective treatment time, accumulated weight loss, “end-treatment” RBV, pre- and post-dialysis systolic arterial pressure (SAP), pre- and post-dialysis heart rate (HR), weight loss fault (WLF), dialysis dose fault (DDF) and intervention work-time (IWT). Moreover, pre-dialysis biochemical parameters (sodium, potassium, total calcium, hemoglobin concentration) were evaluated in the mid-week session of the first week of each month. IDH was defined as one of the following three situations: 1) for patients starting dialysis sessions with SAP ≥100 mmHg, a SAP value ≤90 mmHg, even in the absence of any typical low blood pressure symptoms; 2) in the case of patients with pre-dialysis SAP <100 mmHg, a SAP reduction of at least 10% of the pre-dialysis value accompanied by characteristic symptoms (e.g., nausea, vomiting, sweating, dizziness, or yawning); 3) any SAP reduction ≥25 mmHg compared to the pre-dialysis value, in the presence of typical symptoms accompanying hypotension, requiring an immediate therapeutic maneuver (Trendelenburg position, saline infusion, etc.) (7).
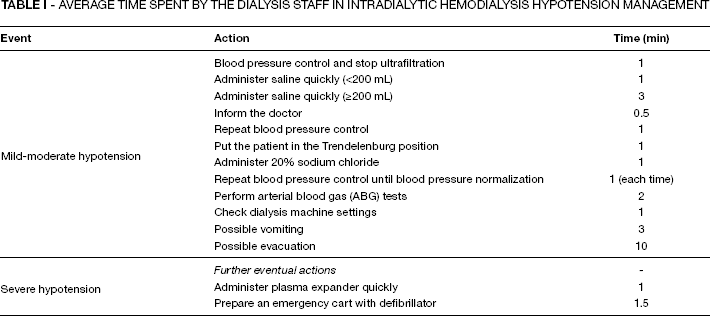
IDH was classified into two grades according to its severity. The IDH episode was considered mild-moderate if it was resolved by means of normal operations (e.g., slowing the ultrafiltration rate, Trendelenburg position, reduction of blood flow) or if it required corrective infusion of less than 200 mL of saline solution. The IDH episode was considered severe if it required the infusion at least of 200 mL of saline solution or plasma expanders. Dialysis sessions in which the patient experienced at least one IDH were considered complicated. Dry weight estimation was verified by the attending physician at each dialysis session as usually performed in the routine clinical practice of the center, on the basis of clinical criteria (e.g., peripheral edema, blood pressure pattern intra- and inter-dialysis, signs of pulmonary congestion, cramps during dialysis session). The total weight loss (TWL) was set as the difference between the pre-dialysis weight and the dry weight at each session and for each patient. A dedicated staff (2 physicians and 5 nurses) was defined to perform the study and it was educated and aligned on IDH management strategy in order to have a uniform response to IDH. The entire staff was trained for IDH management by a procedure that took into account only the tasks and the timing in Table I. An external staff (1 physician and 1 nurse), from Malpighi Hospital (Bologna, Italy), reviewed the staff interventions to decide whether they were in accordance with the protocol.
Average Time Spent by the Dialysis Staff in Intradialytic Hemodialysis Hypotension Management
Calculated variables
The IWT was defined as the time used by the staff for managing mild-moderate and severe IDH. It was calculated by the Malpighi external staff, summing the time of a single action done for each IDH, according to the code reported in Table I. The WLF and the DDF were defined as an error referred to dialysis prescription. WLF was calculated as the TWL set minus the actual weight loss plus the amount of reinfusion (saline, hypertonic and plasma expander). The calculation of DDF takes into account the IDH impacts on the diffusion time and the urea clearance. In fact, in the case of IDH, the blood flow (QB) may be reduced to a minimum value for 10 min and/or the end of treatment time may be anticipated (ΔTd) in respect to the set treatment time (Td). According to this, the effective treatment time (Td_eff) was defined as shown in Equation 1:

Failing to provide dialysis urea clearance (K), we can define the actual clearance with Equation 2, from which we obtain the ratio between the actual and the expected clearance shown in Equation 3.


A new way to describe the dialysis dose (Kt/V), considering Equation 3 and knowing that the dry weight and the ultrafiltration rate remain constant in both treatments, is described by Equation 4.
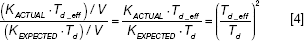
Finally, we define the DDF as shown in Equation 5.

Statistical Analysis
The descriptive analysis was based on mean and SD values for normally distributed continuous variables. Differences at baseline in clinical and laboratory variables between the two treatments were tested using T-test for normally distributed continuous variables and the x 2 -test for categorical variables. SAP and HR were tested by ANOVA for repeated measures, considering a model that included the time (pre- and post-HD) as intra-subjects factor, the treatment as inter-subjects factor and the interaction between time and treatment. A p value <0.05 was considered statistically significant. All of the statistical analyses were performed using SPSS 15.0 for Microsoft Windows (SPSS, Chicago, IL, USA).
Results
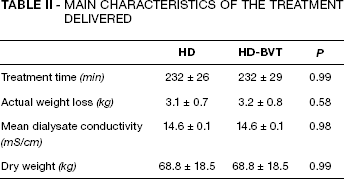
No significant differences were found between the two treatments regarding to the actual treatment time, the actual weight loss, dry weight and mean DC (Tab. II). Moreover, all the biochemical parameters (HD vs. HD-BVT: Hb 11.2 ± 0.7 g/dl vs. 11.4 ± 0.9 g/dl, p = 0.48; K+5.9 ± 0.7 mmol/l vs. 6.0 ± 0.7 mmol/l, p = 0.34; total Ca 8.9 ± 0.5 mg/dl vs. 8.8 ± 0.4 mg/dl, p = 0.45) were found to be similar in both the periods, except for the pre-HD plasma sodium concentrations, which were lower in HD-BVT (137.9 ± 1.8 mmol/l vs. 137.0 ± 1.9 mmol/l, p<0.05).
Main Characteristics of the Treatment Delivered
Staff workload
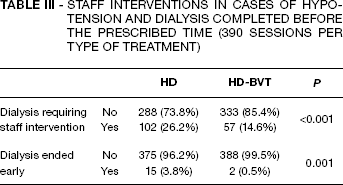
The number of staff interventions was significantly associated with the type of treatment administered (127 interventions in HD vs. 59 interventions in HD-BVT, p<0.001). In particular, the number of HD sessions requiring staff interventions was approximately halved, from 102 (26.2%) to 57 (14.6%), when the patient underwent HD-BVT dialysis (p<0.01, Tab. III). The sessions of the control period were interrupted before the prescribed treatment time in a percentage significantly greater than the HD-BVT, from 15 (3.8%) to 2 (0.5%) (p<0.001, Tab. III). Moreover, the type of treatment was associated with hypotension severity (p<0.001, Tab. IV). The frequency of mild-moderate hypotension was particularly decreased from 20.8% to 14.1% and severe hypotension from 5.4% to 0.5%, using BVT. The total amount and the number of boluses of saline infused for therapeutic purposes were twice as much (17.35 L and 101/390) during the control period compared to the study period (8.70 L and 57/390, both p<0.001), even though the infusion of plasma expanders and hypertonic solution were not found to be statistically different (HD: 26/390 vs. HD-BVT: 17/390, p = 0.07; HD: 3/390 vs. HD-BVT: 2/390, p = 0.56, respectively). The IWT, total time consumed by the staff for IDH management, was significantly greater in HD than HD-BVT treatment (1416 vs. 578 min, p<0.001). This means the dialysis staff saved about 14 hours of work-time just by using BVT.
Staff Interventions in Cases of Hypotension and Dialysis Completed before the Prescribed Time (390 Sessions per type of Treatment)
Number of Dialysis and Intradialytic Hypotension Severity (390 Sessions per type of Treatment)
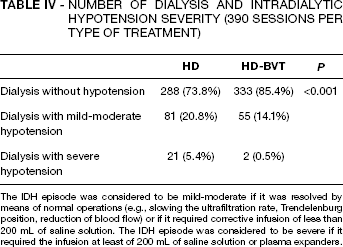
The IDH episode was considered to be mild-moderate if it was resolved by means of normal operations (e.g., slowing the ultrafiltration rate, Trendelenburg position, reduction of blood flow) or if it required corrective infusion of less than 200 mL of saline solution. The IDH episode was considered to be severe if it required the infusion at least of 200 mL of saline solution or plasma expanders.
Hemodynamic response
The mean SAP decreased in both treatments during the session, but more smoothly in HD-BVT (HD from 134 ± 8 to 109 ± 9 mmHg vs. HD-BVT from 133 ± 9 to 118 ± 7 mmHg, p<0.001). In fact, the mean SAP was significantly affected by time, treatment and time-treatment interaction (all factors p<0.001), proving the role of BVT on SAP control. Similar findings were obtained for ΔSAP (pre- vs. post-dialysis) and RBV reduction. In fact, the ΔSAP values were systematically lower in HD-BVT (HD: 25.2 ± 4.1 mmHg vs. HD-BVT: 15.2 ± 3.3 mmHg, p<0.001, Fig. 1) such as the reduction of RBV (HD: −9.8 ± 1.4% vs. HD-BVT: −7.8 ± 1.3% p<0.001, Fig. 2), confirming once again the strong relationship between SAP behavior and RBV reduction. The mean HR values demonstrated a trend association for time (p<0.001) and treatment (p = 0.02). Starting from similar pre-dialysis value (HD: 75 ± 11 vs. HD-BVT: 74 ± 11 beats/min, p = 0.37) the HR value increased in the HD period, while it was stable in BVT, reaching a significant difference values in post-dialysis (HD: 78 ± 6 vs. HD-BVT: 75 ± 7 beats/min, p<0.05).
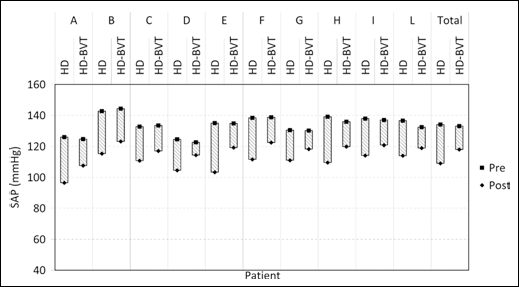
Trends in mean values of SAP in each patient (columns A÷L) and in all patients (last column) in HD and in HD-BVT. The bars represent the decrease in SAP between pre- and post-dialysis.

Mean blood volume reduction trend in each patient (columns A÷L) and in all patients (last column) in HD (gray bars) and in HD-BVT (black bars).
Dialysis Efficiency
The WLF and the DDF were found to be systematically lower in HD-BVT (respectively HD: 387 ± 184 ml vs. HD-BVT: 321 ± 99 mL, p = 0.001; HD: 10.3 ± 4.5 % vs. HD-BVT: 8.8 ± 3.5 %, p = 0.01). This finding highlights that the use of BVT, by reducing the IDH, provided a more efficient dialysis that was close to medical targets.
Discussion
The use of BVT in this study reduced the sessions with IDH by 45%. The premature sign-offs of the dialysis sessions were reduced by about 86% and the use of saline by 50%. Considering the number of single interventions and the time to perform them, we calculated a 57% reduction in work-time. These findings are consistent with the results of previous studies that reported a decrease in saline infusion use or staff interventions with BVT (6, 10, 12––15). Santoro et al demonstrated a reduction in saline administration in each session performed with BVT as compared with the standard HD (6). Similarly, Ronco et al observed a decrease in hypotensive episodes and the saline infusion requirement in hypotension-prone patients (10). The main result of our study is that BVT, by reducing IDH, allowed us to save up to 14 work-hours in a three-month period. Considering that this finding has been reached in only ten patients and that the prevalence of hypotension-prone patients in the general dialysis populations will continue to increase (as an increasing number of elderly patients will develop CKD, and also due to the progressive increase in the number of diabetic patients with CKD) (16), our result could have a noteworthy impact on the staff workload in routine dialysis.
In recent years, the staff activities and logistics of the dialysis room have become the major issues in modern dialysis. The increased workload per physician and nurse, shown respectively by the increment in the patient-physician and patient-nurse ratio from 2001 to 2008 (9), means that there is less time for basic activities and patient care. Hence, automatic biofeedback systems like BVT should help healthcare professionals, by decreasing the number of interventions, reducing the staff workload and saving time for better patient care in the event of severe complications. Deziel et al reported that the time spent by the dialysis staff in the training period was longer with BVT than with conventional HD, but, after this initial phase, with the continuous use of BVT, there was a reduction of the staff workload around 50% (12). On the other hand, our findings on the reduction of IDH by using BVT are confirmed by several authors (6––8, 10––13, 15, 17), while the European Best Practice Guidelines on hemodynamic instability recognize individualized BVT feedback as an effective treatment option to prevent IDH (5). Furthermore, the increase in cardiovascular tolerance may enhance dialysis efficiency and foster the achievement of a correct patient dry body weight (6, 8, 10). Additionally, the number of dialysis sessions suspended before their scheduled end is much lower with the BVT system than with conventional HD.
An important drawback to the study is its relatively limited duration in time and the small number of patients: just ten. Moreover, another limitation could be that the patients were blinded to the delivered therapy, but not the users. At the same time, a strength is that each patient was his/her own control and the staff enforced the same behavior in the intervention phases for each individual patient.
Conclusions
In conclusion, this study confirms the effectiveness of BVT in reducing the frequency of hypotensive episodes, both moderate and severe, in hemodynamically unstable patients: some obvious advantages clearly ensue in achieving the individual patient's dry weight and greater dialysis session efficiency. This clinical result is reflected in the practical data: a definite reduction in staff workload, fewer nursing interventions, less saline infusion. In practice, all this leads to increased clinical advantages for the patient without an overload in terms of staff work, in fact, with a significant reduction. Of course, similar studies are necessary on larger patient trials in order to clarify whether these advantages will be preserved in the long-term and, above all, whether they will be confirmed on a larger patient pool.
Footnotes
Acknowledgments
The authors thank the dialysis staff for their efforts on this study.