






Abstract
Purpose
In order to find the correct final position of the tip of a central venous catheter, we have developed a new electric method (the Proximity of Cardiac Motion (PCM) method), designed to work in tandem with the existing ECG-based method.
Methods
A small, patient-safe, high-frequency current is fed through the catheter (via the saline-filled lumen of the catheter, or a stylet). Simultaneously, the resulting voltage is measured by two electrodes on the frontal thoracic skin. The catheter tip hence functions as a current source inside the vasculature. The cardiac motion produces a variation in the amplitude of the measured voltage in the rhythm of the cardiac cycle, and the strength of this oscillatory variation is proportional to the strength of the incident current field on the heart, which is a rapidly decaying function of the distance between the catheter tip and the cavoatrial junction (CAJ). Hence the strength of this oscillatory variation is a strong indicator for the proximity of the catheter tip with respect to the CAJ.
Results
The new method has been tested in an animal model, yielding an average final position of the catheter tip of 2.1 cm above the CAJ, with a maximum deviation of 0.5 cm.
Conclusions
We conclude that the new PCM method can be combined with the existing ECG method, and may potentially have significant added value when the ECG method cannot be applied, for example, in patients with atrial fibrillation or a pacemaker.
Introduction
Central venous catheters are used in nearly every intensive and long-term infusion treatment. For all central venous catheters however, there is the need for correct tip positioning: The distal tip of the catheter must be located at the right position with respect to the right atrium; generally a position at a predetermined distance d with respect to the cavoatrial junction (CAJ) is considered optimal, in which the predetermined distance d is often chosen to be zero (d = 0), in which case the CAJ itself is considered to be the optimal position. About 10% of all insertions of peripherally inserted central catheters (PICCs) result in malpositioning of the catheter tip. In case of malpositioning, the necessary repositioning of the catheter tip increases the risk of bloodstream infections. Therefore, a number of techniques have been developed to assist in finding the correct final tip position during insertion of central venous catheters. These techniques aim at reducing the percentage of malpositioning of the catheter tip.
A proven and basic principle for catheter tip position confirmation is the ECG method. The position of the catheter tip inside the venous system can be detected by following the catheter itself (or a guidewire inside the catheter) as an intracavitary electrode which replaces the “red” or “right shoulder” electrode of the standard surface ECG. When the ECG monitor is connected to the intracavitary electrode, the reading of lead II will show a P wave whose shape and height will be a reflection of the closeness of the intracavitary electrode (i.e. catheter tip) to the sinus atrial node. As the intracavitary electrode is in the lower superior vena cava approaching the atrium, the P wave starts to rise. When the P wave is at its peak, the catheter is closest to the crista terminalis. When the catheter enters further in the atrium, the P wave decreases, becomes diphasic and ultimately becomes negative (1).
Of all the catheter tip tracking devices, the ECG method has proven to be quite reliable and cost-effective with 95% accuracy in tip positioning, and is widely used. One of the latest tracking devices is the Vascular Positioning System (VasoNova™ Inc, Menlo Park, USA), that uses a combination of intravascular Doppler ultrasound and ECG technology. A major remaining issue with the ECG method however is that it does not function properly in case of atrial fibrillation (2, 3).
In our group, we have developed a new electric method (the “Proximity of Cardiac Motion” (PCM) measurement) for finding the correct final tip position that may serve as a valuable complement to the ECG method. The PCM system produces a signal that depends on the relative distance between the catheter tip and the heart (4). The PCM signal is derived from a voltage measured on the thorax as a result of a weak, safe, electric current that is fed through the catheter. The PCM signal is measured by electrodes on the thoracic skin. This PCM signal is virtually absent if the catheter tip is not near the heart. It increases as the catheter tip approaches the heart, and reaches a maximum at approximately 1.5 cm (0.5 cm) before the CAJ. In this paper, we first explain the principle of operation of the PCM method. Subsequently, the results of experimental in vivo feasibility tests are presented, and the performance and potential of the PCM method are briefly discussed.
Methods
Principle of operation of the PCM system
Since the purpose of the PCM system is to produce a signal that enables positioning of the catheter tip at an optimal relative distance with respect to the heart (as opposed to “distance to a fixed visible point on the thoracic skin”), the principle of operation of the PCM system is based on an effect that is produced by the heart itself. It is important to emphasize that, although our PCM method is intended as a supplement to be used in tandem with the ECG method, the PCM method itself does not measure the ECG.
The principle of operation of the PCM method relies on a known effect that has been described extensively in the literature (5): it has been shown that, if a (weak, patient-safe, AC) electric current (having a frequency f in the kHz range) is applied over the entire thorax (using two skin electrodes: one applied on the head or neck, and one applied on the lower part of the body), a voltage difference (having an amplitude V and the same frequency f) is produced by this current field over the thorax that can be measured using another pair of skin electrodes on the thorax, and more importantly, it has been shown as well that the pumping action of the heart causes small changes to occur in the measured voltage difference V as a function of the various stages of the cardiac cycle (Fig. 1). These small changes in the measured voltage difference V occur because of the fact that blood is a better electric conductor than the surrounding tissues (including the muscle tissue of the heart itself), and the volume of blood that is present in the four individual lumina of the heart changes dramatically during the various stages of the cardiac cycle. Since the heartbeat is a repetitive phenomenon, the pattern of changes in the measured potential difference V is repetitive as well (Fig. 2). Depending on the position of the current feeding electrodes (c1 and c2), a portion of the current will pass through the heart.
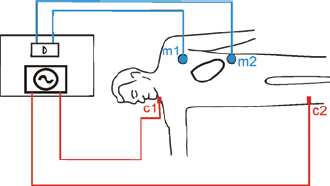
Classical set-up (“4-point measurement set-up”) for measuring the (volumetric) effect of the pumping action of the heart on an applied current field over the thorax. The current source CS produces a weak, patient-safe, AC current of constant amplitude and frequency f (in the kHz range). The voltage meter (indicated by the blue V, and connected to skin electrodes m1 and m2) measures only the amplitude of the voltage at the same AC frequency f. Therefore, the AC voltage meter does not measure the ECG of the heart, but only the volumetric conductivity effects of the pumping motion of the heart on the applied AC current field of frequency f. In this way, a distinctive repetitive “undulation” pattern is measured in the amplitude of the AC voltage that is synchronous with the rhythm of the heartbeat. See Figure 2 for an example of such a repetitive pattern.
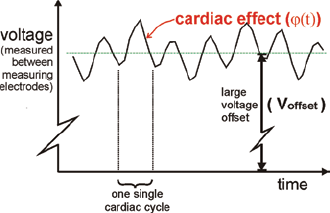
Offset and cardiac effect. The repetitive pattern ϕ(t) of changes in the measured voltage is a cardiac effect, caused by the repetitive filling and emptying of the heart.
Evidently, if electrode c2 would be placed above (i.e. cranial with respect to) the heart and close to the neck, a much smaller portion of the current would pass through the heart than when, for example, electrode c2 would be placed directly below the apex of the heart. As a result, in the case that electrode c2 would be placed directly below the apex, the amplitude of the undulations that constitute the “cardiac effect” in Figure 2 would be larger than when electrode c2 would be placed close to the neck. In all cases, the two measuring electrodes m1 and m2 remain on the same positions.
The essential point in the principle of operation of the PCM system now is that the applied weak AC current is fed through the lumen of the central venous catheter, and therefore the catheter tip takes over the role of the electrode c2.
Since the outside of a catheter consists of electrically insulating material, the orifice at the tip of the catheter functions essentially as a current feeding electrode located deep inside the vasculature at the tip of the catheter (Fig. 3). As a result, the current (originating from current source CScath in Figure 3) travels via c3, through the catheter lumen or metal guidewire towards the catheter tip (where the current is released into the body) and finally to the electrode c1 in the neck. The size of the fraction of the current that travels through the heart depends strongly on the distance between the catheter tip and the heart. As a result, the size of the fraction of the current that is affected by the volume variations inside the heart, during the cardiac cycle, depends strongly on the distance between the catheter tip and the heart as well, and so does the strength of the cardiac modulation (i.e. the amplitude of the “cardiac effect” in Figure 2). This makes the PCM method possible, in which the PCM is an indicator of the relative distance between the catheter tip and the heart.
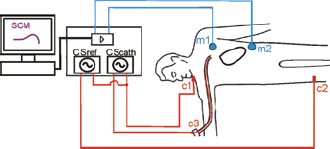
Schematic of the hardware needed for the PCM method. Two measuring electrodes (indicated by m1 and m2 in the figure) have been applied on the thoracic skin, one above and one below the heart, and connected to an amplifier inside the data acquisition unit. Furthermore, two leads are connected to a weak, safe, AC current source (indicated by CScath); one lead ends in a skin electrode attached in the neck (c1), and the other lead is connected to the saline-filled lumen inside the catheter, or the stylet inside the catheter at location c3 outside the patient. As a result, the current travels through the body between the catheter tip (where the current is released into the body) and the electrode in the neck. The size of the fraction of the current that travels through the heart depends strongly on the distance between the catheter tip and the heart. Furthermore, in order to make the reference measurement possible, another weak, safe, AC current source (indicated by CSref, which uses another high AC frequency) has been added, connected to electrode c1 and electrode c2 on the leg or lower abdomen.
Reference signal using a second current source
In order to neutralize artefacts due to fluctuations in cardiac stroke volume as function of time, or artefacts due to deviating cardiac motion patterns (such as in the case of e.g. atrial fibrillation), a “reference signal” is introduced. This reference signal is caused by a second current source CSref (Fig. 3), not connected to the catheter, but connected to electrode c2, and has an AC oscillation frequency that is different from the AC frequency of the main current source CS. This difference in AC oscillation frequency enables simultaneous measurement of both frequencies by the same pair of measuring electrodes me1 and me2, because specific filtering in the data acquisition unit enables simultaneous assessment of the main signal (i.e. the φ(t) in Figure 2) as well as the reference signal. Whereas the main signal is strongly dependent on the position of the catheter with respect to the heart, the reference signal does not depend on the catheter position at all, because it does not involve the catheter. The shape of the reference signal, however, is approximately the same as the shape of main signal, because for each point in time, the shapes of the main signal and the reference signal are both caused by the same motion of the same heart at the same moment in time. As a result, “dividing” the main signal by the reference signal removes all effects that are not related to the position of the catheter, and yields a result that is not affected by artefacts due to, e.g. atrial fibrillation or fluctuations in cardiac stroke volume. The result that is produced by “dividing” the main signal by the reference signal will be referred to as the PCM signal.
Set-up for in vivo feasibility tests
The in vivo experiments have been performed on a Dalland pig, with prior approval by the Animal Experimentation Committee of the Faculty of Medicine, Utrecht University, the Netherlands (DEC number 2010.II.07.127).
Two different types of feasibility tests have been performed:
Measurement of the experimental PCM curve (i.e. measurement of the PCM as function of the position of the catheter tip with respect to the CAJ);
Insertion and positioning of the central venous line using our new system by a trained PICC nurse.
The purpose of experiment type (i) was to test the validity of the theoretical claim that the PCM curve has indeed the distinct and reproducible features (viz, a maximum at about 2 cm before the CAJ, and a transition from positive values to negative values near 1 cm before the CAJ) that enable a reliable method of positioning of the tip of the catheter with respect to the CAJ. The purpose of experiment type (ii) was to obtain an estimation of the accuracy of the resulting end position with respect to the pre-defined target point.
In both types of experiments, the position of the tip of the catheter was monitored continuously using X-ray fluoroscopy. Furthermore, in experiment type (ii), the time needed by the PICC nurse to perform the final positioning of the catheter using our PCM system, was measured.
Animal
A fully anaesthetized Dalland pig (weight 65 kg) was placed on the operating table, lying on its back. During the experiments, the animal remained fully anaesthetized, and connected to a positive pressure ventilator, using a mix of 50% oxygen and 50% air, with a tidal volume of 10 mL/kg b.w. and 12 breaths/minute.
In our experiments, a double-lumen, open-end 5 French PICC catheter (medCOMP, Harleysville, PA, USA) was used, which included a metal (electrically conducting) stiffener. The stiffener was inserted into the catheter over the entire length of the catheter. At all times during the experiments, the stiffener remained at a fixed position within the catheter, that is when advancing the catheter through the vasculature of the animal, the stiffener moved along with the catheter, remaining at a fixed position within the catheter.
Electronics
Two standard skin electrodes (Nutrode pre-gelled electrodes, Technomed Europe) were placed at about 2 cm above and 2 cm below the heart, respectively. This electrode pair measured the voltage V(t). Current sources (floating) producing AC currents of 1,828 Hz and 2,098 Hz, for the standard signal and the reference signal, respectively, with a constant amplitude of 100 μA (RMS) were connected to the metal stylet at location c3 and to the current feeding electrode c1, as indicated above and in Figure 3.
Filtering and amplification of the measured voltages were performed using a Princeton Applied Research model 113 pre-amp (Gain = 500, bandpass filtering: 100 Hz-10 kHz) and a Stanford Research Systems SR560 (Gain = 500, bandpass filtering 300 Hz-10 kHz).
Procedure
A radiopaque X-ray ruler was placed under the animal, within the field-of-view of the X-ray fluoroscopy. As a result, the position of the tip of the (radiopaque) stylet with respect to the radiopaque ruler was visible in the fluoroscopy images, as well as the position of e.g. the CAJ with respect to the radiopaque ruler. Therefore, when advancing the catheter, the position of the tip of the stiffener, and hence the position of the tip of the catheter itself, was monitored continuously using the X-ray fluoroscopy. With this set-up, two types of experiments were performed (type (i) and type (ii), as mentioned before).
Experiment type (i): In this experiment, the catheter was advanced slowly in the direction of the heart, starting from a position in which the catheter was only about 2 cm inside the vasculature of the animal near the entry point in the right jugular vein. During the procedure, the PCM values were registered continuously, as well as the position of the catheter tip with respect to the radiopaque ruler according to the X-ray imagery (with a precision of 0.5 cm). The position of the radiopaque ruler with respect to the heart of the animal remained constant, and was assessed in an X-ray fluoroscopy protocol recognizing the carina in combination with the contours of the heart.
Experiment type (ii): complete catheter placement procedure, performed by a trained PICC nurse.
Five test runs have been performed. Each test run consisted of a complete catheter placement guided by only the PCM method, again starting from a position in which the catheter was only about 2 cm inside the vasculature of the animal near the entry point in the right jugular vein. During each test run, the PICC nurse did not see any X-ray fluoroscopy images, but looked at the real-time PCM values displayed on a computer screen to determine the final position of the catheter. The final position was defined as the position having the maximal positive value of the PCM. The fact that the perceived maximum PCM value was indeed a maximum was checked by pushing (temporarily) the catheter about 1 cm further in the direction of the heart, which caused the PCM to drop suddenly to zero; subsequently the catheter was pulled back again to the position having the highest PCM value. Only after completion of the catheter positioning procedure, X-ray images were made to verify the exact final position of the tip of the catheter with respect to the radiopaque ruler, and, hence, with respect to the CAJ.
Results
The results from experiment type (i), i.e. the measured PCM values as a function of the position readings obtained from the X-ray images, are rendered in Figure 4. This experiment has been performed three times: two times using a slow movement of the catheter while measuring the PCM every 0.5 cm, and once using a fast movement, measuring the PCM at larger spatial intervals. As can be seen in Figure 4, the measured PCM signals are in accordance with the shape of the calculated theoretical curve (continuous thick black curve in Figure 4) within the interval between z = -5 cm and z = −1 cm, which is the essential interval for the PCM method to work. The reason for the discrepancy between the measurements and the calculated theoretical model curve in the remaining interval at the right side of Figure 4 (i.e. the interval between z = -1 cm and z = 2.5 cm) is explained in the discussion section.
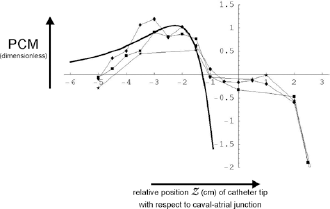
Results of experimental feasibility tests in a pig model. A central venous catheter was advanced through the vena cava superior in the direction of the right atrium. During the movement of the catheter, the PCM was measured continuously, and the position of the catheter tip was assessed continuously by X-ray fluoroscopy. In this figure, the measured PCM values have been plotted as a function of the position z (according to the X-ray imaging) of the catheter tip. The experiment has been performed three times, yielding three sets of data points (indicated by the diamond-, square- and star-shaped symbols, respectively). The position z = 0 was defined as the situation in which the catheter tip coincides with the CAJ in the X-ray image. All other positions z were defined as relative positions with respect to the CAJ in the X-ray images. Furthermore, the theoretical relation between PCM and position z has been plotted in the form of thick continuous black curve.
The results from experiment type (ii), i.e. the accuracy and time consumption of the PCM method, are rendered in Table I. This experiment has been performed five times. For all five test runs, the final position of the tip of the catheter was located between 2.0 cm and 2.5 cm above the CAJ. The average final position was 2.1 cm above the CAJ, with a standard deviation of 0.2 cm. The average time consumption for the complete positioning of the catheter was 58 seconds, with a standard deviation of 8 seconds.
Performance of the pcm method during five test runs of picc placement in vivo in a pig model: accuracy of positioning (with respect to caj, as measured using x-ray) and time consumption
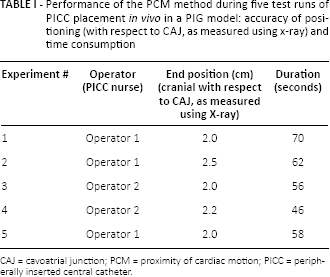
CAJ = cavoatrial junction; PCM = proximity of cardiac motion; PICC = peripherally inserted central catheter.
Discussion
A catheter tip positioning assist device has been developed (the PCM method), and some first in vivo feasibility tests have been performed on an animal model (Dalland pig).
It is important to emphasize that, although our PCM method is intended as a supplement to be used in tandem with the ECG method, the PCM method itself does not measure the ECG. The first in vivo feasibility tests yield favourable results. However, since these tests were only performed on pigs, more research is needed, including tests in human subjects, in order to establish whether this new PCM method works properly in humans as well.
The type (i) in vivo measurements show that the measured PCM signals are in accordance with the shape of the calculated theoretical curve (continuous thick black curve in Figure 4) within the interval between z = -5 cm and z = -1 cm, which is the essential interval for the PCM method to work. The discrepancy between the measurements and the calculated theoretical model curve in the remaining interval at the right side of Figure 4 (i.e. the interval between z = -1 cm and z = 2.5 cm) can be explained on the basis of the fact that in reality the cardiac motion does not merely involve a single moving boundary (as in the simplified model used in the calculation), but in fact involves the motion of multiple boundaries between blood and cardiac muscle tissue. The basic and essential shape of the PCM curve for the interval of interest (z = -5 cm and z = -1 cm), however, is correctly predicted by the model, thus supporting the basic principle of operation of the PCM method.
The results of the type (ii) in vivo measurements show that the average final position was reached at 2.1 cm above the CAJ, with a standard deviation of 0.2 cm. This implies that if the optimal position of the catheter tip is defined to be at 2 cm above the CAJ, the PCM method gives the right position right away. If the optimal position of the catheter tip is defined to be exactly at the CAJ, the catheter tip has to be advanced a small distance (2 cm) beyond the position produced using the PCM, which can be done safely because 2 cm is a relatively small distance.
The simple current generator used in the experiments described in this paper can be replaced easily by more advanced, FDA-approved, medical current sources using higher frequencies that can be safely applied to the patient. Examples of such patient-safe and FDA-approved current sources are described in Baan et al (6).
The animal that we used for the experiments, however, was a heavy Dalland land pig (weight 65 kg) having a very thick subcutaneous fat layer, which would be equivalent to the fat layer of a very obese patient. Despite the thick layer of fat in the animal, the results of the experiments were still favourable.
The PCM method may be used with or without stylet or guidewire: in case that a stiffener or guidewire is used, a lead connects to the part of the stylet (or guidewire) outside the patient; in case however that no stylet (or guidewire) is used, this lead is brought into connection (indirectly) with the saline-filled lumen of the catheter using a saline-filled connector piece. A further advantage of the PCM method is that the precise location of the voltage measuring electrodes on the thorax is not very critical.
In relation to the ECG method, two important remarks can be made here:
Due to the fact that in our PCM method both the main signal φ(t) and the reference signal φref (t) are available, “division” of these two signals yields a signal (PCM) that is unaffected by, e.g. atrial fibrillation.
Furthermore, the materials and devices that are needed in or on the patient in order to make the PCM method work are the same as the materials and devices needed for the ECG method: both the PCM method and the ECG method use a few standard skin electrodes, in combination with an electric lead that connects the saline-filled lumen inside the catheter (or the stylet or guidewire) to some electronics outside the patient.
In a recently improved version of our method, the measuring skin electrode m2 needs no longer to be placed below the heart, but can be placed directly (about 3 cm) below skin electrode m1. Both skin electrodes m1 and m2 are then placed at a position high on the thorax, just left of the upper part of the sternum, near the incisura jugularis. Furthermore, in this newest development, the reference electrode c2 in Figure 3 does not need to be placed on the leg, but can be placed on the lower right side of the thorax, and, more importantly, an improved suppression of the respiration effect on the signals is obtained. It is expected that these developments will improve the ease of use of our method. Furthermore it is expected that the improved suppression of the respiration effect will bring down the time consumption in Table I considerably, i.e. the target position will be reached more easily and faster.
We conclude that the combination of these two points (a) and (b) makes our PCM method specifically suited to be used in combination with the ECG method, and that adding the PCM functionality to the existing ECG method may potentially make the resulting combined method more robust and reliable, even in cases of cardiac arrhythmias.
Conclusions
A new catheter tip positioning method, the PCM method, has been developed, and the results of a first set of feasibility tests indicate that the PCM may potentially be a valuable new tool for catheter tip positioning of central venous catheters.
However, since this first set of feasibility tests has been carried out only on pigs, the conclusions that may be drawn from these tests are only preliminary and rather limited. More research is needed, including tests in human subjects, in order to establish whether this new PCM method works properly in humans as well.
The fact that the PCM method uses the same materials in and on the patient as the ECG method makes the PCM method particularly suited to work in tandem with the ECG method. The very set-up of the PCM method makes it intrinsically insensitive to cardiac arrhythmias, and the fact that the PCM method is based on blood volume changes inside the heart during the cardiac cycle, and not based on the electric activity of the heart itself, makes it suited to operate in patients with a pacemaker. Therefore, we conclude that the combination of the ECG method and the PCM method may potentially have a significant added value in patients in whom the ECG method as a stand-alone technique cannot be used properly, such as patients with atrial fibrillation or other cardiac arrhythmias, or patients with a pacemaker.
Footnotes
Acknowledgements
The authors wish to thank Cees Verlaan, Paul Grundeman, Marlijn Jansen and their co-workers from the Department of Experimental Cardiology of the UMC Utrecht for their excellent assistance.
Financial support: This research has not received financial support.
Conflict of interest: No conflict of interest.