
Abstract
Aims and Background
Prostate cancer is the most common malignant tumor in men. Serum prostate-specific antigen (PSA), Gleason score and clinical range at the time of diagnosis are important factors to predict prognosis and outcome after therapy but additional accurate and reliable biomarkers are still wanted. So far, few biomarkers of prostate cancer have been successfully implemented and are being used in clinical practice. However, modifications of E-cadherin and MMP-13 expression are likely to be involved in prostate cancer invasion and thus are potential biomarkers for prognosis.
Patients and Methods
We analyzed the concentrations of E-cadherin and MMP-13 in plasma of patients with prostate cancer at diagnosis and 3 and 6 months after the beginning of treatment and related these measures to free and total PSA and other clinical features.
Results
The concentration of E-cadherin was lower in patients with prostate cancer compared to the control group, but there was no difference in the concentration of MMP-13 between these two groups. During treatment, however, we found no significant differences between the concentrations of MMP-13 and E-cadherin, but we observed a significant positive correlation between total PSA and E-cadherin plasma concentration at the third month of treatment and between total testosterone and MMP-13 plasma concentration before the start of treatment.
Conclusions
The results suggest that these parameters could be used both in the diagnosis and prognosis of prostate cancer.
Introduction
Prostate cancer (PC) is the sixth most common cancer type in the world. As in other tumors, malignant transformation of prostate cells is a result of the accumulation of genetic mutations. The most widely used marker for PC detection in the clinic is serum prostate-specific antigen (PSA), whose ability to distinguish PC from benign prostate hyperplasia is improved by the free-to-total PSA ratio in patients with PSA between 4 and 10 ng/mL (1). However, the aggressiveness and metastatic potential of PC are difficult to predict based only on PSA screening, Gleason score and clinical parameters, which makes the use of novel molecular parameters for these traits highly necessary.
E-cadherin belongs to a class of type-1 transmembrane proteins that play important roles in cell adhesion and communication. Multiple studies have found reduced E-cadherin expression in aggressive PC, suggesting it might be a metastasis suppressor (2). Matrix metalloproteinases (MMPs), in turn, are a family of enzymes involved in the breakdown of the extracellular matrix in normal physiological processes. Normal tissue structure is a result of a balanced interaction between MMPs and the tissue inhibitors of metalloproteinases (TIMPs). These enzymes play an essential role in tumor invasion and metastasis, and MMP-13 is the one most commonly found in carcinomas (3). MMPs and their TIMPs are generally correlated with tumor differentiation.
Since modifications of E-cadherin and MMP-13 expression are likely to be involved in PC invasion, we analyzed their concentrations in plasma of patients with PC at diagnosis and during treatment, and related their concentrations to free and total PSA as well as other clinical features in order to ascertain if these measures could be of clinical help in establishing the metastatic risk in patients with PC.
Patients and Methods
This study was carried out in accordance with the ethical principles and was approved by the local ethics committee. After having obtained the patients' informed consent, we collected about 15.0 mL of peripheral blood from 29 patients with PC treated at the Urology Clinic of the Faculty of Medicine of ABC for plasma evaluation of E-cadherin, MMP-13, free and total PSA, and testosterone at diagnosis and after 3 and 6 months of treatment. The follow-up schedule also included other clinical examinations. Only patients with prostate adenocarcinoma without any previous treatment were included in the study; patients were excluded if they had benign prostatic hyperplasia, HIV or hepatitis B or C infection, or autoimmune diseases. The control group of healthy males consisted of 10 men with total PSA ≤1.5 ng/mL and normal digital rectal examination; the men in the control group had the same average age as the patients.
Plasma concentrations of E-cadherin and MMP-13 were determined using enzyme immunoassay (R&D Systems, Inc and IBL International, respectively). PSA and testosterone were measured using the commercially available Siemens 06607631 Immulite® testosterone kit and Siemens 06607968 Immulite® third-generation PSA kit, respectively. Histological grade according to the Gleason score was assessed on stained sections in accordance with the WHO International Classification IARC/WHO Classification of Tumours. Histologically, all tumors were adenocarcinomas.
For variables of approximately normal distribution (patients' age), Student's t-test was used to compare the mean values of independent variables. In other cases (biomarkers), differences between groups were analyzed with the Mann-Whitney U-test. Correlations between pairs of parameters were analyzed using Spearman's correlation coefficient. To predict the grade of tumor, receiver-operating characteristics (ROC) curves were generated. A p value <0.05 was accepted as the limit of statistical significance. The calculations were performed using the commercial SPSS software package.
Results and Discussion
The clinical characteristics of patients and controls are summarized in the supplemental material (Supplementary Tables S-1 and S-II, respectively. Available online at www.tumorijournal.com).
At diagnosis, the E-cadherin concentration was lower in patients with PC than in the control group (p<0.001) (Fig. 1). Decreased expression of E-cadherin in patients with PC was also described previously (4, 5), and this finding was associated with a worse prognosis. However, as can be seen in Figure 1, there was no difference in the MMP-13 concentration between the 2 groups (p = 0.2085). Szarvas et al (6) also found no significant difference in MMP-13 expression between PC patients and healthy men, despite the known involvement of MMPs in PC. Fernandez-Gomez et al (7), using tissue microarray to evaluate 7 different types of metalloproteinase, showed a significant association between increased expression of MMP-13 and elevated levels of PSA. It is clear, thus, that different methodologies could be a limiting factor in associating MMP-13 with PSA in patients with PC, since the serological results described here did not match those obtained by tissue microarray (Fig. 1).
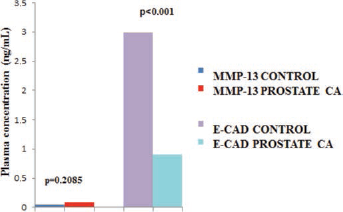
Comparison of MMP-13 and E-cadherin (E-CAD) plasma concentrations (ng/mL) between controls and patients with prostate cancer.
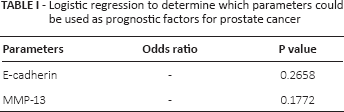
Logistic regression was performed to determine the parameters that could be used as prognostic factors for PC (Tab. I and Fig. 2).
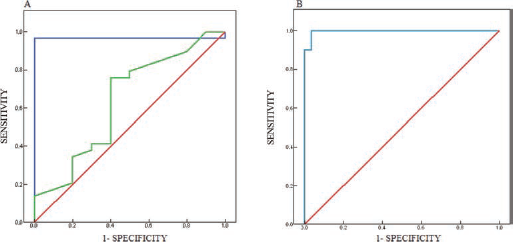
Total PSA versus MMP-13 (A) and E-cadherin (B) ROC curves. Red lines represent reference; blue lines, total PSA; green lines, MMP-13 (A) or E-cadherin (B). The areas obtained from the ROC curves were 0.97 for total PSA (p<0.001), 1.00 for E-cadherin (p<0.001), and 0.64 for MMP-13 (p = 0.204).
Logistic regression to determine which parameters could be used as prognostic factors for prostate cancer
During treatment, however, using the nonparametric Friedman test, we found no significant differences between the concentrations of MMP-13 (p = 0.966) and E-cadherin (p = 0.166) at diagnosis and after the third and sixth months of treatment (p = 0.786). However, we observed a significant positive correlation (Spearman's correlation coefficient) between total PSA and E-cadherin plasma concentration at the end of the third month of treatment (Tab. II). Our results are in agreement with those reported by Gravdal et al (4), although these authors did not indicate the times of measurement during treatment.
Spearman's correlation coefficient for total and free PSA, E-cadherin, and MMP-13 at 0, 3 and 6 months of treatment
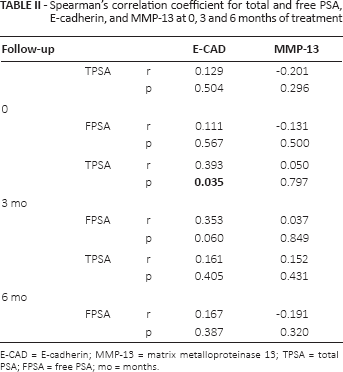
E-CAD = E-cadherin; MMP-13 = matrix metalloproteinase 13; TPSA = total PSA; FPSA = free PSA; mo = months.
Spearman's correlation coefficient also showed a significant positive correlation between total testosterone and MMP-13 plasma concentration before the start of treatment. On the other hand, a negative correlation was observed after the sixth month of treatment (Tab. III). The E-cadherin plasma concentration showed a negative correlation with total testosterone after the third month of treatment and with free testosterone after the third and sixth months of treatment.
Spearman's correlation coefficient between total and free testosterone, MMP-13 and E-cadherin plasma concentrations at 0, 3 and 6 months of treatment
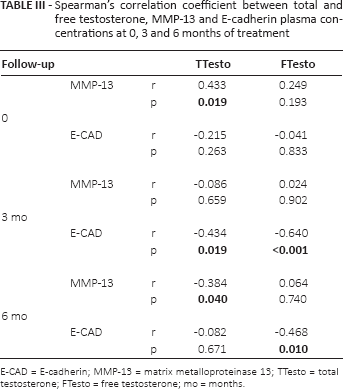
E-CAD = E-cadherin; MMP-13 = matrix metalloproteinase 13; TTesto = total testosterone; FTesto = free testosterone; mo = months.
At the initial stages, PC is dependent on androgens for growth. However, prostate tumors eventually recur due to the transition from an androgen-dependent to an androgen-independent state, leading to highly metastatic disease for which there is no effective therapy available (8). Interference in tumor biology promoted by treatment in patients with PC has been previously reported by our group (9, 10). It is known that increased circulating E-cadherin levels may have different causes; however, the involvement of testosterone in this process is still unknown, despite reports in the literature (11).
Our results on the E-cadherin plasma concentration suggest that testosterone and PC markers were associated with tumor progression to metastasis. In 2006, Buhmeida et al (12) found that reduced levels of E-cadherin were correlated with advanced Gleason score (p = 0.003). However, these results were obtained with immunohistochemistry, while the E-cadherin and MMP-13 concentrations in our study were measured in plasma.
There was no difference between E-cadherin and MMP-13 plasma levels in the group with perineural invasion.
Conclusions
The concentration of E-cadherin was lower in patients with PC compared to the control group, but there was no difference in the concentration of MMP-13 between the 2 groups. These results suggest that these parameters could be used both in the diagnosis and prognosis of PC.
Footnotes
Financial support: This work was funded by the Fundação de Amparo à Pesquisa do Estado de São Paulo (FAPESP: 10/50490-6). FSG and BCAA were supported by a CAPES postdoctoral fellowship; RKK was supported by a UNIEMP doctoral fellowship.
Conflict of interest: The authors have no conflict of interest.