
Abstract
Background and aims
The p73 gene has different isoforms with opposing anti- and pro-apoptotic functions. The pro-apoptotic activities are inhibited by overexpression of the dominant ΔNp73 isoform. The aim of this study was to detect the expression of the TAp73 and ΔNp73 isoforms in Egyptian patients with malignant lymphoid neoplasms. Their expression was analyzed by quantitative RT-PCR.
Patients and Methods
The study included 30 B-NHL patients, 24 T-NHL patients, 16 ALL patients, 18 CLL patients, 22 patients with reactive lymphoid hyperplasia, and 6 healthy control subjects.
Results
ALL and CLL patients expressed both isoforms at higher levels compared to lymphoma patients. Higher expression of TAp73 was found in both B-NHL and T-NHL (around 4-fold and 16-fold, respectively) in comparison to ΔNp73 (2-fold and 14-fold, respectively). In CLL patients both isoforms showed higher expression levels in comparison to normal peripheral blood lymphocytes controls: nearly 27-fold for TAp73 and 233-fold for ΔNp73. All ALL patients showed higher expression of both studied isoforms than controls (9-fold for TAp73 and 386-fold for ΔNp73). The highest ΔNp73 expression along with a higher ΔNp73/TAp73 ratio (67-fold) was found in ALL patients compared with CLL patients (21-fold).
Conclusions
A considerable number of lymphoma patients lacked the expression of either or both isoforms, while all lymphoid leukemia patients expressed both isoforms. The expression pattern differences of p73 isoforms may reflect differences in the biology of these malignancies.
Introduction
The p73 gene is a member of the p53 family that shows similarities to p53. It was suggested that p73 is a tumor suppressor gene like p53 (1), as it is located on chromosome 1p36, a region frequently deleted in many human tumors (2). The transcription factor p73 has different isoforms with opposing anti- and pro-apoptotic functions. The pro-apoptotic activities of the transcriptionally active p73 isoforms are opposed by the anti-apoptotic activities of ΔNp73 isoform overexpression (3).
DNA-damaging agents or activation of selected oncogenes activate p73 gene expression and induce TAp73 to promote apoptosis and cell cycle arrest (1). ΔNp73 can affect these activities either by competing for DNA binding sites or directly by binding and inhibiting transcription (4). So the overall activity stems from the expression level of every isoform rather than the activities of single isoforms. The relative expression level is maintained at the transcriptional and posttranslational levels.
The present work aimed to study the expression pattern of the two isoforms, TAp73 and ΔNp73, in Egyptian patients with lymphoproliferative neoplasms including acute lymphoblastic leukemia (ALL), chronic lymphoid leukemia (CLL), B-cell non-Hodgkin lymphoma (B-NHL) and T-cell non-Hodgkin lymphoma (T-NHL).
Patients and Methods
Formalin-fixed paraffin-embedded (FFPE) tissue blocks were obtained from the Pathology Department of the National Cancer Institute-Cairo University after histological diagnosis and used for RNA extraction. In most patients, lymphoma had almost effaced the lymph nodes’ normal architecture. The lymphoma patients included 30 patients with B-NHL (25 diffuse large B-cell lymphoma and 5 follicular lymphoma) and 24 patients with T-NHL. After the patients had given their informed consent, peripheral blood samples from 16 patients with ALL and 18 patients with B-CLL were obtained and diagnosed according to standard clinical and laboratory findings. Cytogenetic abnormalities for the ALL cohort included t(9;22) (q34;q11) in only 2 patients, while the CLL cohort had trisomy 12 in 9 patients, del 13q14.3 in 5 patients, and del 17p13.1 in 4 patients. All procedures followed were in accordance with the ethical standards of the Helsinki Declaration. Mononuclear cells were purified by density gradient centrifugation from peripheral blood and used for RNA extraction. Twenty-two FFPE tissue blocks from patients with reactive hyperplasia and 6 peripheral blood control samples were used as the reference for expression of TAp73 and ∆Np73 in lymphoma and leukemia specimens, respectively.
RNA extracted from tissue specimens and peripheral blood was automated on QIAcube (Qiagen, Germany) using an RNeasy FFPE Kit (Qiagen Cat. No. 74404) and QIAamp RNA Blood Mini Kit (Qiagen Cat. No. 52304), respectively, according to the manufacturer's instructions. cDNA was synthesized from 10 µL RNA using a High-Capacity cDNA Reverse Transcription Kit (Applied Biosystems, PN 4368814) in a 25-µL reaction volume according to the manufacturer's instructions.
For TAp73 and ΔNp73 gene expression, TaqMan-based quantitative RT-PCR was performed using the 7500 Fast Real-Time PCR System (Applied Biosystems, Foster City, CA, USA). The quality of cDNA was confirmed by parallel PCR amplification of the beta-actin gene. For beta-actin analyses, primers and probes were developed by Assay on Demand (Hs99999903_m1, Applied Biosystems). For TAp73 and ΔNp73 analysis the primers and probes described by Cuadros et al (5) were used: TAp73 forward primer 5′-TTG AAC TGG GCC ATG ACA GA-3′, reverse primer 5′-CCA GCA TGG ACG TCT TCC A-3′, and TaqMan probe 5′-TAG AGG GCA TGA CTA C-3′ (FAM-probe); ΔNp73 forward primer 5′-GAA GGT GGA GCT GGG TTG TG-3′, reverse primer 5′-GCC ACG GCC CAG TTC AAT-3′, and TaqMan probe 5′-CAG CAC CAT GGA CCA G-3′ (FAM-probe) (Applied Biosystems).
The differences in threshold cycles (∆Ct) were obtained by subtracting the Ct value of the internal reference (beta-actin) from the Ct values of the evaluated genes. The relative fold value was obtained by the formula 2-(∆∆Ct), using the median ∆Ct value of reactive hyperplasia and peripheral blood control samples as the reference for TAp73 and ∆Np73 expression in lymphoma and leukemia specimens, respectively.
Statistical analysis
Data were statistically described in terms of mean, standard deviation, median and range, or frequencies and percentages when appropriate. Comparison of numerical variables between the study groups was done using the Mann-Whitney test for independent samples when comparing 2 groups and the Kruskal-Wallis test when comparing more than 2 groups. Correlations between various variables were identified using Spearman's rank correlation equation. P values less than 0.05 were considered significant. All statistical calculations were done using SPSS (Chicago, USA) version 15 for Microsoft Windows.
Results
TAp73 and ∆Np73 expression was significantly higher in all of the studied groups, with the highest expression of TAp73 in CLL patients, whereas the highest expression of ∆Np73 in ALL patients. Contrary to leukemia patients, not all lymphoma patients expressed TAp73 and ∆Np73 (Tab. I).
Expression of TAp73 and ∆Np73 isoforms in malignant lymphoid neoplasms groups expressed as fold change compared to the benign counterparts
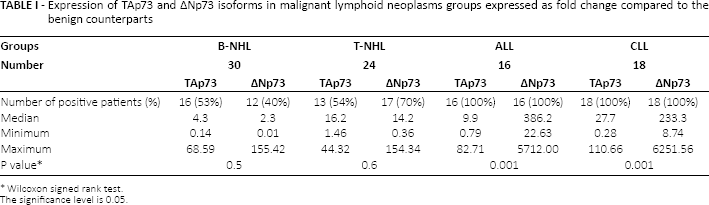
Wilcoxon signed rank test.
The significance level is 0.05.
Fourteen of 30 (46.7%) patients with B-NHL showed no expression of TAp73, 18 (60%) patients showed no expression of ΔNp73, while 12 patients (40%) lacked expression of both. As regards patients with T-NHL, 11 of 24 (45.8%) patients showed no expression of TAp73 and 7 (29.2%) patients showed no expression of ΔNp73, while only 3 patients (12.5%) lacked expression of both.
Detailed analysis of the expression pattern in lymphoma patients compared to individuals with benign reactive follicular hyperplasia showed higher expression of TAp73 in both B-NHL and T-NHL (around 4-fold in B-NHL and 16-fold in T-NHL) in comparison to ΔNp73 (2-fold and 14-fold in B-NHL and T-NHL, respectively) (Tab. II). The ALL group showed a higher ΔNp73/TAp73 ratio (67-fold) than CLL patients (21-fold) (Tab. III).
Statistical comparison between the studied groups as regards the TAp73 and ∆Np73 expression levels
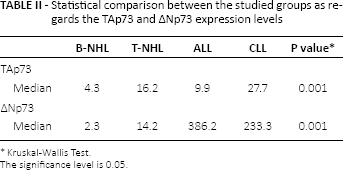
Kruskal-Wallis Test.
The significance level is 0.05.
∆Np73/ TAp73 ratio in leukemia patients
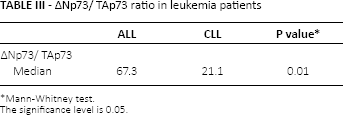
Mann-Whitney test.
The significance level is 0.05.
CLL patients were classified according to the modified Rai staging system (6). The highest expression of ΔNp73 was seen in the high-risk group (stage III, IV) with a 35-fold increased ΔNp73/TAp73 ratio, followed by the intermediate-risk group (stage I, II) (26-fold); the lowest expression level was found in the low-risk group (stage 0) (2.5 fold) (Tab. IV).
∆Np73/TAp73 ratio in different groups of CLL patients
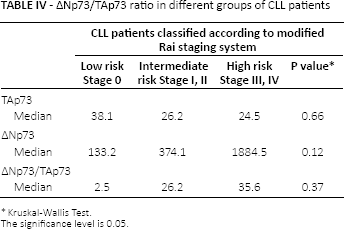
Kruskal-Wallis Test.
The significance level is 0.05.
Discussion
Increased expression levels of wild-type p73 were suggested to be present in different types of malignancies compared with normal tissues (5, 7, 8), but the presence of the different p73 isoforms in tumors remains in question due to the complicated genomic organization of this gene (5). The p73 gene gives rise to several NH2- and COOH-terminal isoforms with opposite functions (5, 9). The TAp73 isoform is derived from the P1 promoter and can induce apoptosis and cell cycle arrest. ΔTAp73 transcripts are generated by aberrant splicing (p73Δexon2, p73Δexon2/3, ΔN′p73) and alternative promoter usage of a second promoter (ΔNp73) (5, 10). These N-terminally-truncated transactivation-deficient p73 isoforms have biological activities and properties opposite to TAp73 variants (5, 11).
In the present study the expression of the two isoforms was higher in all studied patients, with variable fold expression in comparison to the normal or benign counterparts, indicating a role of these genes in the pathogenesis of these neoplasms.
A considerable number of the studied patients with NHL of either a B or T phenotype lacked the expression of either or both isoforms. Supporting this finding, other authors observed that p73 is monoallelically expressed in normal kidney, lymphocytes and neuroblastoma cell lines (12, 13), leading to the inactivation of p73, which would need only a single event resulting in loss of the expressed allele. Since p73 gene mutation is rare, DNA methylation may be an alternative mechanism for gene silencing (14, 15). DNA methylation alters the transcription factors binding to gene-regulatory regions and is accompained by a repressive chromatin structure (16). Considering the possibility that p73 is both a tumor suppressor and an imprinted gene, the lack of expression in some of the lymphoma patients in this study could be attributed to the methylation of the p73 CpG island and transcriptional silencing of this gene.
Detailed analysis of the expression pattern in comparison to benign reactive follicular hyperplasia showed higher TAp73 than ΔNp73 expression in both B-NHL and T-NHL patients. This may be consistent with previous reports showing overexpression of p73 in colorectal, hepatocellular, ovarian and lung cancers (17-18-19), and stating that p73 gene overexpression may lead to p53-inactivation in wild-type-p53 tumors through competition for DNA binding sites (20).
Since the p73 gene is transcribed into different isoforms (8, 21), the overall p73 activity stems from the expression level of every isoform rather than the activities of the single isoforms. So increased ΔNp73 expression is expected to be a hallmark of cancer, although our study found statistically insignificant slightly higher TAp73 expression in both B-NHL and T-NHL. The same findings have been demonstrated by Conforti et al (22), who found higher expression of TAp73 isoform in the cancer cell lines, with an impressive imbalance between the two isoforms in some cell lines. Interestingly, they reported that TAp73 and ΔNp73 were equally expressed in T-cell leukemia cells, similar to our T-NHL patients. Also, one of their important findings is that the differential expression of TAp73 and ΔNp73 may be tissue specific. Higher relative levels (>10-fold increased) of TAp73 mRNA expression were detected in kidney, spleen and bladder, while intermediate levels (<10-fold) were detected in gut, lung and liver. Conversely, ΔNp73 was the main isoform detected in tongue, uterus and salivary gland, and similar levels of TAp73 and ΔNp73 were expressed in ovary, colon and brain (22). So the role of TAp73 and ΔNp73 in normal development and tumorigenesis may be more complicated than what has been suggested as an imbalance between TAp73and ΔNp73 expression.
Contrary to lymphoma cases, all studied ALL and CLL patients expressed both isoforms. Furthermore, the expression levels of both TAp73 and ΔNp73 were significantly higher in leukemia than lymphoma patients. Analysis of the expression pattern of the two isoforms showed higher expression of ΔNp73, nearly 67-fold in ALL and 21-fold in CLL, in comparison to TAp73.
In the studied CLL patients, both TAp73 and ΔNp73 showed higher expression levels in comparison to controls. This is in agreement with the results of Novak et al (20), who reported overexpression of the p73 gene and a positive correlation of p73α protein expression with high-risk CLL stages.
The p73 gene is overexpressed in CLL, which is characterized by the accumulation of senescent, non-proliferating cells with disrupted apoptosis (20, 23). It induced cell cycle and growth arrest as well as apoptosis in a group of cell lines (24), whereas cell cycle and growth arrest induction but without apoptosis and in the presence of replicative senescence was observed in other cell lines (25, 26). Thus, the p73 expression effect may be tissue specific (23, 27), and this may explain the paradox that this gene is overexpressed in a variety of neoplasms with disrupted apoptosis including CLL but induces apoptosis in other cell types (20). The ΔNp73 variant, which is a prominent negative inhibitor of TAp73, was also overexpressed in the studied patients. Analysis of ΔNp73/TAp73 showed higher ΔNp73 expression (21-fold). These findings suggest that the balance between the expressed variants may be indicative of their function and determine whether replicative senescence and/or inhibited apoptosis takes a leading role in the molecular pathogenesis of CLL.
CLL patients were classified according to the modified Rai staging system (6). The highest TAp73 expression was found among the low-risk group, while lower expression levels were present in the intermediate- and high-risk groups, which may suggest that the nearly balanced expression of the two studied isoforms may be associated with low-risk CLL patients and high expression of ΔNp73 with its inhibitory effect on TAp73 transcription is associated with intermediate- and high-risk groups.
ALL patients showed the highest expression level of ΔNp73 among the four studied groups and a higher ΔNp73/TAp73 ratio (67-fold) compared to CLL patients. This may explain the high proliferation rate characteristic of ALL with subsequent ΔNp73 inhibition of the regulatory role of TAp73 in the cell cycle. Methylation of the p73 gene may be another possible mechanism in this loss of the TAp73 regulatory role. Corn et al (28) reported that p73 was aberrantly methylated in 30% of ALL and Burkitt's lymphomas, and this promoter region methylation was tumor specific since it was not detected in bone marrow or normal lymphocytes, resulting in diminished p73 expression.
In conclusion, a considerable number of lymphoma patients lacked the expression of either or both isoforms, while all lymphoid leukemia patients expressed both isoforms. The differences in p73 expression patterns between CLL, B-NHL, T-NHL and ALL may reflect differences in the biology of these lymphoid neoplasms. The role of TAp73 and ΔNp73 may be more complicated than what has been suggested as an imbalance between these two isoforms expressions.
Footnotes
Acknowledgment
We thank our patients for their participation in our study.
Financial support: This work was partially funded by the Faculty of Medicine, Cairo University, Cairo, Egypt.
Conflict of interest: The authors state that they have no conflict of interest related to this paper.