






Abstract
Purpose:
In the last decade contrast-enhanced magnetic resonance imaging (MRI) has gained a growing role as a complementary tool for breast cancer diagnosis. Currently the relationship between the kinetic features of a breast lesion and pathologic prognostic factors has become a popular field of research. Our aim is to verify whether breast MRI could be considered a useful tool to predict Ki-67 score, thus resulting as a breast cancer prognosis indicator.
Methods:
From June to December 2014, we enrolled patients with breast cancer who underwent preoperative dynamic contrast-enhanced MRI at the local health agency. We analyzed the time-signal intensity curves calculating the mean values of the following parameters: the basal enhancement (Ebase), the enhancement ratio (ENHratio), the maximum enhancement (Emax), and the steepest slope of the contrast enhancement curve (Smax). Scatterplots and Pearson correlation test were used to investigate the eventual associations among these parameters.
Results:
A total of 27 patients underwent breast MRI during the study period. The mean ± SD Ki-67 percentage was 27.03 ± 16.8; the mean Emax, Smax, Ebase, and ENHratio were 433.9 ± 120.2, 267.3 ± 96.8, 165.5 ± 77.1, and 187.1 ± 94.8, respectively. Scatterplots suggest a positive correlation between Ki-67 and both Emax and Smax. The correlation tests between Ki-67 and Emax, Ki-67 and Smax showed statistical significance.
Conclusions:
Our preliminary data suggest that enhancement pattern is closely linked to breast cancer proliferation, thus proving the relationship between more proliferating tumors and more rapidly enhanced lesions. This is hypothesis-generating for further studies aimed at promoting breast MRI in the early estimation of cancer prognosis and tumor in vivo response to chemotherapy.
Introduction
In the last decade, contrast-enhanced magnetic resonance imaging (MRI) has become an important complementary tool in the management of breast cancer. Tumor neoangiogenesis makes the breast cancer visible at MRI as a lesion with a specific signal enhancement after peripheral administration of contrast material. Several studies have shown nearly 100% sensitivity for breast MRI, while a wide variation in specificity has been observed according to the radiologist’s experience in the evaluation of the morphologic features and the enhancement pattern (1-4). Clinical indications of breast MRI are still object of debate. MRI is currently employed in selected cases for preoperative staging, monitoring breast implants integrity, detecting local recurrences, identifying primary malignancy in cancer of unknown primary site syndrome, assessing imaging response after neoadjuvant chemotherapy, and screening in high-risk women (5, 6). Once the leading role of MRI in the diagnostic phase in a selected population had been proved, more recent studies have investigated its relevance in the assessment of breast cancer prognosis (7-24). The prognostic factors in patients with breast cancer include lymph node status, tumor size, histologic type, grading, lymph-vascular invasion, overexpression of human epidermal growth factor receptor type 2 (HER2), hormonal receptor status, and young age. Some authors have investigated correlations between MRI features and traditional prognostic factors, whereas few studies looked at the eventual association between MRI enhancement features and the Ki-67 proliferation index; results are controversial (3, 7). Ki-67 is the common term for a protein that was originally identified as the nuclear antigen of a monoclonal mouse antibody. Ki-67 protein is absent in quiescent cells, while universally expressed in proliferating cells. The well-known immunohistochemistry Ki-67 score or labeling index generally refers to the percentage of cancer cells that stain positively. Ki-67 expression occurs throughout the cell cycle, ranging from weakly staining foci to intense staining when the nuclear membrane disrupts during mitosis. In recent years, Ki-67 has gained interest as a potential prognostic biomarker for breast cancer. Its use has been widely recognized in breast cancer subtype classification as well as in adjuvant and neoadjuvant settings as a predictive tool of pharmacologic response (25-27).
The rationale of this study derives from the association (p<0.05) between neoangiogenesis and Ki-67 overexpression found by some authors (10-12). Since angiogenesis is known to play a key role in breast MRI tumor enhancement, we aimed to verify whether breast MRI could be considered a useful tool to predict Ki-67 score, thus resulting as a surrogate of breast cancer prognosticator and tumor in vivo response to chemotherapy.
Methods
Patients
From June to December 2014, we prospectively enrolled patients with breast cancer who were scheduled for surgery in several hospitals in Naples and were undergoing preoperative dynamic contrast-enhanced MRI at the local health agency. Inclusion criteria were the presence of a breast lesion at mammogram and/or ultrasound scan proved to be breast cancer at the cytology or core biopsy. Exclusion criteria were contraindications to MRI or contrast, suspicion of carcinoma in situ only, and previous breast surgery. Surgery was performed within 2 weeks from MRI and all histopathology examinations were evaluated. Routine pathologic assessment by board-certified breast pathologists included histotype, lymph node status, estrogen/progesterone receptor status, HER2/neu expression, tumor grading, and Ki-67 index. In patients with multifocal, multicentric carcinoma, the largest lesion was considered for statistical analysis.
All patients were consented to join the study and the study was approved by the local ethics committee.
Dynamic contrast-enhanced MRI
The acquisition of MRI was realized with a high-field 1.5 T scanner (Magnetom Avanto®; Siemens Healthcare, Munich, Germany) and a dedicated breast array coil (Siemens Healthcare). All patients were positioned prone.
We applied the standard breast MRI protocol including an axial 2 D T2-weighted short tau inversion recovery sequence (repetition time [TR]/echo time [TE]/inversion time [TI] 7,200/85/150 ms, field of view [FOV] 380 × 380 mm, matrix 512 × 358, slice thickness 3 mm, resolution 1.1 × 0.7 × 3.0 mm, acquisition time 3.30 min), a precontrast and postcontrast sagittal T1-weighted and an axial 3 D gradient echo pulse sequence (TR/TE 21/4.8 ms, FOV 180 × 180 mm, matrix 512 × 512, slice thickness 2 mm, resolution 0.4 × 0.4 × 2.0 mm, acquisition time 4.42 min; TR/TE 11/4.8 ms, FOV 360 × 360 mm, matrix 512 × 430, slice thickness 3 mm, resolution 0.8 × 0.7 × 3.0 mm, acquisition time per time point 1:07 min, respectively), with one acquisition before contrast injection and acquisitions up to 6 minutes after. After the first acquisition, the contrast media (0.1 mmol/kg body weight gadobutrol, Gadovist®; Bayer Schering Pharma, Berlin, Germany) was injected into the cubital vein with an MRI compatible power injector (Spectris®; Medrad, Pittsburgh, PA, USA) with a flow of 1.0 mL/s followed by a 20-mL saline flush; then 5 other dynamic images were acquired.
The analysis of morphologic and contrast-enhanced kinetic data was performed by 2 radiologists with experience in breast MRI and they were blind to histopathology and clinical data other than diagnosis of breast cancer. The time-signal intensity curves (Fig. 1) were obtained by using operator-defined regions of interest (ROI) at the precontrast and each postcontrast series. The ROI were drawn as circular 5-pixel areas and measurements were performed in at least 3 points within the same highly enhanced lesion. The maximum intensity projection algorithm was applied on dynamic imaging and the measurements followed the dynamic MRI protocol called mean curve. After reporting results, the time-signal intensity curves were analyzed and the following parameters calculated:
The basal enhancement Ebase, which is the glandular enhancement at time zero
The enhancement ratio ENHratio (or percentage enhancement), which is a common MRI parameter showing the relative increase in signal intensity (Sn) at each postcontrast measurement compared with the precontrast phase (SPRE)
ENHratio = [(Sn−SPRE)/SPRE]*100
The Emax, which is the absolute value of maximum enhancement obtained
The steepest slope of the contrast enhancement curve, which is calculated as the slope of the line passing through time zero enhancement (T0, Ebase) and the first peak enhancement (T0, Efirst peak)
Smax = (Efirst peak−Ebase)/(Tfirst peak−T0)
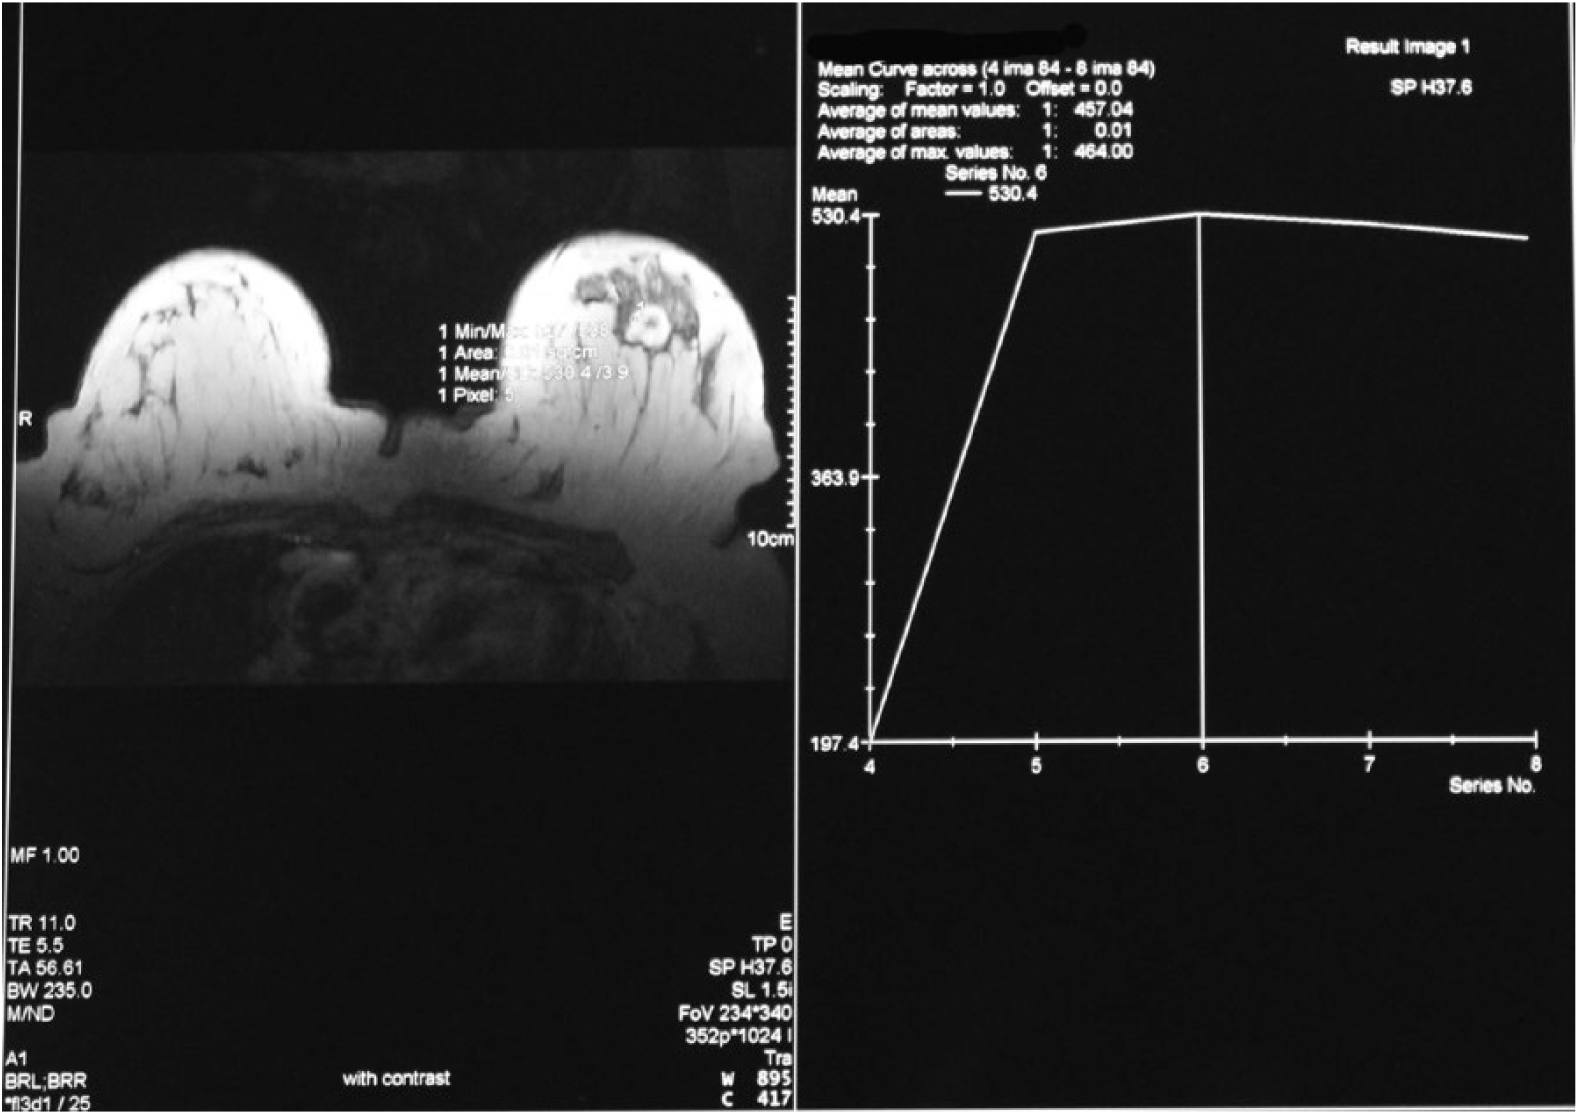
Magnetic resonance imaging shows breast cancer on the left and enhancement curves on the right.
Each value was noted on an Excel spreadsheet and the database with all patients and MRI data was updated prospectively.
Histologic analysis
All patients who were enrolled in this study underwent tumor excision and all lesions were analyzed. The histologic specimens were stained with hematoxylin & eosin. Two pathologists examined the sample in single blind (without knowledge of the previous workup) and tumors were typed according to the WHO classification. The histologic grade was assessed by using the method of Elston and Ellis, based on a numerical scoring system for tubule formation, pleomorphism, and mitotic count. In addition, immunohistochemical staining was carried out for assessing estrogen receptor (ER), progesterone receptor (PR), HER2 status, and Ki-67 index.
Statistical analysis
We analyzed E0, ENHratio, Emax Smax, and Ki-67 values, calculating all mean values, standard deviation, and normal distribution. The nonparametric correlation tests were used to examine bivariate associations between Ki-67 and each single continuous variable. Pearson coefficient, Spearman rho, and Kendall tau were calculated to assess the statistical significance of any eventual association. Scatterplots were constructed to investigate the possible relationship between each 2 independent variables.
The statistical analyses were performed by using SPSS 9.0 for Windows (Statistical Package for Social Sciences; SPSS, Chicago, IL, USA).
Results
A total of 27 patients underwent preoperative breast MRI for breast cancer during the study period. The mean age was 51 ± 8.8 years (range 33-71). A total of 24 of the 27 cases were classified as infiltrating ductal carcinoma. Two of these showed mucinous differentiation. A total of 22 of the 24 were unifocal, 1 case was found to be multifocal, whereas only 1 case was multicentric. The remaining 3 out of 27 cases were classified as infiltrating lobular carcinoma. All clinical features are recorded in Table I. The mean ± SD Ki-67 percentage was 27.03 ± 16.8, while mean values for Emax, Smax, Ebase, and ENHratio were 433.9 ± 120.2, 267.3 ± 96.8, 165.5 ± 77.1, and 187.1 ± 94.8, respectively. Scatterplots are shown in Figure 2 and suggest a positive correlation between Ki-67 and both Emax and Smax. All variables considered were continuous and not normally distributed. Results from the correlation tests are shown in Table II. There is a correlation between Ki-67 and Emax and between Ki-67 and Smax, at the level of 0.01 and 0.05, respectively.
Clinical and magnetic resonance imaging features of the population
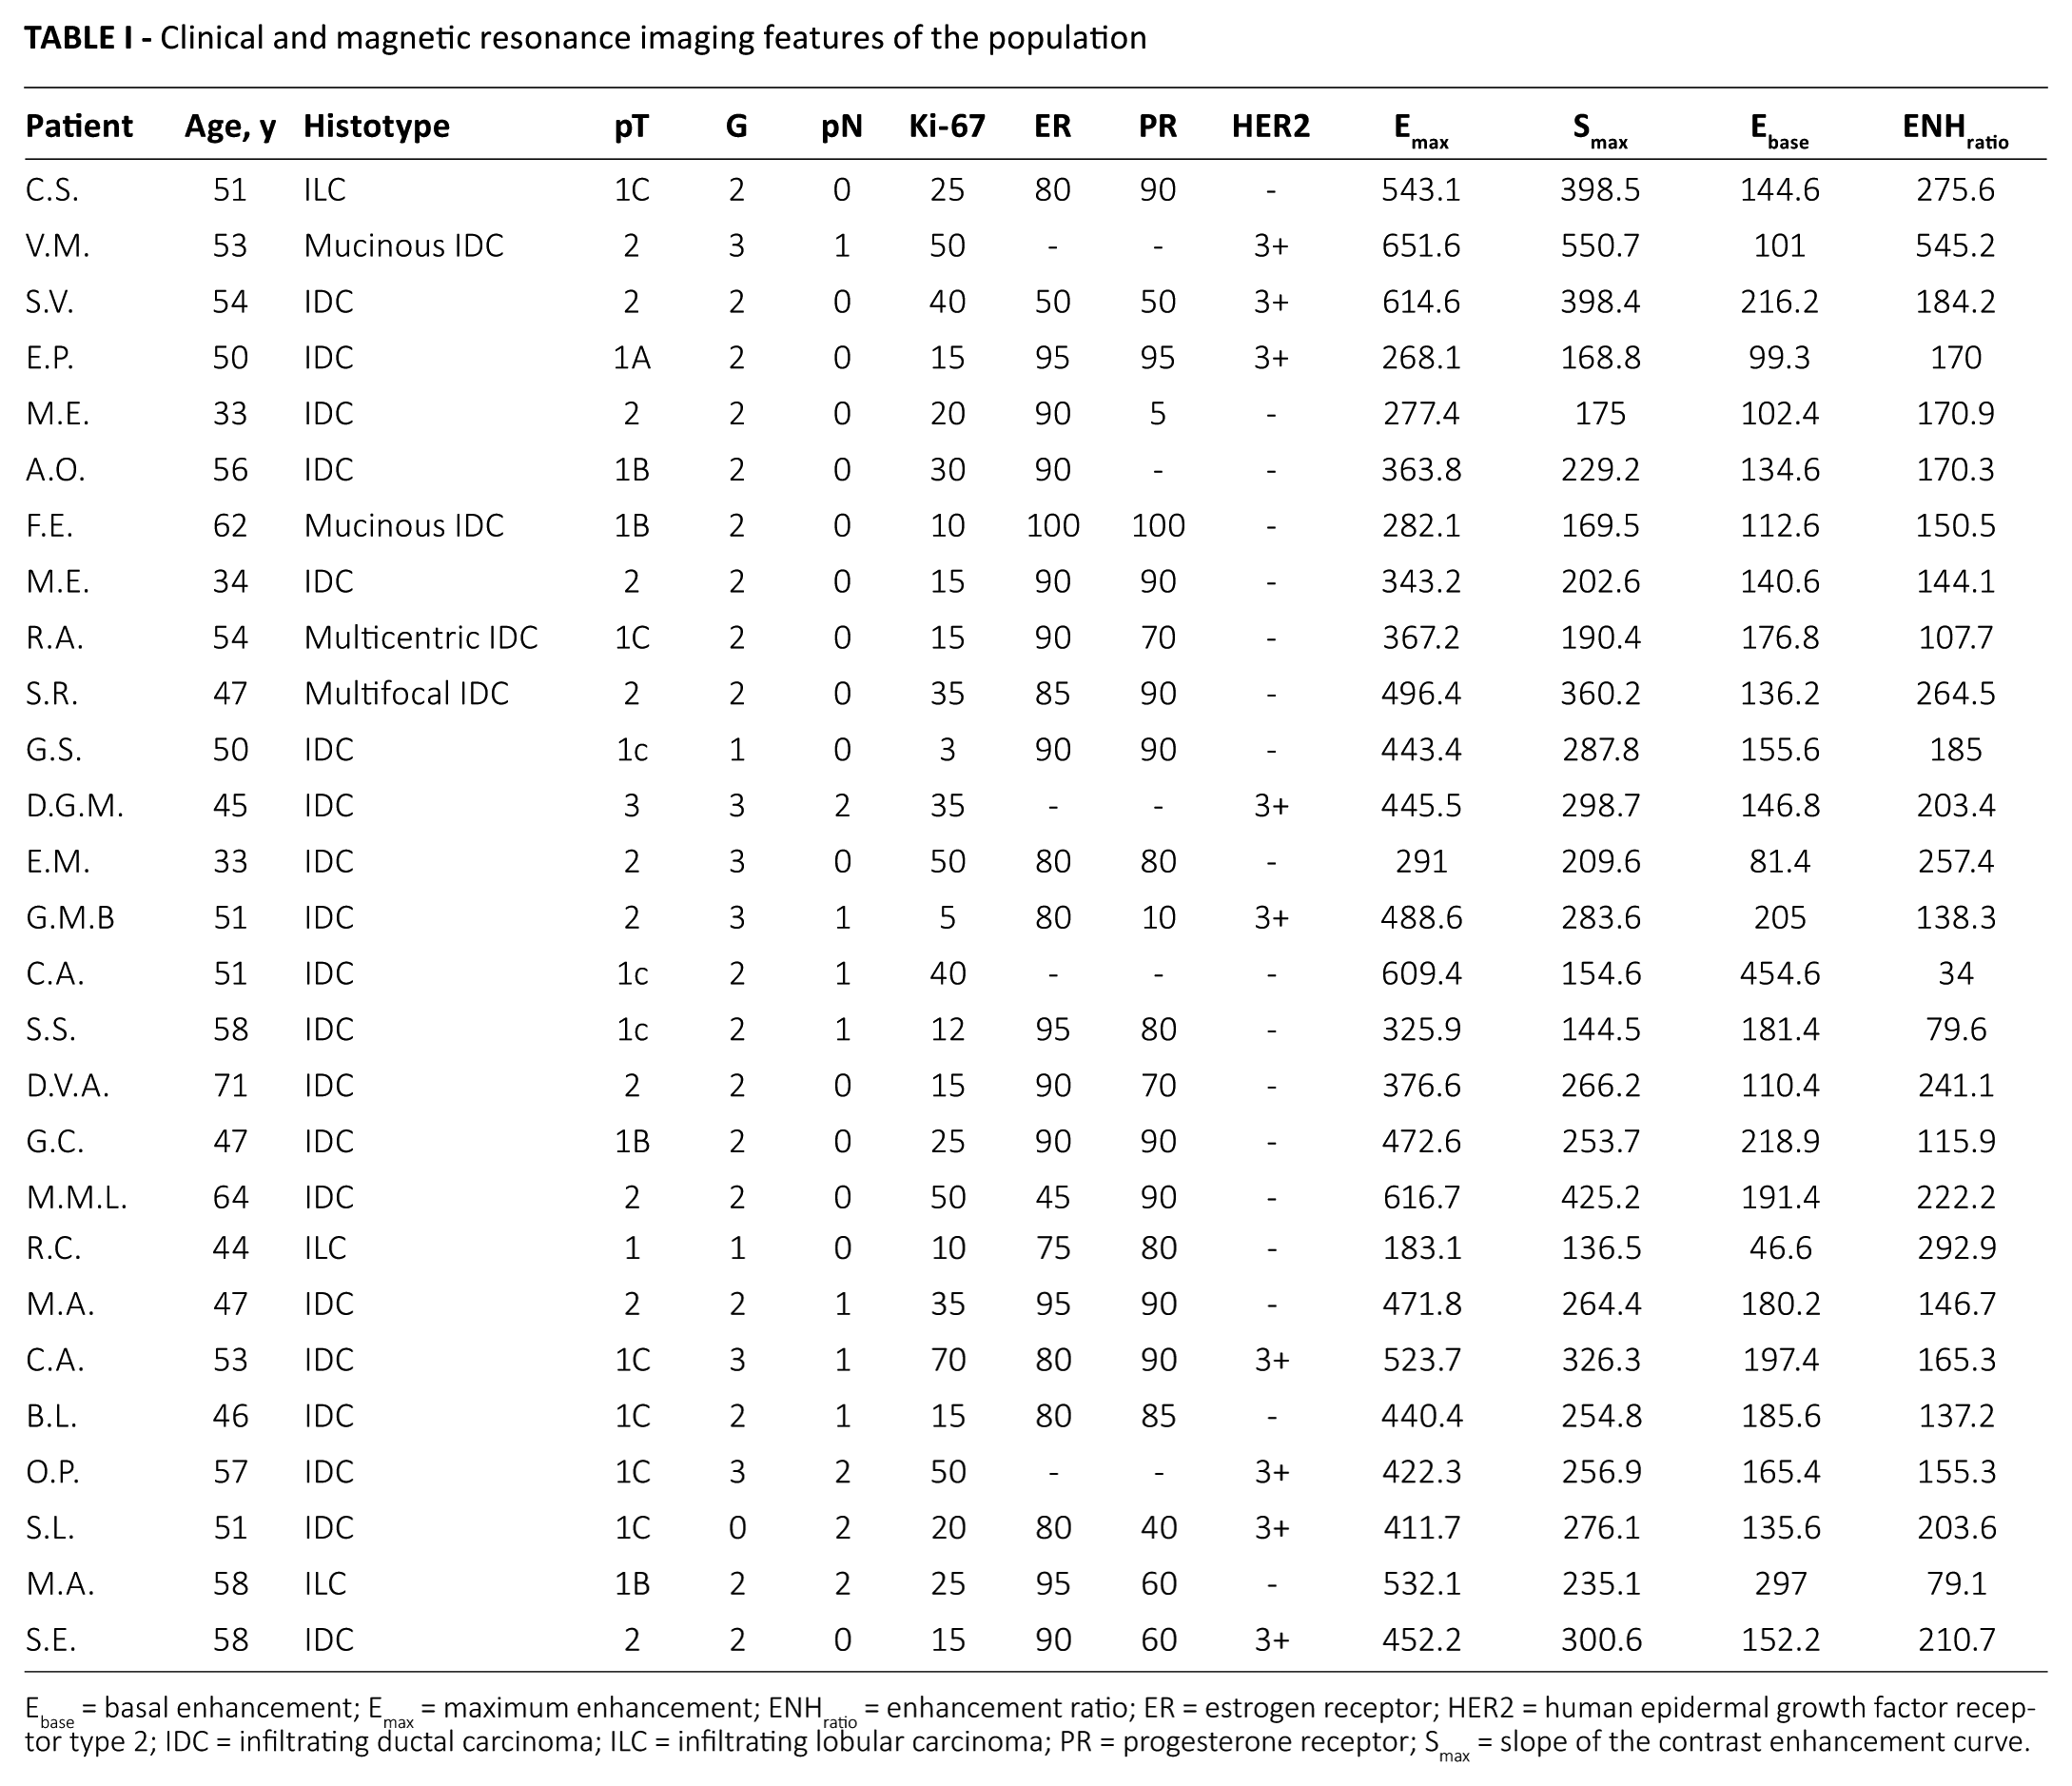
Ebase = basal enhancement; Emax = maximum enhancement; ENHratio = enhancement ratio; ER = estrogen receptor; HER2 = human epidermal growth factor receptor type 2; IDC = infiltrating ductal carcinoma; ILC = infiltrating lobular carcinoma; PR = progesterone receptor; Smax = slope of the contrast enhancement curve.
Results of the bivariate correlation
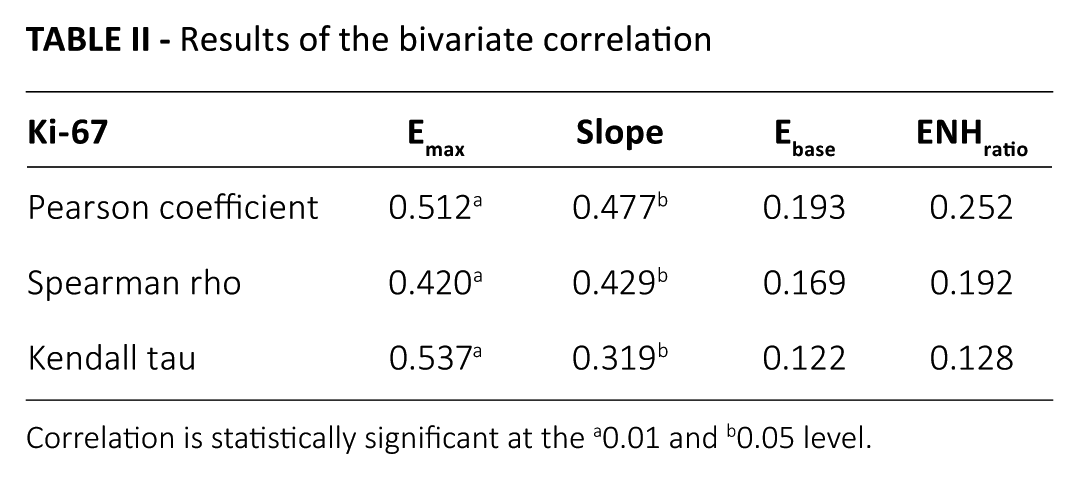
Correlation is statistically significant at the a0.01 and b0.05 level.
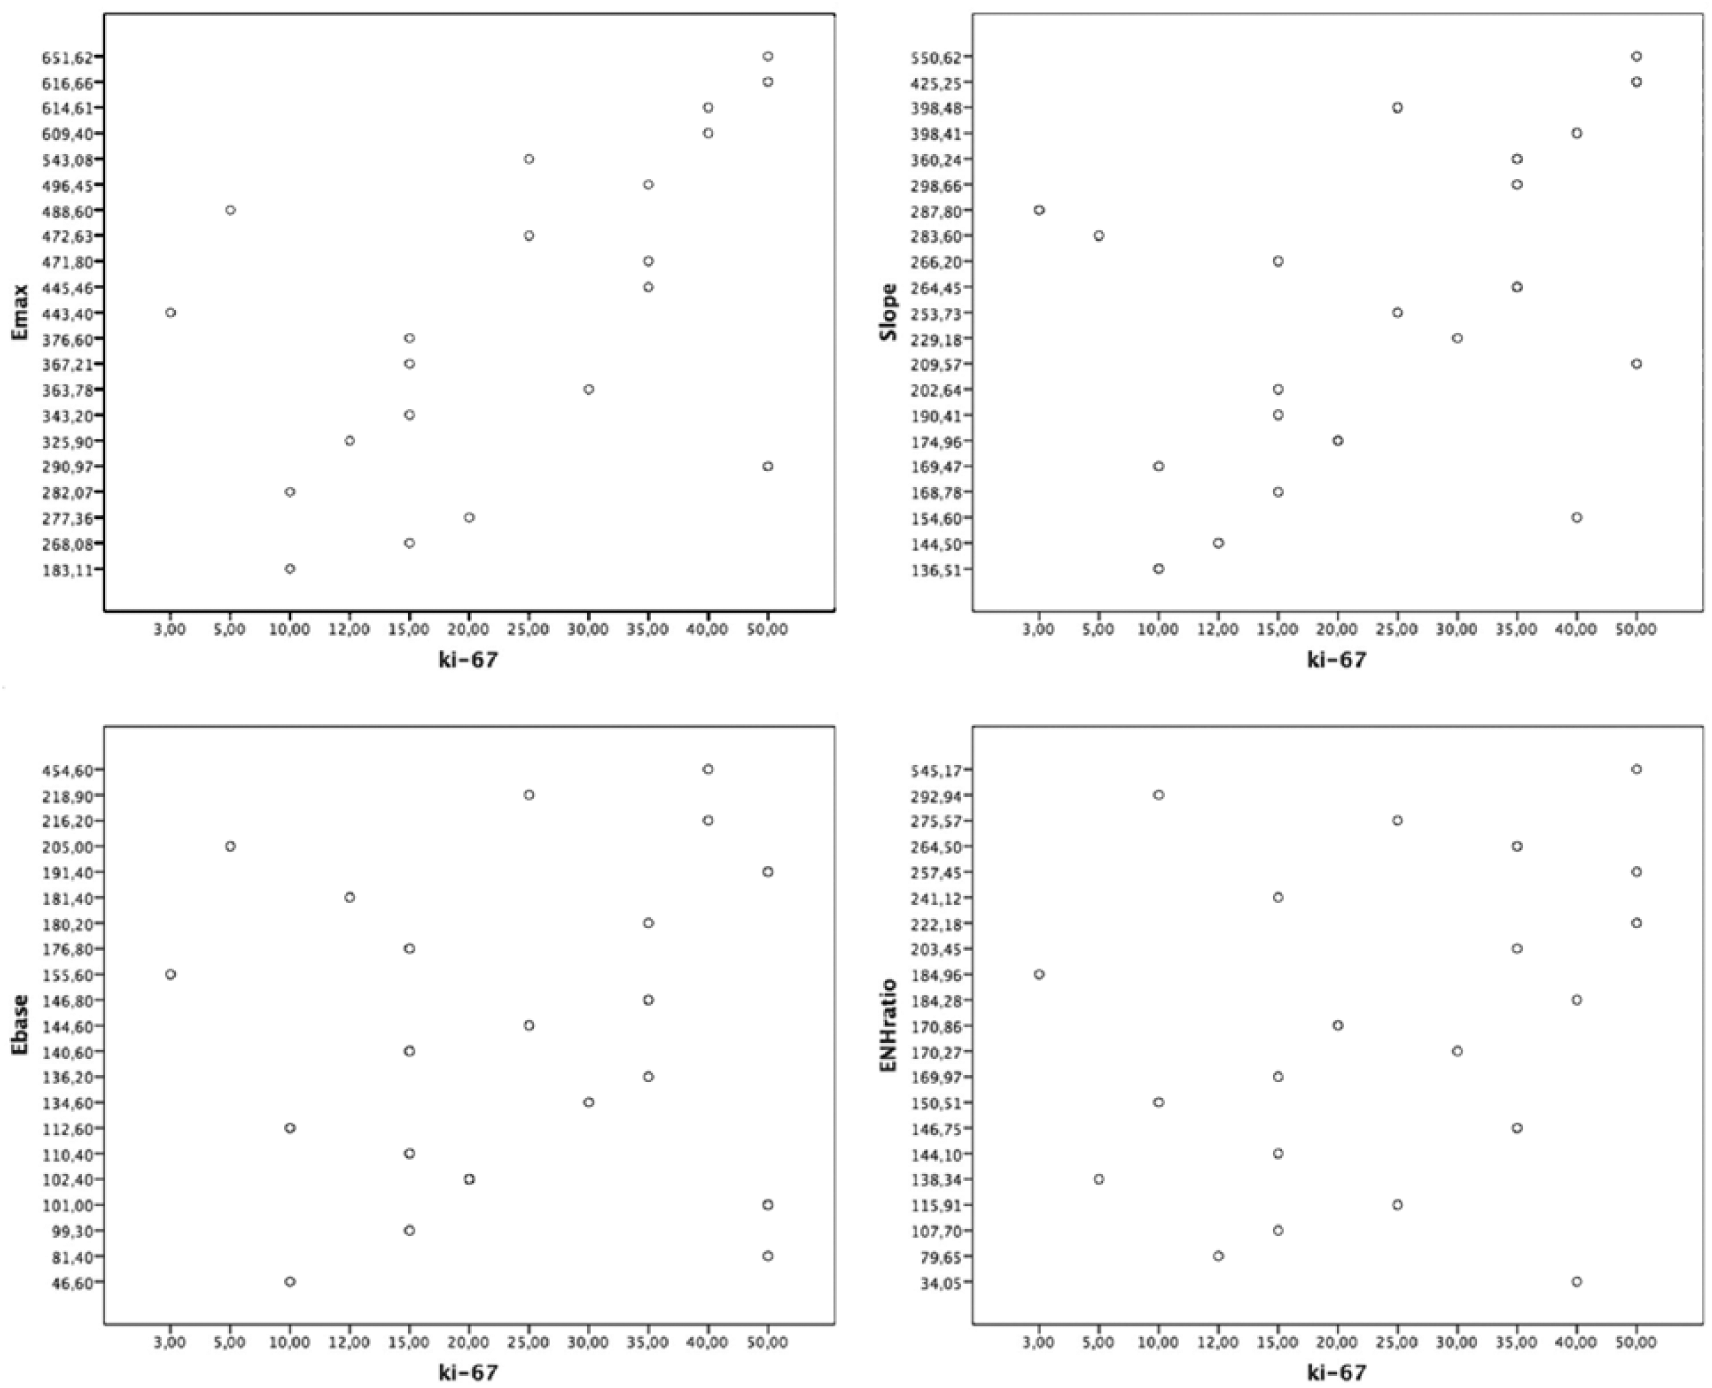
Scatterplots show a correlation between Ki-67 and magnetic resonance imaging parameters.
Discussion
The role of prognostic factors in estimating breast cancer prognosis is accepted worldwide. The value of MRI in the management of breast cancer is debated. In the last decade, the dynamic features of contrast-enhanced breast MRI have been studied in depth. Although the growing importance of MRI kinetic factor is well-established in the diagnostic route, it is unknown in the prognostic setting. Reviewing the literature on breast MRI, few studies have focused on the relationship between MRI enhancement parameters and prognostic factors in breast cancer (3, 7, 13, 14). These studies investigated whether the enhancement parameters could anticipate kinetic data, thus acting as prognostic indicators. The process of enhancement has been previously studied evaluating enhancement pattern or ratio, time to peak, washout ratio, and initial slope, in correlation with the following prognostic factors: histotype, tumor size, grading, lymph node status, ER, PR, HER2, Ki-67, p53, and microvessel density (15-20).
We hypothesized that differences in contrast enhancement derive from the higher vascularization of the neoplastic tissue, whose hypercellularity stimulates neoangiogenesis. Therefore, we analyzed the enhancement curves, calculating Ebase, ENHratio, Emax, and Smax. Ebase was the basal value of healthy tissue enhancement, ENHratio was considered a quantitative measure of the tumor enhancement compared to the healthy tissue, Emax was the peak value of maximum enhancement within the tumor, Smax was meant to be a measure of the enhancement progression in the time unit, and Ki-67 proliferation index was intended as a measure of hypercelluarity. Although recent studies reported a correlation between vascular endothelial growth factor expression, as a sort of neoangiogenesis index, and different prognostic factors, Ki-67 has been rarely considered among these (10, 11).
Our hypothesis was that a significant difference in the MRI kinetic measures could correlate to cell proliferation, which was represented by Ki-67 value.
These preliminary data show a positive correlation between Ki-67 and ENHratio, Emax, Smax, and Ebase, but it is stronger and statistically significant only for Emax and Smax. Although the Pearson correlation test and the scatterplots suggest a linear correlation only, without any relationship of causality, the association could be hypothesis-generating. The largest limitation of our study is the sample size, but if further studies on a larger cohort confirm our results we will infer that the enhancement pattern is closely linked to breast cancer proliferation, thus proving the relationship between more proliferating tumors and more rapidly enhanced lesions. To the date of data analysis, our study is the first to consider Ki-67 as a numeric value rather than a dichotomic variable being higher or lower than a fixed value, in order to demonstrate that it could strictly vary and be predicted on the basis of MRI kinetic features.
Currently, more new parameters are taken into account in order to gain as much information as possible from imaging, but most of them rely on diffusion coefficient and MRI parameters, which can be evaluated by radiologists (3, 7, 21-23). Magnetic resonance imaging could be a useful tool to discriminate between very aggressive and rapidly growing tumors and less proliferating tumors, which could be clinically relevant. Breast MRI indeed could be helpful in predicting cancer prognosis even before histologic evaluation or response to treatment in the neoadjuvant setting. Many countries do not perform preoperative core biopsies and schedule surgery after fine needle aspiration. In these selected cases, MRI adding more information to the primary diagnosis could guide the surgeon through the choice of the best primary treatment (i.e., surgery versus chemotherapy). Certainly, some lesions show specific features that could change the MRI, such as central necrosis, rather than noninvasive carcinoma, thus influencing the prognostic estimation. Thus preoperative MRI evaluation should always be included in a detailed analysis of all imaging and pathologic tools available in order to make the best decision for the patient (5, 6, 24).
To date, both imaging data and biomarkers have been investigated to monitor the in vivo tumor response to neoadjuvant therapy, but there is no consensus on the optimal method (24). In this setting, breast MRI could emerge as a noninvasive method to assess the modification in tumor vascularization during the treatment, thus providing a surrogate of tumor response (25-27). Recent studies have already proved the correlation between changes in the magnetic resonance vascular map or apparent diffusion coefficient and response to primary chemotherapy; Emax and Smax could similarly give information about tumor changes in the neoadjuvant setting in an even simpler way, as they can be calculated by the radiologist or the surgeon on the basis of the enhancement curve (26, 27).
Conclusion
Our preliminary data show that there is a positive and statistically significant correlation between Ki-67 and Emax and Smax and should be intended as hypothesis-generating. If further studies with a larger population confirm our results, we could infer that more proliferating tumors result in more rapidly MRI-enhanced lesions.
Magnetic resonance imaging Emax and Smax values could therefore be prognostic of the final pathology Ki-67 score and predictive of tumor progression and response to either adjuvant or neoadjuvant treatments; nevertheless, further studies are needed to confirm these findings.
Footnotes
Disclosures
Financial support: No financial support was received for this submission.
Conflict of interest: None of the authors has conflict of interest with this submission.